Sample Category Title
US Dollar at 3 Month High After Dovish ECB Awaits Fed and Jobs Report
US tax reforms advance as ECB avoids taper tantrum
The US dollar is trading higher against all major pairs in a week with little data. The week ahead in markets will be full of indicators as well as political events that will impact markets.
The Bank of Japan (BOJ) will release its monetary policy statement near midnight Monday, October 30 EDT to be followed by the central bank's outlook report and a press conference Tuesday, October 31 at 2:30 am EDT. Investors are not expecting a change in rates and the stimulus program, but see room in the economic outlook to introduce downgraded inflation expectations.
US jobs week will kick off on Wednesday, November 1 at 8:15 am EDT with the release of the ADP private non-farm payrolls report. Last month data was impacted by bad weather in the US and is expected to be higher than the 135,000. The forecast for private payrolls is a gain of 191,000. The Fed will wrap up its two-day monetary policy meeting on Wednesday and will release its rate statement at 2:00 pm EDT. A rate hike is forecasted for December given that the CME FedWatch Tool assigns close to 99 percent probability, but only 1.5 percent in the November 1 meeting.
The Bank of England (BoE) will host a Super Thursday on November 2 at 8:00 EDT when it released the quarterly inflation report, monetary policy, rate announcement, minutes and a press conference with BOE Governor mark Carney. The central bank is expected to raise rates by 25 basis points as inflation is rising above the target. The rate hike would mark the first lift to the borrowing rate in 10 years.
The grand finale of the week's data deluge will come in the form of the biggest indicator in the market. The U.S. non farm payrolls (NFP) will be released on Friday, November 3 at 8:30 am EDT. Central bank monetary policy divergence is back on the table as a dovish ECB has boosted the US. A strong employment report with the emphasis on wage growth could once again spark a dollar rally if the Trump pro-growth policies continue to take form.
The EUR/USD lost 1.51 percent in the last five days. The single currency is trading at 1.1598 in the aftermath of the European Central Bank (ECB) decision to cut back the amount of bonds it would buy from the market down from 60 billion euros to 30 billion a month. The ECB was trying to avoid the move being read by the market as a tightening of monetary policy. The U.S. Federal Reserve had tried this previously and failed, when just the mention the central bank was going to reduce its QE program back in 2013 unleashed a surge in US Treasury yields as investors sold fixed income instruments.
To avoid a taper tantrum the ECB President also delivered a firm stance on keeping rates low and to reduce the aggressive cut in bonds, the central bank also extended the duration to the program. The EUR had risen on the back of hawkish comments from the central bank in the summer and while a taper was expected it was also known that the bank was pulling all the stops to avoid a tantrum. Mission accomplished. The EUR is lower as the QE program has been reduced but it is still open ended with low rates still the policy going forward.
The USD was higher after the ECB decision and climbed higher as the Trump Administration's efforts to reform the tax code continue to move forward. The promise to reform taxes was one of the main drivers of the Trump rally after the US presidential election, but as the Administration focused on other fronts the greenback lost traction. Now back on track the currency is appreciating versus peers. Fed leadership uncertainty has also plagued the market, with the list of candidate apparently down to two. Fed Governor Jerome Powell and Stanford economist John Taylor. The financial press on Friday was pointing at Powell as the preferred pick, which was a negative for the USD as he is expected to continue on the same line as current Fed Chair Yellen. That does not necessarily mean he is dovish, but not as hawkish as the other option. There is still the possibility that Taylor gets appointed as Vice Chair, as both positions are open for the President to fill them.
Market events to watch this week:
Monday, October 30
- Midnight JPY Monetary Policy Statement
Tuesday, October 31
- Tentative JPY BOJ Outlook Report
- Tentative JPY BOJ Policy Rate
- 2:30 am JPY BOJ Press Conference
- 8:30 am CAD GDP m/m
- 10:00 am USD CB Consumer Confidence
- 5:45pm NZD Employment Change q/q
Wednesday, November 1
- 5:30 am GBP Manufacturing PMI
- 8:15 am USD ADP Non-Farm Employment Change
- 10:00 am USD ISM Manufacturing PMI
- 10:30 am USD Crude Oil Inventories
- 2:00 pm USD FOMC Statement
- 2:00 pm USD Federal Funds Rate
- 8:30 pm AUD Trade Balance
Thursday, November 2
- 5:30 am GBP Construction PMI
- 8:00 am GBP BOE Inflation Report
- 8:00 am GBP MPC Official Bank Rate Votes
- 8:00 am GBP Monetary Policy Summary
- 8:00 am GBP Official Bank Rate
- 8:30 am GBP BOE Gov Carney Speaks
- 8:30 am USD Unemployment Claims
- 8:30pm AUD Retail Sales m/m
Friday, November 3
- 5:30 am GBP Services PMI
- 8:30 am CAD Employment Change
- 8:30 am CAD Trade Balance
- 8:30 am CAD Unemployment Rate
- 8:30 am USD Average Hourly Earnings m/m
- 8:30 am USD Non-Farm Employment Change
- 8:30 am USD Unemployment Rate
- 10:00 am USD ISM Non-Manufacturing PMI
*All times EDT
Weekly Economic and Financial Commentary: U.S. Manufacturing Strengthening with Global Growth
U.S. Review
U.S. Manufacturing Strengthening with Global Growth
- Non-defense capital goods orders ex-aircraft, our preferred gauge of future business investment, rose a strong 1.3 percent in September, the third consecutive monthly gain of that size.
- New home sales rebounded 18.9 percent in September to a 667,000-unit annual rate, the highest level of new home sales since October 2007.
- Real GDP grew at a 3.0 percent annualized rate in Q3, topping expectations for a 2.6 percent gain. Given the possibility for hurricane-related noise in the quarterly data, the print appeared relatively devoid of head-scratching outliers.
U.S. Manufacturing Strengthening with Global Growth
On Wednesday, preliminary data on durable goods orders in the United States showed a continued firming in factory sector data to end the third quarter. Durable goods orders rose 2.2 percent in September, boosted by another double-digit jump in the volatile civilian aircraft component. Communications equipment posted a suspiciously large gain, so there may have been some additional noise generated by the recent release of the new iPhone.
Non-defense capital goods orders ex-aircraft, our preferred gauge of future business investment, rose 1.3 percent in September, the third consecutive monthly gain of that size. This string of strong prints puts the three-month average annualized rate at 11.6 percent, the fastest pace of growth since the eve of the steep decline in the price of oil in September 2014. With three-quarters of the year in the books, the recovery in the factory sector that has taken place in 2017 has built momentum in the second half of the year (top chart). The strong dollar/weak global growth/falling commodity price story that characterized the past two years has reversed in 2017, turning these headwinds into tailwinds for the sector. Manufacturers have responded by increasing payrolls by 104,000 jobs this year.
Housing data this week were encouraging, as new home sales rebounded 18.9 percent in September to a 667,000-unit annual rate, the highest level of new home sales since October 2007. The new home sales series is notoriously volatile and has bounced around even more than usual due to the relatively low absolute level of sales. Sales surged 25.8 percent in the South and accounted for nearly 80 percent of September's increase. The number of homes for sale was unchanged, but the stronger sales pace cut the months' supply by a full month to 5.0 months. Homes priced for $300,000 or more accounted for most of the sales gain, lifting both average and median home price measures (middle chart).
The advance release of third quarter GDP this morning capped the week of U.S. economic data. Given the possibility for hurricane-related noise in the quarterly data, the print appeared relatively devoid of head-scratching outliers. Real GDP grew at a 3.0 percent annualized rate in Q3, topping expectations for a 2.6 percent gain. Real personal consumption grew at a trend-like 2.4 percent in the quarter, while business equipment spending posted another solid quarter of growth (8.6 percent following an 8.8 percent gain in Q2). Residential construction saw a second quarterly decline, and government consumption and investment was slightly down, weighed down by the state & local component.
The firming global growth environment and softer dollar have helped boost economic growth in the United States. International trade once again added positively to growth, boosting the headline real GDP number by 0.4 percentage points amid a 2.3 percent gain in exports and a small decline in imports. Net exports have been additive to growth in all three quarters of the year so far, the first string of three consecutive boosts to growth since a stretch that ran from mid-2012 through Q1-2013 (bottom chart).
U.S. Outlook
Personal Income • Monday
After increasing 0.2 percent in August, personal income growth is expected to strengthen 0.5 percent in September. Wage growth has improved in recent months, including a solid rise in hourly earnings in September. We also expect to see some support from income earned on financial assets, as the stock market hit a fresh high in September.
After adjusting for inflation, the pickup in income will look less impressive. The PCE deflator, the Fed's preferred measure of inflation, likely rose 0.4 percent last month. Much of the rise can be traced to higher energy prices, while core inflation is expected to rise only 0.1 percent. Spending will have also gotten a lift from higher energy prices, as well as strong auto sales. We forecast personal spending to have risen 0.7 percent in September.
Previous: 0.2% (Month-over-Month) Wells Fargo: 0.5% Consensus: 0.4%
ISM Manufacturing • Wednesday
Last month's ISM manufacturing index climbed to a 13-year high of 60.8. That was in part driven by a surge in supplier delivery times following Hurricanes Harvey and Irma. Even stripping out the delivery component, however, the ISM manufacturing index has signaled strengthening activity. In addition to a rise in production and employment, the new orders index improved to 64.6 last month while backlogs have been growing this year at the strongest pace since the mid-2000s.
We expect the ISM manufacturing index to signal a slightly slower pace of growth in October. The lower reading will be driven by payback from the storm-related lengthening of delivery times last month. At 59.6, however, the ISM would be consistent with activity in the manufacturing sector still expanding at a robust clip.
Previous: 60.8 Wells Fargo: 59.6 Consensus: 59.5
Employment • Friday
Last month's 33,000 decline in employment snapped a nearly seven-year string of uninterrupted job growth. The decline in employment was attributable to the recent hurricanes having disrupted hiring plans and preventing some jobholders from working during the survey period. Those distortions should be largely unwound in October, however. Initial jobless claims have fallen back below 240,000, the level that prevailed in the months leading into hurricane season.
We expect to see hiring rebound to 280,000 in October as employers catch up on hiring and workers return to their jobs. The unemployment rate, however, is anticipated to tick up to 4.3 percent following last month's suspiciously large 906,000-jump in household employment.
Previous: -33,000 Wells Fargo: 280,000 Consensus: 310,000
Global Review
Less Policy Accommodation Slowly Coming Into View
- The ECB decided this week to "taper" its QE program further due, at least in part, to strong growth momentum. However, benign inflation means that any rate hikes are still some ways off.
- Stronger-than-expected U.K. GDP data in Q3 means that a rate hike by the Bank of England is likely at next week's Monetary Policy Committee meeting.
- The Bank of Canada remained on hold this week, but it continued to indicate that further tightening, albeit at a slow pace, is likely in the quarters ahead.
Less Policy Accommodation Slowly Coming Into View
The European Central Bank (ECB) held a regularly scheduled policy meeting on Thursday and, as widely expected, the Governing Council decided to "taper" its quantitative easing (QE) program further (see chart on front page). Specifically, the Governing Council announced that it would dial back its monthly rate of bond purchases from €60 billion to €30 billion starting in January, and that it would maintain that pace through September 2018, "or beyond, if necessary."
Recent data out of the euro area indicate that the economy does not need as much policy support as it did earlier. Real GDP in the Eurozone was up 2.3 percent in Q2-2017, the strongest rate of economic growth in more than six years, and the elevated level of the purchasing managers' indices suggest that growth momentum in the euro area remained solid in the third quarter (top chart).
However, inflation in the euro area remains benign—the core rate of CPI inflation was only 1.1 percent in September—indicating that a complete removal of policy accommodation probably would not be appropriate at this time. The Governing Council kept its three policy rates unchanged, and it continued to stress that they would "remain at their present levels for an extended period of time, and well past the horizon of our net asset purchases." In short, rate hikes in the Eurozone are probably some ways off still.
In contrast, monetary tightening in the United Kingdom likely will happen sooner rather than later. Data released this week showed that real GDP in the United Kingdom grew 0.4 percent (1.6 percent at an annualized rate) on a sequential basis in the third quarter (middle chart). The outturn was slightly stronger than many analysts had expected, and it stoked expectations that the Monetary Policy Committee (MPC) of the Bank of England (BoE) will hike rates by 25 bps at its policy meeting next week.
We had thought the MPC would wait until February before hiking rates, but the stronger-than-expected GDP result in conjunction with the still elevated rate of CPI inflation (3.0 percent in September) mean that a rate hike next week now seems likely. If, as we now expect, the MPC indeed raises its Bank Rate by 25 bps next week, it would be the first time that the MPC has hiked rates in more than 10 years. But any tightening that the MPC undertakes in the coming year likely will occur at a slow pace.
As widely expected, the Bank of Canada (BoC) refrained from raising its main policy rate this week. The BoC had hiked rates by 25 bps at its last two policy meetings (bottom chart), so a third consecutive rate hike seemed a bit aggressive to most market participants. In the press release announcing the decision, the BoC acknowledged that "less monetary policy stimulus will likely be required over time," but that it "will be cautious in making future adjustments to the policy rate." In other words, further rate hikes will be forthcoming but the pace of tightening likely will be slow. In that regard, we look for the BoC to hike rates by a total of 50 bps next year.
Global Outlook
Eurozone GDP • Tuesday
Next Tuesday will provide us with the advanced GDP report for Q3 as well as the October CPI report for the Eurozone. Economic growth has become increasingly broad based in recent quarters amid steady employment gains and improving business sentiment. The expansion has led to firmer conditions in the labor market. However, despite the solid rate of real GDP growth and the tightening in labor market conditions, inflation remains benign.
Real GDP accelerated in the Eurozone in Q2, as the year-ago pace of economic growth crossed the 2 percent threshold for the first time since Q1-2011. The outturn marks the 17th consecutive quarter in which real GDP has risen on a sequential basis. Real GDP in the overall euro area is up 7.0 percent since the mild 2011-13 recession ended. We expect GDP in the Eurozone to grow 2.4 percent in Q3, year over year, and to expand 2.2 percent and 2.1 percent in 2017 and 2018, respectively.
Previous: 2.3% (Year-over-Year) Wells Fargo: 2.4% Consensus: 2.3%
Mexico GDP • Tuesday
Mexican Q3 GDP is slated for release next Tuesday. The monthly data flow for July and August has not been as robust as one might have hoped. Industrial production started the quarter on a negative note, with construction activity declining 1.0 percent versus June, before increasing just 0.3 percent in August. Mining activity declined 2.3 percent while utilities output fell 0.5 percent on the month.
A bright spot in the Mexican economy is the manufacturing sector, which is largely driven by its automobile production. Manufacturing activity increased 0.5 percent in August from July and is up 3.3 percent on a year-earlier basis. Perhaps one of the most important reasons why the current NAFTA renegotiation process taking place between the United States, Canada and Mexico is so noteworthy is that the Mexican automobile sector is one of the most vital industries of Mexican production activity. We look for GDP to grow 1.9 percent in Q3.
Previous: 1.8% (Year-over-Year) Wells Fargo: 1.9%
Bank of England (BoE) Meeting • Thursday
Financial markets appear convinced that the BoE will hike rates at the conclusion of the Monetary Policy Committee's (MPC) meeting on November 2. The implied probability of an interest rate hike as of this morning was 88.7 percent. Previously we had thought the MPC would hold off and hike rates at the February meeting, however, the stronger than expected GDP data helped convince us to agree with the market expectation. The forthcoming rate hike from the BoE will likely be an increase in the Bank Rate by 25 bps, the increment in which it has tightened policy in the past.
Regardless of when the first move occurs, the pace of tightening through 2018 will likely remain gradual as inflation begins to recede and economic growth remains modest. Moreover, shadows cast by the ongoing Brexit negotiations continue to create uncertainly surrounding the U.K.'s relationship with the European Union moving forward. The MPC will likely proceed with caution.
Previous: 0.25% Wells Fargo: 0.50% Consensus: 0.50%
Point of View
Interest Rate Watch
Two and Tens, Alternative Forces
Since the start of this year, the behavior of the two and ten-year Treasury benchmark interest rates have behaved differently as each reflects the influence of alternative economic forces (top graph). As a result, the spread between the ten and two-year has declined throughout 2017.
Two Year: Upward Drift.
Since the start of 2017, the two-year yield has drifted upward. This is consistent with two factors: policy intentions and inflation. Since the fourth quarter of 2016, the policy intentions of the FOMC have signaled a pattern of rising fed funds rate increases consistent with an outlook for rising inflation, continued economic growth and lower unemployment. The economy has cooperated.
For the FOMC, the dot-plot has signaled their intentions. For the economy, the steady drift upward in the Cleveland Fed median CPI measure (middle graph) has reinforced the FOMC's and financial market expectations. Therefore, the two year rate has reacted in line with the rise of inflation and therefore, the expected follow-on rise in the Fed Funds rate.
Ten-Year: Three Factors to Follow
Since the start of this year, the ten-year Treasury rate has drifted lower despite the rise in the two-year rate. The buy side of the Treasury market has been a key support for lower ten-year yields. First, the increase in foreign purchases of U.S. Treasury securities (bottom graph) has been a welcome turnaround from the declines of 2016. The global search for yield continues to benefit the U.S. sovereign debt market. Second, the pace of overall U.S. economic growth and inflation has remained modest and therefore the case for higher nominal GDP growth which was popular at the start of the year has moderated and thereby supported the case for a moderation of the ten year yield.
We began the year with a below consensus forecast for the ten-year rate and that has served us well. We are on the path to be more accurate than the consensus on the ten-year forecast for the fourth year in a row. Fundamentals matter in forecasting.
Credit Market Insights
Vehicle Ownership Down, Debt Up
Vehicle ownership rates began falling after the recession and have continued to decline since. Only 85.2 percent of families owned a vehicle in 2016, compared to 86.3 percent in 2013, according to the survey of consumer finance.
Urban areas tend to have lower vehicle ownership rates: 84.8 percent of metro area residents owned vehicles in 2016 versus 87.9 percent of rural residents. Meanwhile, urban areas are also seeing the bulk of population growth. In 2016, U.S. metro areas grew by more than 2 million people, while rural areas only added 40 thousand. Therefore, more families are living in dense cities with alternatives to vehicle transport.
Increasingly cities are prioritizing public transportation as part of an effort to attract new workers. Amazon included mass transit access as a requirement for the future location of its HQ2, highlighting the importance of car-free mobility to its young, educated workforce. This suggests that lower vehicle ownership is not transitory, but an effect of fundamental shifts in lifestyle.
As fewer families own vehicles, those who do owe more on their vehicles. Median vehicle debt rose by $500 to $12.8K from 2013 to 2016. Families in the lowest income quintile saw their vehicle debt rise the fastest, by 44 percent to $7.9K over the same period. Higher debt, especially for borrowers with lower credit, is a concern for delinquency rates.
Topic of the Week
Where Are We Headed with Wage Growth?
After years of strong employment growth, the path of wage and income growth is critical for policymakers at the Fed as they weigh additional monetary policy tightening. Indicators suggest gradual improvement: average hourly earnings, the Atlanta Fed Wage Growth Tracker and the Employment Cost Index (ECI) are all currently above their expansion averages on a year-overyear basis, and the trends are broadly upward.
Looking forward, will wages continue to strengthen? We believe the answer is yes. Indicators of slack in the labor market have finally reached full employment levels across a broad range of metrics. Both the traditional U-3 unemployment and the broader "underemployment" or U-6 rate are at previous cycle lows, survey-data suggest businesses are increasingly struggling to find qualified workers and the employment-population ratio for prime-age workers has finally returned to a more normal level. Although the road has been long and arduous, the return to full employment should spur greater competition for increasingly scarce labor resources, pushing up compensation.
That said, compensation is unlikely to return to the previous cycle-peak growth rates anytime soon. The fundamental drivers of wage growth are not conducive to the 4-6 percent growth range that occurred at the peak of previous expansions. Workers' earnings should reflect their output, or in other words productivity. While productivity serves as the "real" driver of wage growth, workers also need to be compensated for inflation. During the current cycle, inflation and labor productivity growth have been persistently slow, making it not altogether surprising that earnings growth has been sluggish relative to previous cycles.
Next week, we get more information on recent wage and income growth with the release of personal income, ECI and average hourly earnings data. We expect personal income to be up 2.8 percent in Q3 and ECI to rise 2.5 percent over the same period, almost flat with Q2. For more information on the differences between wage indicators, see our recent report "525,600 Metrics: How Do You Measure a Year in Income Growth?"
Week Ahead – Fed and BoJ Meet But All Eyes on BoE; US Jobs Also in Focus
Central bank meetings will dominate the next seven days as the Bank of England, the Bank of Japan and the US Federal Reserve all hold their policy meetings. It will be a big week for economic indicators as well, as the Eurozone releases preliminary GDP figures and the October jobs report is out in the United States.
Australian, New Zealand and Canadian data eyed after aussie, kiwi and loonie take a battering
Political concerns in Australia and New Zealand have taken the Australian and New Zealand dollars to multi-month lows this week, while a less hawkish Bank of Canada and uncertainty about NAFTA's future have dragged the Canadian dollar to above C$1.28 per US dollar. The aussie may find some support from a batch of data releases out of Australia next week, which will include private sector credit (Tuesday), building approvals (Thursday) and retail sales (Friday).
In New Zealand and Canada, employment figures will be the main focus. The jobless rate for the third quarter will be watched by kiwi traders on Tuesday. Concerns about New Zealand's new Labour coalition's economic policies has bruised the kiwi in forex markets. Indications of an improving labour market may alleviate the currency's pain.
Over in Canada, if Monday's monthly GDP estimate for August and Friday's employment report were to point to strong growth, the loonie might get a lift from revived expectations of another rate hike in the coming months.
Bank of Japan expected to lower inflation outlook
As other central banks move towards tighter monetary policy, the Bank of Japan looks nowhere near starting the normalization process. With inflation still running below 1% and new dovish members joining the Bank's board, there is still a debate within the BoJ if it should be doing more to bring inflation towards it's 2% goal. The Bank is widely expected to hold policy unchanged on Tuesday when it concludes its two-day policy meeting. But it's latest quarterly outlook report could reveal another downward revision to the inflation forecasts.
The policy divergence with other advanced economies is likely to keep the yen weaker for a while longer even as growth in Japan starts to gather momentum. Major indicators to watch next week are household spending, unemployment rate and industrial output, all of which are due on Tuesday.
Eurozone flash GDP and inflation in the spotlight
After the European Central Bank's dovish tapering decision this week, economic growth and inflation numbers will keep the euro under the limelight next week. Preliminary data due on Tuesday is expected the show the Eurozone economy expanding by 0.5% during the third quarter of the year. That would be slightly weaker than the 0.6% rate enjoyed in the second quarter. The annual rate is expected to pick up slightly from 2.3% to 2.4%. Inflation meanwhile, is forecast to moderate from 1.5% year-on-year in September to 1.4% in October's flash reading. The core rate, which excludes food and energy prices and is more closely watched by the ECB, is also expected to ease by 0.1 percentage points to 1.2%. Before the inflation and GDP figures, the economic sentiment index should attract some attention on Monday.
Bank of England ponders rate hike
The UK's initial estimate of GDP for the third quarter showed a slightly stronger-than-expected growth of 0.4% quarter-on-quarter, a modest improvement on the prior three months' 0.3% rate. The data raised the odds that the Bank of England will raise rates next week, though the market-implied probability (currently at around 70%) is still below the level it was before two of the Bank's deputy governors cautioned against a premature rate increase in the past fortnight. Many economists also share the view that an early tightening could prove to be a mistake. Rate hike speculation had driven the pound to a 15-month high of $1.3656 in September but the mixed signals from policymakers, along with Brexit concerns, pushed sterling to a 3-week low of $1.3068 today. If the BoE does go ahead and raise rates next Thursday as expected by most analysts, a possible narrow majority could hurt the pound as it would indicate limited support for additional rate rises in the coming months.
Also important next week will be the Markit/CIPS PMIs for manufacturing (Wednesday), construction (Thursday) and services (Friday).
Busy week for dollar with FOMC meeting and abundance of US data
The Federal Reserve could struggle for attention next week as no move is expected by the central bank, while a number of major economic data are released. Starting with personal income and consumption figures on Monday, both are forecast to rise strongly in September after a weak August. The personal consumption expenditure report (PCE) will also contain the latest core PCE price index. The Fed's favourite inflation gauge had fallen to a two-year low of 1.3% y/y in August and a further decline could weaken the case for higher interest rates. Business surveys (Chicago PMI, CB consumer confidence) will be the main items on the calendar on Tuesday.
On Wednesday, the ISM manufacturing PMI is expected to show October was another robust month for US manufacturers after rising to a 13-year high in September. The Fed will take centre stage later in the day and will likely signal a rate hike for December. With no press conference scheduled for November, the FOMC meeting is not anticipated to be a very eventful one.
There will be more excitement for traders on Friday as the October jobs report is published. The hurricanes hitting the US East Coast caused a 33k fall in nonfarm payrolls in September - the first drop in seven years. They are expected to rebound by a massive 310k in October, while the unemployment rate is forecast to remain unchanged at 4.2%. Average earnings though could ease from 2.9% to 2.7% y/y in October, with the strong labour market so far doing little in boosting wages, hence the unease at the Fed about going too fast on raising rates.
Another big release will be the ISM non-manufacturing PMI for October. Factory orders and trade balance figures for September will complete the barrage of data on Friday.
Q3 GDP: Hurricanes Dampen Growth, Sunshine Tomorrow
GDP rose 3 percent in the third quarter as domestic sectors showed some evidence of temporary moderation due to storms, but the economy is expected to sustain solid real growth in the fourth quarter and for 2018.
Domestic Spending: Slower Now, Longer-term Perspective
In the third quarter, spending by the consumer and business slowed as real final sales (top graph) came in at 2.3 percent compared to a gain of 2.9 percent in the second quarter and 1.9 percent for 2016. Government was a small drag on growth. In perspective, real GDP growth has averaged 2.7 percent since 1982, although the pace of growth in the current expansion is only 1.7 percent, down from 2.6 percent in the prior expansion. Going forward for real GDP, we expect a gain of 2.6 percent in the fourth quarter and 2.4 percent for 2018.
Consumer spending grew at 2.4 percent in the third quarter (3.3 percent in Q2) with gains in durables but slower in non-durables and services relative to their Q2 pace. This moderation is consistent with the slower pace of real disposable income and a modest hurricane effect. For investment, equipment was solid but structures fell while another real hit came in for residential investment (hurricane impact in TX and FL), which fell for the second quarter in a row. For the government sector, the real story is a second quarter of decline in state & local spending. So far this year, spending by state and local governments has been relatively flat.
Trade and Inventories: A Partial Score
Trade and inventory numbers provide a significant measure of volatility in initial and revised GDP estimates. The initial estimate for trade is that net exports will add 0.4 percent to GDP growth, with exports up 2.3 percent with gains in both merchandise and service exports, while imports fell 0.8 percent.
During Q3 inventories added 0.7 percent and this was a part of our forecast miss. For the second half of 2017, we anticipate a gradual reversion to the average gain in inventories for this expansion, in line with gains in final sales for both farm and non-farm inventories. This outlook is corroborated by the gains in the PMIs indices for inventory building. Inventory investment can be quite volatile over the business cycle (middle graph). In the current cycle inventory investment downshifted sharply in 2016/2017 compared to 2013-2015.
Prices: Sideways - Evidence for Caution in Policy for Investors
Overall GDP prices came in at 2.2 percent in the Q3, with the PCE deflator coming in at 1.5 percent, below the FOMC's 2 percent target.
Inflation, as measured by the PCE deflator, is not mean reverting, in fact, the pace of inflation has trended down since 1982. The PCE deflator has averaged 2.4 percent since 1982, 1.8 percent since 1994 (NAFTA) and 1.5 percent in the current recovery.
This pace of GDP growth would bring forth an FOMC increase in the fed funds rate in December and again one move in the first half of 2018 as well as a modest rise in the benchmark two and ten year Treasury rates.
Elliott Wave Analysis: USD Index Trading Bullish
Good day traders! Let's look at USD Index and its 4h view.
USD Index broke to a new high of the month recently, so we have to respect what market is doing and go with the flow. It's a sharp rise from the last 24 hours that acts like a wave three of three so more upside is expect as wave 3)/C) is an impulsive wave, so it must be made by five subwaves. Based on Fibonacci projections there is room for 96.00, while market is above 93.79.
USD Index, 4H
Australia & New Zealand Weekly: Inflation Has Gone AWOL
Week beginning 30 October 2017
- Inflation has gone AWOL.
- Australia: private credit, house prices, trade balance, dwelling approvals, retail trade.
- NZ: residential building consents, business confidence, employment, labour cost index.
- China: official and caixin PMIs.
- Euro Area: GDP, CPI.
- UK: BoE policy decision.
- US: FOMC policy decision, PCE deflator, employment cost index, non-farm payrolls.
- Key economic & financial forecasts.
Information contained in this report was current as at 27 October 2017.
Inflation - Inflation Has Gone AWOL
The September quarter continued the run of softer inflation prints as the competitive margin squeeze remains firmly in place. Dwelling costs have lifted a bit and rising power bills are coming through but rent inflation remains very modest. So even with inflationary expectations drifting back towards the long-run average (we suspect power bills may be responsible for this) the September release is painting a picture that suggests the Australian economy may be in a low inflation (or lowflation) trap.
In the quarter, the CPI rose 0.6% for an annual pace of 1.8%yr while the average of the core measures gained 0.4%qtr/1.9%yr. The September quarter CPI has some significant seasonality with the seasonally adjusted estimate rising just 0.4%qtr which was 0.2ppt lower than the headline estimate.
The core measures, which are seasonally adjusted and exclude extreme moves, rose broadly as we had expected (0.35%qtr vs our 0.29%qtr forecast). In the quarter, the trimmed mean gained 0.37%, while the weighted median lifted 0.33%, highlighting just how modest the broader inflation picture is outside of housing. At 1.9%yr, core inflation was flat on the Q2 print which was just a modest acceleration from the recent low of 1.5%yr in 2016 Q4. More importantly, the six month annualised pace of core inflation has dipped below the RBA target band printing 1.9%yr. With revisions, the six month annualised pace has only broken into the RBA target band once in the last two years with a 2.1%yr print in the June quarter 2017.
For a broader core inflation measure, more in line with some international measures, all groups excluding food & energy rose 0.5%qtr/1.3%yr.
The softer than expected headline increase was due, at least in part, to food prices being softer than expected. Falling 0.9%qtr, this was driven by a larger than expected fall in the very volatile fruit & vegetables (-6.0%, worth -0.1ppt on the headline CPI compared to our forecast). We expect this to be reversed in the December quarter.
The tobacco excise is reset in the month of September but the 4.1% rise reported by the ABS (worth +0.05ppt compared to our forecast) was a bit stronger than we thought it would be. But more interestingly, the -0.09% fall in clothing & footwear was broadly in line with the trend through the previous three years. More broadly, the intense competition in the retail space has generated a significant deflationary pulse with food prices falling 0.7%% in the year, clothing down 3.2%yr, furniture down 3.1%yr and appliances down 2.6%yr. Even international holidays & travel has seen prices fall 1.6% in the year.
In the September quarter, there was an interesting upside surprise from recreation prices with audio, visual & computing prices jumping 1.2% while holiday travel was also stronger rising 1.9% vs our 0.4% forecast (due to a solid 4.1% lift in international holidays & travel). All up, the gains in recreation prices were worth +0.1ppt compared to our forecasts. We will continue to watch this sector as the rise in September was about double what you would normally expect and may be a sign that, at least in this sector, prices may have now entered a stronger trend.
The more interesting story was in housing costs which rose 1.9% vs our expectation of 2.6%. Dwelling purchases were a little stronger than we thought they would be but the bigger surprise was the softer than expected rise in utilities (6.8% vs 9.8% forecast). Electricity bills rose 8.9% vs our forecast of a 13% rise with Sydney power bills a touch softer than what we had expected. However, the key difference was the lack of price adjustment in Melbourne. If Melbourne electricity prices hold to the usual seasonal pattern, this suggests we should be looking for a meaningful jump in Melbourne power bills in the March quarter of 2018.
This smaller than expected rise in utility costs was worth around 0.2ppt on the headline CPI compared to our estimate. Hence this discrepancy explains a large part of why the headline print was 0.1ppt lower than our 0.7%qtr forecast.
Tradable prices are deflating again falling 0.3% in the September quarter, and breaking it down further, tradable goods fell 0.6%, mostly due to fruit & vegetable & auto fuel, while tradeable services rose 3.9% (mostly due to international holidays & travel). The tradables components represent approximately 35% of the CPI.
Non-tradables do reveal some inflationary pressure with a 1.0% gain in the September quarter. Non-tradable goods are where the strongest gains can be found with a 2.0%qtr increase on the back of rising electricity (8.9%) and tobacco (4.1%) prices. Here we would note two points; firstly it appears that rising electricity prices are having a bigger impact on margins than overall final goods and services prices; and secondly, the impact in the surge in tobacco prices will be moderated from the December quarter by the reweighting of the CPI which will see a reduction in the effective contribution of tobacco to the CPI. Non-tradable services gained 0.5%qtr with a 2.7% rise in motor vehicle services and 2.6% rise in property rates & charges. Non-tradables represent approximately 65% of the CPI.
For now, we are forecasting headline inflation to peak at 2.5%yr in the September quarter of 2018 but it is important to note that this is a bottom up estimate using the current sector weights in the CPI. Our preliminary estimate suggests that the reweighting of the CPI could shave between 0.2ppt and 0.4ppts off the annual rate of inflation by end 2018 (see "Upcoming CPI re-weighting to lower inflation"). And perhaps even more important, given that the run of soft updates point to the Australian economy being in a low inflation trap, it does appear that the risks to the underlying parameters of these forecasts also lie to the downside. We will be updating our inflation forecasts for the November market outlook and we expect that any revisions to our inflation profile will be to the downside.
The Week that Was
This week, the Australian Q3 CPI was the focal point for markets. We also saw key events conclude in China and Europe.
Starting with the CPI, both the headline and core results were below the market's forecast but very close to our own, the headline and core actuals coming in at 0.6%/1.8%yr and 0.35%/1.9%yr. By and large, where there were discrepancies between our forecasts and the ABS figures, the actuals disappointed. For further detail, see the essay above.
On the basis of this report, it is difficult to see Australia breaking out of the current low-inflation 'trap'. Our forecasts currently see annual headline inflation plateauing around 2.5%yr from September 2018. However, that excludes the anticipated negative impact of the December 2017 CPI re-weighting which should knock 0.2-0.4ppts off the pace of annual inflation by the end of 2018. Taking that into consideration, we foresee annual inflation around the bottom of the RBA's target range through 2017 and 2018 - a strong justification for the RBA to remain on hold through 2019.
Turning to China, the 19th National People's Congress drew to a close this week. Highlighting his position of strength, President Xi's "Thought on Socialism with Chinese Characteristics for a New Era" and belt and road initiative were written into the Party's Charter and he was also affirmed as the nation's "core" leader. Further, the structure of the new Politburo Standing Committee left no doubt that Xi Jinping plans to remain China's leader past the end of his second term as President (which runs from now until 2022).
From an economic standpoint, crucial to the outlook is the belt and road initiative and the drive to pursue productivity and efficiency. To make the next stage of China's economic development a reality, there is a need to upskill the population and provide opportunities for them to move into higher paid positions that will not only aid growth in total household income and wealth, but also see it distributed more equitably. Also crucial to the outlook is the broad array of financial and regulatory reforms that are in motion in China. These include, but are not limited to, improving the structural health of the banking and financial system; targeted deleveraging in some sectors; the aligning of foreign investment by Chinese nationals to the nation's objectives; protecting households' wealth and developing greater awareness of the risks associated with investments and debt; as well as the need to deepen capital account convertibility and financial market capacity.
Also on China, it is worth quickly highlighting the latest China property price report. In recent months, we have seen a broadening of price declines across the 70 cities that report. The vast majority of cities are still experiencing price gains, but authorities' actions are clearly being felt more. Arguably, officials are trying and target a period of price stability on average across the nation. That will mean some markets see modest price declines (after a very strong run up) while other less-developed regions continue to experience gains.
For Australia, the more important point to highlight is the clear downtrend in residential investment growth which, if sustained, will weigh on commodity prices and potentially demand. Together with the continuing downtrend in public and private business investment, softer residential investment supports our view that growth in China is set to slow, from 6.8% in 2017 to 6.2% in 2018.
Finally in Europe, the October ECB meeting delivered long-awaited detail on the plan to taper asset purchases in 2018. Broadly the decision was in line with our expectation. €30bn in purchases will occur per month from January to September 2018, down from €60bn per month in 2017. Further, President Draghi was at pains to highlight that the majority of the Council regarded the new program as open ended. To our mind, that speaks to another extension past September 2018, likely only for three months at around €15bn to smoothly phase out purchases. All things considered, it is likely that the ECB will find it much more difficult to justify balance sheet reduction and/or an increase in their policy rate (the refi rate) than in the US. The ECB's inflation forecast of just 1.5%yr in 2019 speaks to the substantial degree of slack that remains in their economy as well as the slow progress being made. We do not foresee any meaningful policy tightening in the Euro area over the forecast period, and would argue that risks to the outlook are skewed to the downside.
Chart of the Week: Major central bank balance sheets
Recently, both the Fed and the ECB have reduced the accommodative support provided by their balance sheets.
After the Fed maintained a period of steady holdings, October marked the beginning of balance sheet normalisation which involves the gradual cessation of reinvesting a set amount of maturing securities.
This week's ECB announcement of a taper of their asset purchases to €30bn per month from €60bn sees the Bank continue on the path towards phasing out the program.
However, with Japan still seeing underlying muted inflation and Abe's election victory, it is likely that the BoJ's Yield Curve Control policy will continue to see them active in the JGB and other financial asset markets.
New Zealand: Week Ahead & Data Wrap
We expect next week's labour market report to show a solid rise in employment over the September quarter, though only slightly outstripping the growth in the working-age population. Strong net immigration flows have bolstered the workforce in recent years, but that pulse is now clearly in decline.
A range of indicators suggest that New Zealand's labour market has continued to strengthen this year, even as the wider economy has entered a period of slower growth. Business surveys report that firms have been hiring at a rapid pace and intend to continue doing so, though skilled workers are becoming increasingly difficult to find. And in our quarterly employment confidence survey, households were optimistic about job opportunities for the first time in nine years.
We are wary that the labour market tends to be a laggard in the economic cycle. For example, unemployment didn't start to fall consistently until several years after the recovery from the financial crisis began, and wage growth has been even slower to respond. So there's good reason to expect a solid set of labour market reports for the September quarter, but there are some clouds on the horizon for the jobs market next year if the current growth slowdown persists.
From the Household Labour Force Survey (HLFS), we expect a solid 1% rise in employment. That follows an unexpected 0.2% fall in the June quarter, which was at odds with a swathe of otherwise strong indicators for that period. We have a suspicion that the revamp of the HLFS in June last year may have altered the seasonal pattern of the employment series (though it will take several more years of data from the new survey to confirm this). If this is the case, we see the risks towards a stronger rise in employment in the September quarter as payback from the previous weak reading.
The drop in employment last quarter was accompanied by a sharp fall in the labour force participation rate, from a record high of 70.6% to 70.0%. We expect some of that drop to be unwound too. But given the potential for unpredictable moves in both of these series, we recommend focusing on the unemployment rate as the more reliable gauge of the jobs market. We expect a modest improvement in the unemployment rate from 4.8% to 4.7%, which would be the lowest rate since December 2008.
The decline in unemployment over the last few years has been a gradual one. Nevertheless, the labour market is moving closer to what could be considered 'tight' territory - that is, an unemployment rate that is associated with rising inflation. There's no agreement as to what constitutes 'tight', but the experience of the last decade provides a useful guide. Wage growth began to tick up in the early 2000s as the unemployment rate fell below 5%, but it really took off once unemployment fell below 4%.
We expect the Labour Cost Index (LCI) to show a mild pickup in underlying wage growth in the September quarter - largely as compensation for inflation, which has picked up from its lows. However, the headline LCI result is likely to be dominated by the impact of the recent equal pay settlement for caregivers in the health sector. This historic agreement will boost the wages of around 55,000 workers over the next few years, with the biggest increase coming into effect in July this year. We also expect to see some spillover to wage rates in associated occupations.
We estimate that this wage increase will add 0.4% to the LCI for the September quarter. Taking out that impact, our forecast implies a modest uptick in annual labour cost growth, from 1.7% to 1.8%. That doesn't sound like a big shift, but the LCI tends to evolve slowly over time - a 1.8% rise would be the strongest annual increase in nearly five years.
Developments in the labour market are in many ways entwined with the trends in immigration. New Zealand has seen a major shift in migration trends in recent years, with the balance swinging from around zero five years ago to a record net inflow of 72,400 people in the year to July. That has fuelled a strong lift in the working-age population, which is up by 2.4% over the last year.
Immigration has a complex interaction with the labour market. A rise in people numbers adds to both demand and supply within the economy as a whole. But the impact varies across sectors. For instance, an inflow of people is likely to be a net demand factor for the housing market - everyone needs somewhere to live, but only a small fraction of migrants go to work in the homebuilding industry.
It will be equally complex to tease out the implications of a slowdown in net migration, as we're expecting over the next few years. The newly-formed Government's policies are only one factor in this. The Government plans to tighten eligibility for student visas and low-skilled workers, which it estimates will reduce arrivals by 20-30,000 per year.
But this will come on top of a decline in net migration that is already underway. The key change has been a lift in departures of non-New Zealander departures, which have risen more than 20% in the last year. We've been expecting this for some time: a rise in arrivals, particularly those on temporary visas, is typically followed by some proportion of them leaving again, with an average gap of around three years. If that pattern holds, we can expect to see a further rise in departures over the next couple of years.
Even before the election, we were factoring in a drop in net migration to around 33,000 per year by the close of the decade (arrivals down ~20,000, departures up ~18,000). Now, with policy changes likely to put a further brake on arrivals, it's likely that the decline will be even more substantial.
Data Previews
Aus Sep private credit
Oct 31, Last: 0.5%, WBC f/c: 0.5%
Mkt f/c: 0.5%, Range: 0.3% to 0.7%
- Private credit is expected to expand by 0.5% in September, matching the average pace for the September and June quarters. Annual growth will be 5.6%.
- Housing credit is expected to increase by 0.5%, 6.6%yr. There is an emerging gradual slowing after a tightening of lending conditions. The 3 month annualised pace eases to 6.3%, down from 6.8% in March. The total value of housing finance grew by 15% in the year to January, but has stalled since.
- Business credit has emerged from a soft spot to record robust growth of late. We expect a gain of around 0.4%, bringing the 6 month annualised pace to 6.0%, while annual growth will be about 4.8%. Commercial finance has rebounded since February and business investment has turned around from declines to modest gains.
Aus Oct CoreLogic home value index
Nov 1, Last: 0.3%, WBC f/c: flat
- The overhauled CoreLogic indexes provide a much more reliable guide to price changes and are now a clear 'benchmark' measure. In Sep, the combined capital city index rose 0.3%, annual growth slowing to 8.5%. Annual price growth peaked at 11.4% in May but has slowed materially as macro-prudential measures introduced in late March impacted. The slowdown in price growth has been particularly abrupt in Sydney.
- The daily measure points to a flat result in Oct, which will take the annual pace down to around 7%yr.
Aus Sep dwelling approvals
Nov 2, Last: 0.4%, WBC f/c: -3.0%
Mkt f/c: -1.0%, Range: -13.6% to 3.0%
- Dwelling approvals rose 0.4% in Aug, essentially holding steady after an 11% jump back in June. The detail showed high rise approvals continuing to pull back sharply but offset by a strong lift in non-high rise approvals.
- We expect the support from non-high rise segments to drop away this month. After showing solid gains in previous months, construction-related housing finance approvals - a reasonable proxy for non high rise approvals - pulled back sharply in Aug-Sep. While there is invariably some slippage between finance and dwelling approvals, the non-high rise segment is unlikely to see continued strong gains. With high rise still winding down we expect total approvals to fall 3% in the Sep month.
Aus Sep trade balance, AUDbn
Nov 2, Last: 1.0, WBC f/c: 1.40
Mkt f/c: 1.20, Range: 0.45 to 2.00
- Australia recorded a $1.0bn trade surplus in August, the 9th surplus in the past 10 months.
- The surplus is expected to widen to $1.4bn in September.
- Export earnings are forecast to increase by 1.2%, $0.4bn. Increased shipments in iron ore and coal outweigh a temporary dip in LNG volumes and a decline in the iron ore price, while gold is expected to rebound, reversing a modest pull-back in August.
- Imports are expected to be unchanged in the month. Note that the dollar was broadly flat in the month, up only 0.1% on a TWI basis and 0.7% higher against the US dollar, rounding up to 79.7¢.
Aus Sep retail trade
Nov 3, Last: -0.6%, WBC f/c: 0.3%
Mkt f/c: 0.4%, Range: 0.2% to 1.2%
- Retail sales came in well below expectations in Aug recording a 0.6% contraction with Jul's flat result revised down to a 0.2% dip. Annual growth slowed to 2.1%, the weakest pace since June 2013. The 0.8% contraction over Jul-Aug is the largest 2mth decline since October 2010, near the tail-end of the RBA's 2009-10 tightening cycle.
- Consumer sentiment lifted in Sep-Oct, although pressures on family finances remained evident. Some drags, from higher mortgage rates and electricity prices, likely eased a touch and job gains remain strong but weak wages growth and concerns about potential rate increases and slowing housing markets are still clear negatives. Retailers are bearing the brunt of the spending slowdown and engaged in aggressive price discounting at the same time. We expect a better but still weak 0.3% gain for Sep.
Aus Q3 real retail sales
Nov 3, Last: 1.5%, WBC f/c: -0.1%
Mkt f/c: 0.0%, Range: -0.4% to 0.5%
- The last four quarters have been very choppy for real retail sales, a flat Q3 last year, sales followed by a decent 0.8% bounce in Q4, another abrupt slowing as weather conditions impacted in Q1 (+0.2%) and a stronger gain in Q2 (+1.5%). At 2.5%yr, annual growth has slowed overall and is weak by longer term historical standards.
- The Q3 update will show another abrupt slowing with volumes expected to be down slightly in outright terms (-0.1%qtr). Nominal sales are on track to be down 0.2%qtr. The CPI detail suggests about half of this is due to aggressive discounting, food prices alone down 0.9%qtr (this segment accounts for 40% of retail). Note that the retail measure remains an imperfect guide to the broader spending estimates in the national accounts - although the direction for Q3 looks accurate.
NZ Sep residential building consents
Oct 31, Last: 10.2%, WBC f/c: -7.0%
- Residential building consents jumped by 10% in August. The increase was driven entirely by consents for multiples (apartments, townhouses etc) which had their single biggest month in 13 years. This followed a shockingly low number in July.
- Smoothing through the month-to-month volatility, the pace of building in Auckland has flatlined over the last year, at a level well short of what's needed to match population growth. We continue to see moderate increases in most other regions excluding Canterbury.
- We expect the September consent figures to show an 8% drop in issuance as the recent volatility in multiple-consent passes. The underlying trend remains for moderate increase in building as factors such as the slowing housing market weigh on activity.
NZ Oct business confidence
October 31, Last: 0.0
- New Zealand business confidence fell to a two-year low (0.0) in September, following a slightly soft result in August. While September's survey reflected the impact of election uncertainty, October's survey is likely to boast further concerns regarding the ensuing coalition discussions. However, given the timing of the survey the effect of the change in government is unlikely to be captured this month.
- Firms' own activity outlooks eased to 29.6, a low not seen since Q1 2016. Outside of the election, the September survey supports our slightly softer view of the economic outlook. The own activity results supports a GDP forecast of 2.5-3%, with economic growth for the year likely to ebb on the softer side of the range.
- Capacity utilisation fell sharply in the previous survey. Conversely, inflation expectations rose by 10 basis points to 1.98% (August: 1.88%), which is underpinned by the rise in overall pricing intentions and higher fuel prices observed over the month.
NZ Q3 Household Labour Force Survey
Nov 1, Employment last: -0.2%, WBC f/c: 1.0%, Mkt f/c: 0.8%
Unemployment, last: 4.8%, WBC: 4.7%, Mkt f/c: 4.7%
- A range of indicators suggest that New Zealand's labour market has continued to strengthen this year, even as the wider economy has entered a period of slower growth. We expect the Household Labour Force Survey to show another modest decline in the unemployment rate to 4.7%, which would be the lowest since December 2008.
- Both employment and labour force participation are subject to quarterly volatility. This issue may have been exacerbated by a change to the survey in June 2016, which led to a one-off jump in the level of employment, but in doing so may have disrupted the seasonal pattern of the series. Our forecast of a strong rise in both employment and participation reflects payback for their unexpected declines in the June quarter.
NZ Q3 Labour Cost Index
Nov 1, Private sector last: 0.4%, WBC f/c: 1.0%, Mkt f/c: 0.6%
- With the labour market gradually tightening, and inflation no longer at rock-bottom levels, we expect to see a pickup in wage inflation over the next year or so. The process is likely to be a gradual one, though, as the Labour Cost Index tends to evolve slowly over time.
- However, the September quarter report is likely to see a substantial jump in labour cost inflation, due to the recent equal pay settlement for healthcare workers. (Our understanding is that this will show up in private sector wages, though it's publicly funded.) Excluding this effect, we expect to see a modest uptick in annual labour cost growth, from 1.7% to 1.8%. In the context of this slow-moving series, this would be a five-year high.
UK Bank of England policy decision
Nov 2, Last: 0.25%, WBC f/c: 0.50% Mkt f/c: 0.50%
- The Bank of England left the Bank Rate on hold at its September meeting. However, the MPC noted that activity had actually been a little stronger than they had expected. In addition, the accompanying minutes noted that if activity proceeds as expected "some withdrawal of monetary stimulus was likely to be appropriate over the coming months."
- While we continue to see the longer-term risk for growth as being skewed to the downside, the potential for a prolonged overshoot of the inflation target is clearly weighing heavily on the BOE. As a result, we expect the BOE to increase the Bank rate by 0.25bps at its November meeting. This will still leave the Bank rate at very accommodative levels. Further ahead, adjustments in the Bank Rate are likely to be very gradual.
US FOMC Nov policy meeting
Nov 1, fed funds rate, last 1.125%, WBC 1.125%
- The November FOMC policy meeting is unlikely to provide any new revelations.
- Chair Yellen and the Committee have very clearly highlighted an intention to continue gradually tightening policy, with the next move to come before year-end (i.e. at the December meeting). The market has since responded, almost fully pricing in a December hike. The November meeting will therefore simply confirm an impending move.
- At this juncture, the focus of markets is instead on who will be the next FOMC Chair. A decision is expected to come from President Trump by the end of next week. If the market rumours are to be believed, then Jerome Powell and John Taylor are in prime position. Both could be seen as more hawkish than Chair Yellen. Hence, on announcement, there may be a shift in market rate expectations for 2018.
US Oct employment report and ECI
Oct 31, Employment Cost Index, last 0.5%, WBC 0.7%
Nov 3, nonfarm payrolls, last -33k, WBC 260k
Nov 3, unemployment rate, last 4.2%, WBC 4.2%
- The Employment Cost Index is the best gauge of overall wage and total compensation inflation in the US. In Q3, the annual rate is expected to hold around 2.5%.
- In contrast, a strong bounce is anticipated in nonfarm payrolls in October, 260k+, following the hurricane driven -33k print of September. Note that some of the rebound could also come in the form of a revision to September.
- The jump in household employment in September and an unemployment rate of 4.2% from the household survey (which was not affected by the weather) point to continued strength in the labour market which should be with us for some time yet.
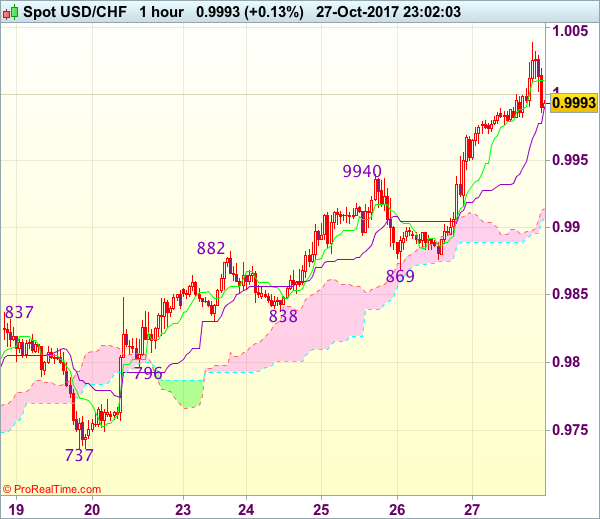
Trade Idea Wrap-up: USD/CHF – Buy at 0.9920
USD/CHF - 1.0000
Most recent candlesticks pattern : N/A
Trend : Up
Tenkan-Sen level : 1.0011
Kijun-Sen level : 0.9991
Ichimoku cloud top : 0.9914
Ichimoku cloud bottom : 0.9907
Original strategy :
Buy at 0.9935, Target: 1.0035, Stop: 0.9900
Position : -
Target : -
Stop : -
New strategy :
Buy at 0.9920, Target: 1.0030, Stop: 0.9885
Position : -
Target : -
Stop : -
As the greenback has retreated after rising to 1.0038, suggesting minor consolidation below this level would be seen and pullback to 0.9960-65 is likely, below would bring correction to previous resistance at 0.9940, however, reckon 0.9920-25 (38.2% Fibonacci retracement of 0.9737-1.0038) would limit downside and bring another rise, above said resistance at 1.0038 would extend recent rise from 0.9421 low to 1.0050-55, having said that, overbought condition should limit upside to 1.0075-80 and price should falter below 1.0100 resistance and bring retreat later.
In view of this, we are looking to buy dollar again on pullback as the upper Kumo (now at 0.9914) should limit downside, bring another rise later. Below 0.9885-90 (50% Fibonacci retracement of 0.9737-1.0038) would defer and suggest top is possibly formed, risk test of support at 0.9869.
Weekly Focus: Packed Week, With Central Banks in Focus
Market Movers ahead
- A host of important data is due out of the US next week, as well as the November FOMC meeting taking place. The meeting is not expected to yield much news.
- We still expect PCE inflation to be subdued, whereas the labour market report for October should come out strong, due largely to the September hurricanes.
- We expect the Bank of England to raise the Bank Rate by 25bp to 0.50%.
- Preliminary Q3 GDP for the euro area is expected to show a continued recovery, albeit with slightly lower growth than in Q2.
- Euro area headline inflation should have ticked down to 1.4% y/y in October (September: 1.5% y/y), due mainly to energy price base effects, leaving core inflation unchanged.
- We expect the Bank of Japan to keep monetary policy ultra-loose.
- Norwegian house prices are likely to attract some attention. We do not expect the recent trend of falling prices to come to an end.
Global macro and market themes
- Central bankers are keen to put the urge for a normalisation of policy on hold for now with the ECB delivering a dovish taper; Scandi central banks are in wait-and-see mode.
- Commodity prices are on the rise but policy makers need to see 'effective' labour market slack erosion before moving towards an 'exit' from unconventional policies.
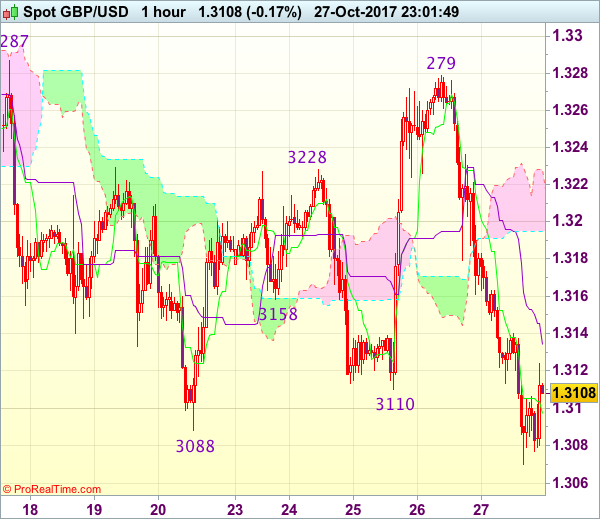
Trade Idea Wrap-up: GBP/USD – Sell at 1.3180
GBP/USD - 1.3114
Most recent candlesticks pattern : N/A
Trend : Near term down
Tenkan-Sen level : 1.3097
Kijun-Sen level : 1.3134
Ichimoku cloud top : 1.3228
Ichimoku cloud bottom : 1.3195
Original strategy :
Sell at 1.3160, Target: 1.3060, Stop: 1.3195
Position : -
Target : -
Stop : -
New strategy :
Sell at 1.3180, Target: 1.3080, Stop: 1.3215
Position : -
Target : -
Stop : -
As cable’s decline from 1.3279 has accelerated and price just broke below indicated support at 1.3088, adding credence to our view that the decline from 1.3338 is still in progress and may extend weakness to 1.3050, then towards recent low at 1.3027, however, break of latter level is needed to retain bearishness and confirm early erratic decline from 1.3658 top has resumed for further fall towards 1.3000 level.
In view of this, we are looking to sell cable on recovery, above the Kijun-Sen (now at 1.3134) would bring corrective bounce to 1.3160 but reckon 1.3180 would limit upside and bring another decline later. Above 1.3195-00 would defer and risk a stronger rebound to 1.3230-35, however, price should falter well below said resistance at 1.3279 and bring another decline later.
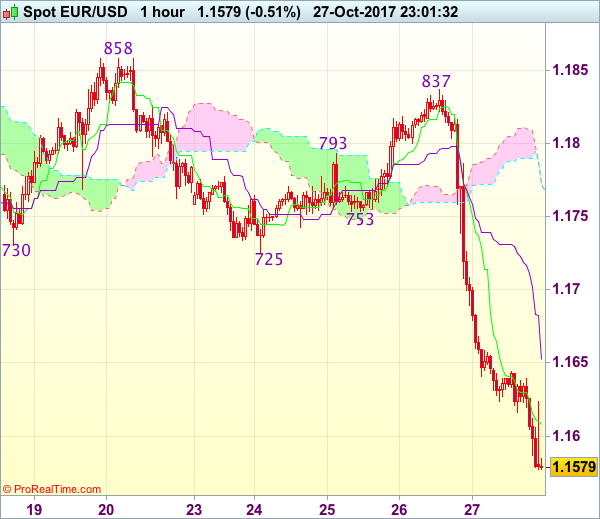
Trade Idea Wrap-up: EUR/USD – Sell at 1.1685
EUR/USD - 1.1583
Most recent candlesticks pattern : N/A
Trend : Down
Tenkan-Sen level : 1.1609
Kijun-Sen level : 1.1652
Ichimoku cloud top : 1.1772
Ichimoku cloud bottom : 1.1772
Original strategy :
Sell at 1.1685, Target: 1.1585, Stop: 1.1720
Position : -
Target : -
Stop : -
New strategy :
Sell at 1.1685, Target: 1.1585, Stop: 1.1720
Position : -
Target : -
Stop : -
Euro’s decline has gathered momentum after breaking below support at 1.1725 yesterday and previous low at 1.1669 was breached as well, adding credence to our view that the fall from 1.2093 top is still in progress and bearishness remains for this move to extend weakness to 1.1570, however, near term oversold condition should limit downside to 1.1550-55 and reckon 1.1520-25 would hold, bring rebound later.
In view of this, we are looking to sell euro on recovery but at a lower level as the Kijun-Sen (now at 1.1652) should limit upside and bring another decline. Only above previous support at 1.1725 (now resistance) would signal an intra-day low is formed, bring retracement of recent decline to 1.1750-55 first.