
Sample Category Title
Trade Idea : USD/JPY – Sell at 114.20
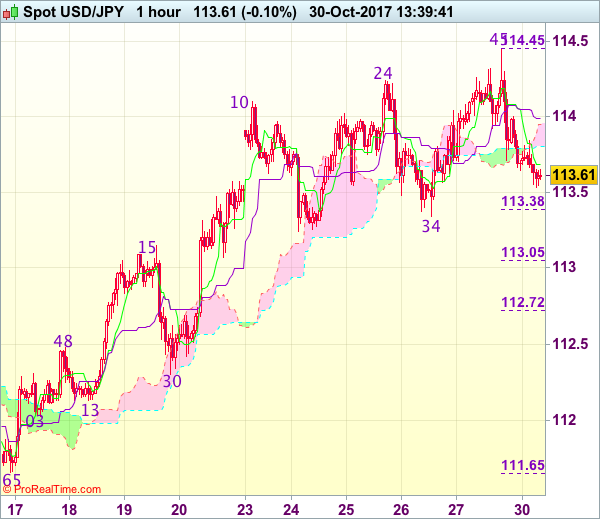
USD/JPY - 113.63
Most recent candlesticks pattern : N/A
Trend : Near term up
Tenkan-Sen level : 113.69
Kijun-Sen level : 113.99
Ichimoku cloud top : 113.95
Ichimoku cloud bottom : 113.80
New strategy :
Sell at 114.20, Target: 113.20, Stop: 114.55
Position : -
Target : -
Stop : -
Dollar’s retreat after Friday’s brief rise to 114.45 suggests consolidation below this level would be seen and weakness to 113.34-38 (previous support and 38.2% Fibonacci retracement of 111.65-114.45), break there would add credence to our view that top has possibly been formed, bring correction of recent rise to 113.05-15 (50% Fibonacci retracement and previous resistance), however, reckon 112.70-75 (61.8% Fibonacci retracement) would remain intact, bring another rise later.
In view of this, we are looking to sell dollar on recovery as 114.20-25 should limit upside, bring another retreat. Above indicated resistance at 114.45-50 would extend recent rise from 107.32 low for further gain to 114.75-80 (61.8% projection of 111.65-114.10 measuring from 113.24), however, overbought condition should limit upside to 115.00 and risk from there is seen for a retreat later.
EUR/USD Elliott Wave Analysis
EUR/USD – 1.1614
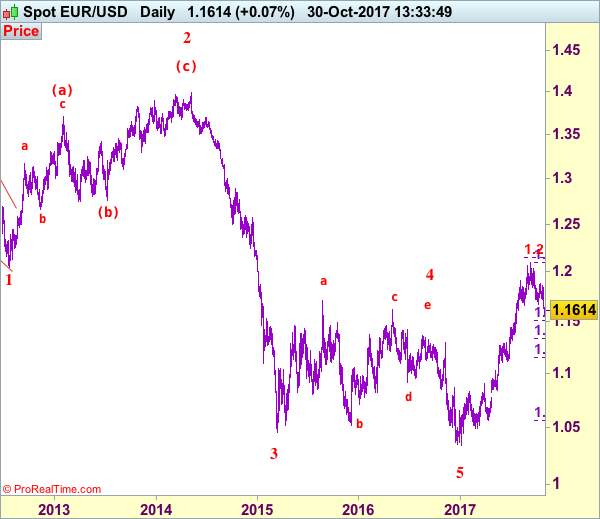
EUR/USD: Wave (c) of 2 ended at 1.3993 and wave 3 of III has commenced for weakness to 1.0411 (1.236 of wave 1), then 1.0000.
The single currency met renewed selling interest at 1.1837 last week and has dropped below indicated previous support at 1.1662-69 (now resistance), dampening our bullishness and suggesting a temporary top has been made at 1.2093 earlier, hence bearishness is seen for the erratic fall from there to bring retracement of recent rise to 1.1550-60, then 1.1510-15 (38.2% Fibonacci retracement of 1.0570-1.2093) but reckon downside would be limited to support at 1.1479 and 1.1330-35 (50% Fibonacci retracement) should remain intact, bring rebound later.
Our preferred count on the daily chart remains that a wave (II) from 1.2329 ended at 1.5145 with A-leg ended at 1.4720, followed by wave B at 1.2457, the wave C from there was also a 3 legged move and is labeled as (a): 1.3739, (b): 1.2885, the wave iii of the 5-waver (c) from 1.2885 has ended at 1.4339 and wave iv is a triangle ended at 1.3878 and wave v formed a top at 1.5145. The decline from there is a 5-waver (C) with minor wave (i) of I of (C) ended at 1.4218 with wave (ii) ended at 1.4580, wave (iii) ended at 1.3267 and wave (iv) ended at 1.3692 and wave (v) ended at 1.1876, this is also the low of wave I of (C) and wave II ended at 1.4940, hence wave III is now in progress with a diagonal wave 1 ended at 1.2042, the breach of previous support at 1.1876 (wave I trough) adds credence to our view that the wave 2 has ended at 1.3993, wave 3 has commenced for further weakness to 1.0411, then towards 1.0000.
On the upside, although initial recovery back to previous support at 1.1662-69 cannot be ruled out, reckon another previous support at 1.1725 would hold and bring another decline later. A daily close above this level would defer and suggest low is possibly formed instead, bring rebound to 1.1790-00 but break of said resistance at 1.1837 is needed to confirm and bring test of key resistance at 1.1880. Looking ahead, only break of 1.1880 resistance would suggest the pullback from 1.2093 has ended, bring further gain to 1.1950-60, then towards 1.2000-05. A break of resistance at 1.2034 would confirm and bring retest of 1.2093, break there would signal recent upmove from 1.0340 low has resumed for headway to 1.2150-55 (61.8% projection of 1.1119-1.1910 measuring from 1.1662), having said that, loss of upward momentum should prevent sharp move beyond 1.2200-10 and price should falter below 1.2255-60, risk from there remains for a much-needed correction to take place later.
Recommendation: Sell at 1.1665 for 1.1465 with stop above 1.1765.
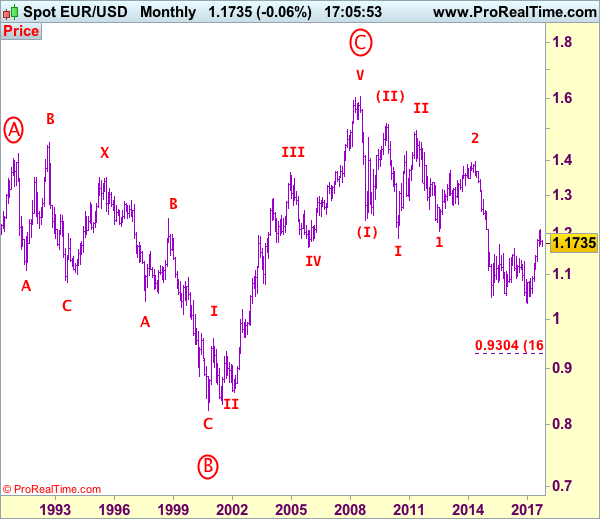
Euro's long-term uptrend started from 0.8228 (26 Oct 2000) with an impulsive structure. The rise from 0.8228 to 0.9593 (5 Jan 2001) is labeled as wave I, the retreat to 0.8352 (6 Jul 2001) is wave II and the rally to 1.3670 (31 Dec 2004) is wave III. Wave IV from there ended at 1.1640 (15 Nov 2005), the subsequent upmove to 1.6040 (July 15, 2008) is treated as wave V, the major selloff from the record high of 1.6040 to 1.2329 (October 27, 2008) signals a reversal has taken place with (I) leg ended at 1.2329 and once (II) ended at 1.5145, wave (III) itself is an extended move with I: 1.1876 and complex wave II ended at 1.4902, wave III has commenced with wave 1 and 2 ended at 1.2042 and 1.3993 respectively, wave 3 of III is now unfolding for weakness towards parity.
USD/JPY Elliott Wave Analysis
USD/JPY - 113.69
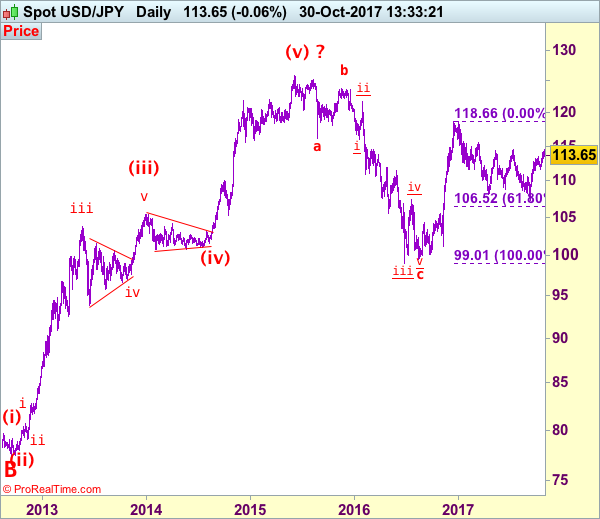
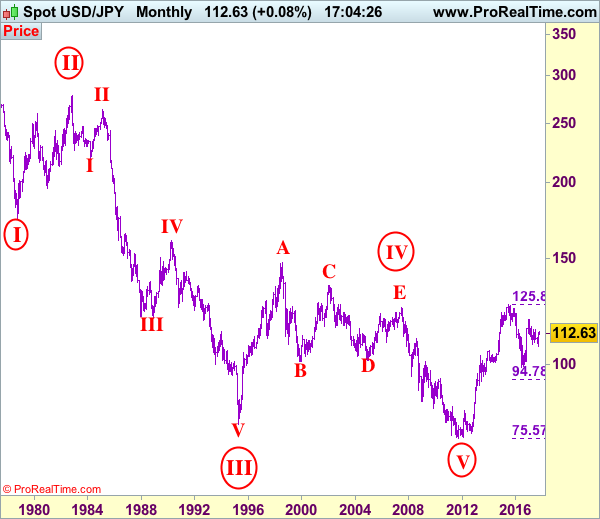
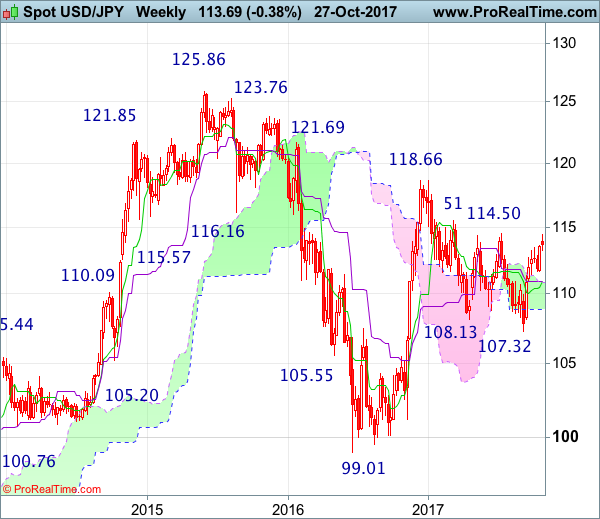
USD/JPY – Wave V of larger degree circle V has possibly ended at 75.31 and major correction has commenced and already met indicated target at 125.00.
Although the greenback edged higher to 114.45, as price has retreated after failing to test indicated previous resistance at 114.50, suggesting consolidation below this level would be seen and pullback to 113.00 and 112.50-60 is likely, however, reckon downside would be limited to 112.00 and renewed buying interest should emerge around previous support at 111.65 and bring another rise later. Above said resistance at 114.45-50 would signal the correction from 118.66 top has ended earlier at 107.32 and the rise from there may extend further gain to 115.00, then previous resistance at 115.51. Looking ahead, a sustained breach above this level at 115.51 would retain bullishness, then further subsequent gain to 116.00-10 and possibly 116.50-60 would follow.
Our preferred count is that, triangle wave IV (with circle) ended at 101.45 and the circle wave V brought dollar down to the record low of 75.31 in 2011 and the subsequent rebound signal major correction has commenced with A leg ended at 84.19, followed by wave B at 77.14 and impulsive wave C is now unfolding (indicated upside target at 125.00 had been met) for gain towards 127.00 level. In the event dollar drops below support at 99.01, this would confirm medium term decline from 125.86 top (2015 high) has resumed for subsequent weakness to 98.00 and possibly 97.00.
Under this count, this wave C is unfolding as impulsive waves with (1) (2), 1 2 ended at 80.67, 79.07, 82.84 and 81.69 respectively, hence the extended wave 3 has ended at 103.74 and wave 4 correction of recent upmove should bring weakness to 92.57, then towards 90.88 but psychological support at 90.00 should limit downside and bring another rally later in wave 5, indicated target at 125.00 had been met and gain to 127.00 cannot be ruled out but reckon price would falter below 130.00.
On the downside, whilst initial pullback to 113.00-10 cannot be ruled out, reckon downside would be limited to 112.50-60 and 112.00 would contain downside, renewed buying interest should emerge above support at 111.65 and bring another rise later. Only a drop below said support at 111.65 would suggest a temporary top is formed instead, bring weakness to 111.00 but downside should be limited to 110.40-50 and support at 109.55 should remain intact. A breach of strong support at 109.55 would abort and suggest the rebound from 107.32 has ended instead, risk weakness to 109.00 and possibly 108.50-60 but price should stay well above said support at 107.32 and bring another rebound later.
Recommendation: Buy at 111.80 for 114.00 with stop below 110.80.
On the monthly chart, we have changed our preferred count that an impulsive wave is unfolding with major wave III with circle ended at 79.75, then followed by wave IV with circle and is labeled as a triangle with A: 147.64 (11 August, 1998), B: 101.25, C: 135.20, D: 101.67 and E leg ended at 124.14 to end the wave IV with circle. Hence, wave V with circle commenced from there and hit a record low of 75.31, however, the subsequent strong rebound signals this circle wave V has possibly ended there, hence gain to (indicated upside target at 122.00 and 125.00 had been met), the retreat from 125.86 suggests wave A of major correction has ended there and wave B correction back to 99.00, then 95.00 would be seen, however, reckon downside would be limited to 90.00, bring another rebound in wave C next year.
EUR/USD Candlesticks and Ichimoku Analysis
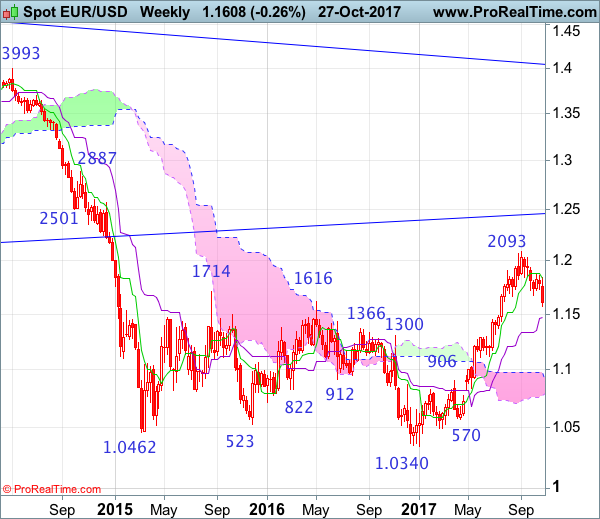
Weekly
• Last Candlesticks pattern: Shooting star
• Time of formation: 31 Jul 2017
• Trend bias: Near term up
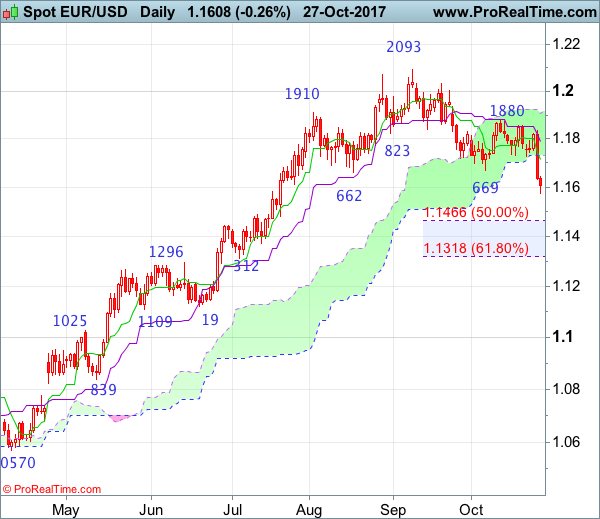
Daily
• Last Candlesticks pattern: Shooting star
• Time of formation: 2 Aug 2017
• Trend bias: Up
EUR/USD – 1.1613
Despite last week’s initial rebound, the single currency ran into renewed selling interest at 1.1837 and dropped below previous support at 1.1662 late last week, dampening our bullishness and signal early upmove has formed a top at 1.2093, hence consolidation with downside bias is seen for the erratic fall from there to bring retracement of recent upmove to 1.1550, then 1.1500, however, near term oversold condition should limit downside to 1.1465-66 (50% Fibonacci retracement of 1.0839-1.2093) and reckon 1.1370 support would hold and price should stay above 1.1312-18 (previous support and 61.8% Fibonacci retracement).
On the upside, whilst an initial recovery back to previous support at 1.1669 (now resistance) cannot be ruled out, reckon 1.1700 would hold and price should falter below 1.1725 (previous minor support) and bring another decline to aforesaid downside targets. Only above the Kijun-Sen (now at 1.1790) would defer and suggest low is possibly formed instead, risk test of resistance at 1.1837 but break there is needed to add credence to this view, bring another bounce to indicated previous resistance at 1.1880 first. Once this level is penetrated, this would signal the fall from 1.2093 has ended, bring test of the upper Kumo (now at 1.1907) first but resistance at 1.2005 should hold.
Recommendation: Sell at 1.1700 for 1.1500 with stop above 1.1800.
On the weekly chart, last week’s selloff formed a black candlestick and the breach of previous support at 1.1662-69 signals a temporary top has been formed at 1.2093, hence consolidation with downside bias is seen for retracement of recent rise to 1.1500, then 1.1466 (current level of the Kijun-Sen and 50% Fibonacci retracement of 1.0839-1.2093), however, reckon downside would be limited to 1.1400 and reckon 1.1312-18 (previous support and 61.8% Fibonacci retracement) would hold, price should stay above previous minor resistance at 1.1296, bring rebound later.
On the upside, expect recovery to be limited to 1.1662-69 (previous support) and renewed selling interest should emerge around (1.1700-10), bring another decline later. Above 1.1790-00 would risk test of said resistance at 1.1837 but only break of this last week’s high would abort and suggest low is formed instead, bring test of resistance at 1.1880 first. Only a break of 1.1880 would suggest the pullback from 1.2093 top has possibly ended and extend gain to 1.1935-40, then towards 1.2035-40. Having said that, break there is needed to provide confirmation, bring retest of 1.2093.
USD/JPY Candlesticks and Ichimoku Analysis
Weekly
• Last Candlesticks pattern: Dark cloud cover
• Time of formation: 10 Jul 2017
• Trend bias: Down
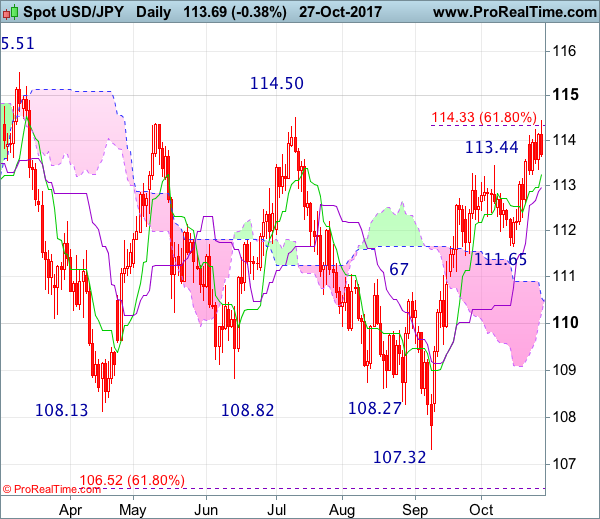
Daily
• Last Candlesticks pattern: Evening doji
• Time of formation: 7 Aug 2017
• Trend bias: Down
USD/JPY – 113.69
Although the greenback resumed recent rise and rose to as high as 114.45 late last week, the subsequent retreat after faltering below indicated previous resistance at 114.50 suggests a week of consolidation below this level would take place and test of the Tenkan-Sen (now at 113.24) is likely, however, a daily close below the Kijun-Sen (now at 112.96) is needed to signal a temporary top has been formed there, bring retracement of recent rise to 112.60, then 112.30 but reckon downside would be limited to 112.00 and previous support at 111.65 should remain intact, bring rebound later.
On the upside, expect recovery to be limited to 114.00 and said last week’s high at 114.45 should remain intact, bring another retreat. A break of said resistance at 114.45-50 would signal early fall from 118.66 has ended at 107.32 and the rise from 107.32 low may extend further gain to 115.50, then previous resistance at 115.51-62, however, loss of momentum should prevent sharp move beyond 116.00-10, risk from there is seen for another retreat later.
Recommendation : Stand aside for this week.
On the weekly chart, after forming a white candlestick the week before, dollar edged higher again last week to 114.45, however, indicated previous resistance at 114.50 continued to cap dollar’s upside and price has retreated, suggesting consolidation below this level would be seen and pullback to 113.00 cannot be ruled out, below there would bring retracement to 112.50-60, then 112.00, however, previous support at 111.65 should hold. Only a drop below this level would signal the rise from 107.32 low has ended there, bring deeper correction to 111.00 but reckon the Kijun-Sen (now at 110.91) would hold on first testing.
On the upside, above said resistance at 114.45-50 would signal the decline from 118.66 top has ended earlier at 107.32, bring further rise to psychological level at 115.00, then test of resistance at 115.51, break there would add credence to this view and encourage for headway to 116.50-60 first, having said that, near term overbought condition should limit upside to 117.00-10, risk from there is seen for another retreat later.
Trade Idea: GBP/USD – Sell at 1.3195
GBP/USD – 1.3144
Original strategy :
Sell at 1.3170, Target: 1.3000, Stop: 1.3230
Position: -
Target: -
Stop: -
New strategy :
Sell at 1.3195, Target: 1.3030, Stop: 1.3255
Position: -
Target: -
Stop:-
As sterling has recovered after falling to 1.3070 on Friday, suggesting minor consolidation above this level would be seen, however, reckon upside would be limited to 1.3200 and bring another decline later, below said support would add credence to our view that the rebound from 1.3027 has ended at 1.3338, then a retest of 1.3027 would follow, having said that, break there is needed to confirm early decline from 1.3658 top has resumed for further fall to psychological support at 1.3000 first.
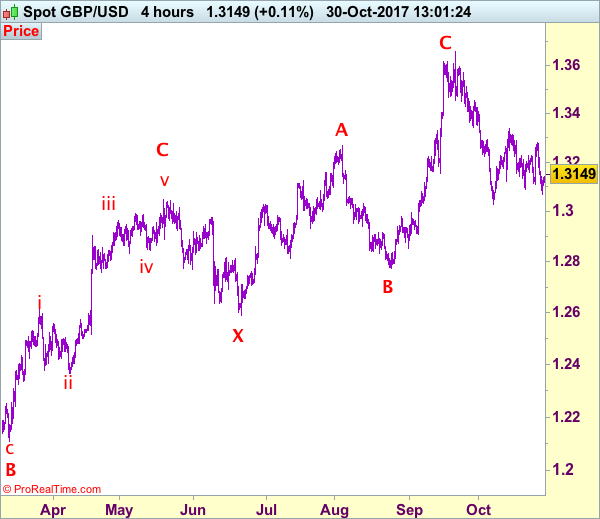
In view of this, we are looking to sell cable on recovery as 1.3200 should limit upside and bring another decline later. Above 1.3240 would defer and prolong choppy consolidation, risk rebound to indicated resistance area at 1.3279-87 which is likely to hold from here. Our preferred count is that (pls see the attached chart) the wave IV is unfolding as a complex double three (ABC-X-ABC) correction with 2nd wave B ended at 1.2774, hence 2nd wave C could have ended at 1.3658.
Our preferred count on the daily chart is that cable's rebound from 1.3500 (wave (A) trough) is unfolding as a wave (B) with A ended at 1.7043, followed by triangle wave B and wave C as well as wave (B) has ended at 1.7192, the subsequent selloff is the larger degree wave (C) which is still unfolding with minor wave (III) of larger degree wave 3 ended at 1.1986, hence wave (IV) correction is in progress which could either be a triangle wave (IV) of a complex formation but upside should be limited to 1.3500 and price should falter well below 1.4000, bring another decline in wave (V) of 3 for weakness to 1.1500, then 1.1200.
Trade Idea: GBP/JPY – Sell at 150.00
GBP/JPY - 149.35
Original strategy:
Sell at 150.00, Target: 148.00, Stop: 150.60
Position: -
Target: -
Stop: -
New strategy :
Sell at 150.00, Target: 148.00, Stop: 150.60
Position: -
Target: -
Stop:-
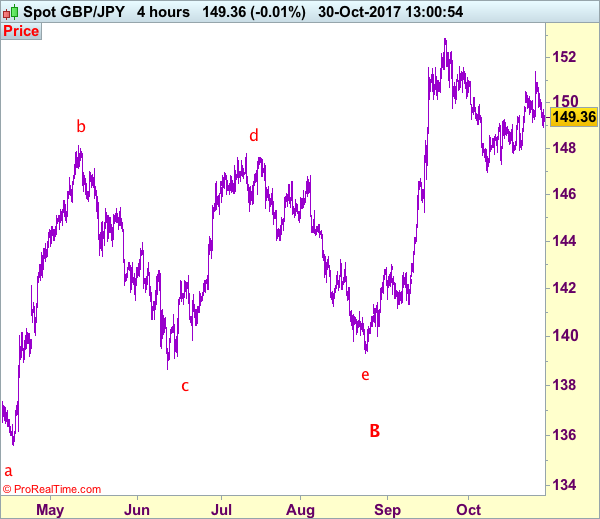
Last week’s sharp retreat from 151.40 together with the breach of previous support at 149.15 add credence to our view that the rebound from 146.95 has ended there and consolidation with downside bias is seen for weakness to 148.50, then 148.00, however, break of support at 147.80 is needed to retain bearishness and signal another leg of decline from 152.85 top is underway for further fall towards said support at 146.95.
In view of this, we are looking to sell sterling on recovery as 150.00-10 should limit upside and bring another decline later. Above 150.50-60 would prolong consolidation and bring rebound to 151.00 but said resistance at 151.40 should hold. Only a break of this resistance would revive bullishness and extend the rebound from 146.95 towards 151.90-00 first.
Our preferred count is that larger degree wave V with circle is unfolding from 251.12 with wave (I) 219.34, (II): 241.38 and wave (III) is subdivided into 1: 192.60, 2: 215.89 (23 Jul 2008) and wave 3 ended at 118.87 earlier in 2009. The correction from there to 162.60 is wave 4 which itself is a double three and is labeled as first a-b-c ended at 151.53, followed by wave x at 139.03, 2nd a ended at 162.60, 2nd b at 146.75 and 2nd c leg of wave 4 ended at 163.00. Therefore, the decline from 163.00 to 116.85 is now treated as wave 5 which also marked the end of larger degree wave (III), hence wave (IV) major correction has commenced for retracement of the wave (III) from 241.38 and upside target at 183.95-00 (50% Fibonacci retracement of the wave (II) from 241.38) had been met, a drop below 160.00 would suggest wave (IV) has ended at 195.85, bring decline in wave (V) for initial weakness to 130 (already met) and 120.
Trade Idea: EUR/JPY – Sell at 132.70
EUR/JPY - 131.97
Original strategy:
Sell at 133.50, Target: 131.50, Stop: 134.10
Position: -
Target: -
Stop: -
New strategy :
Sell at 132.70, Target: 130.70, Stop: 133.30
Position: -
Target: -
Stop:-
The single currency tumbled last week after marginal rise to 134.50, adding credence to our view that top has been formed there and consolidation with downside bias remains for test of previous support at 131.66, break there would provide confirmation and signal correction of early upmove has commenced, hence further fall to 131.00, then towards 130.50-60 would follow but near term oversold condition should limit downside to psychological level at 130.00, bring rebound later.
In view of this, we are still looking to sell euro on recovery but at a lower level as 132.70-80 should limit upside and bring another decline later. Above 133.10 would defer and suggest first leg of corrective decline from 134.50 top has ended, risk a stronger rebound to 133.50-60 but still reckon upside would be limited to 133.95-00, price should falter well below said last week’s high at 134.50, bring another selloff later.
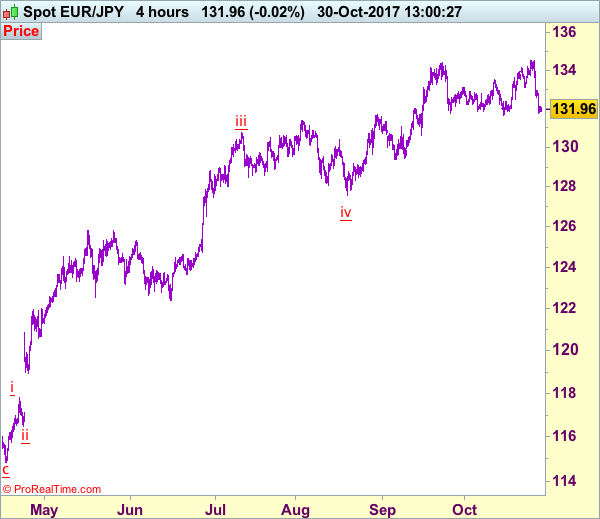
Our latest preferred count is that wave (ii) is ABC-X-ABC which ended at 123.33 and wave (iii) is unfolding with wave iii ended at 100.77, followed by wave iv at 111.57 and wave v as well as the wave (iii) has ended at 97.04, followed by wave (iv) at 111.43 and wave (v) has ended at 94.12 which is also the end of the larger degree v, this also implied the major wave (C) has also ended there, hence major correction has commenced from there with (A) leg unfolding in its lower degree wave c which has possibly ended at 145.69. Under this count, A-B-C wave (B) has commenced with A leg ended at 136.23, wave B at 143.79 and wave C has possibly ended at 149.79.
Our larger degree count is that the decline from 139.26 is wave (C) and is sub-divided into a diagonal triangle i-ii-iii-iv-v with wave i - 105.44, wave ii- 123.33, wave iii - 97.03, wave iv - 111.43, followed by the final wave v as well as the end of wave (C) at 94.12, this also mark the bottom of larger degree wave B. Under this count, major rise in wave C has commenced as an impulsive wave with minor wave III ended at 145.69, wave V is still in progress for further gain to 150.00. Having said that, this so-called wave V could well be the first leg of larger degree 5-waver wave C and this wave C should bring at least a retest of wave A top at 169.97 (July 2008).
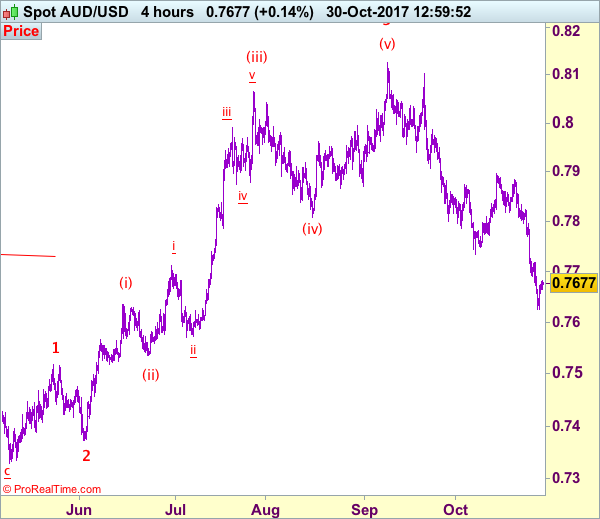
Trade Idea: AUD/USD – Sell at 0.7720
AUD/USD – 0.7676
Original strategy:
Sell at 0.7720, Target: 0.7550, Stop: 0.7780
Position: -
Target: -
Stop:-
New strategy :
Sell at 0.7720, Target: 0.7550, Stop: 0.7780
Position: -
Target: -
Stop:-
As aussie found support at 0.7625 late last week and has rebounded, suggesting consolidation above this level would be seen and corrective bounce to 0.7700 cannot be ruled out, however, reckon 0.7720-25 would limit upside and bring another decline later, below said support would add credence to our view that recent decline from 0.8125 top is still in progress and may extend further weakness to 0.7600, having said that, loss of downward momentum should prevent sharp fall below 0.7550 and reckon 0.7500 would hold from here, bring rebound later.
In view of this, we are looking to reinstate short on recovery as 0.7720-25 should limit upside and bring another decline. Above previous support at 0.7770 would defer and suggest a temporary low is possibly formed, bring rebound to 0.7800 and then towards 0.7825-35 later.
On the 4-hour chart, recent upmove from 0.7329 is unfolding as an impulsive rise with wave 3 as well as smaller degree wave (iii) extending, only minor wave v of (iii) has ended at 0.8125, hence bullishness remains for this move to extend headway to 0.8200, then towards 0.8300, however, reckon upside would be limited to 0.8400 and the final wave 5 should falter below 0.8500, bring correction later.
Market Morning Briefing: The Euro-Yen Fell Further On Friday
STOCKS
Dow (23434.19, +0.14%) is almost stable in the 23250-23500 region but could eventually attempt a rise to 23750. Near term looks range bound with chances of moving up further in the medium term.
Dax (13217.54, +0.64%) looks strong just now and could move up in the coming sessions towards 13500. Bulls are dominant and could take the index higher in the coming weeks.
22666 is the next important resistance on Nikkei (21991.16, -0.08%) and the index could be eventually heading towards it. Before that the interim target of 22250 remains intact for the coming sessions.
Shanghai (3377.92, -1.14%) fell sharply in early trade today losing all the gains seen last week. Now the broad 3350-3430 region is likely to hold in the near term bringing in a bounce in the index within the next couple of sessions.
Nifty (10323.05, -0.20%) has resistance near 10365 on the daily charts. While that holds, the index could come off towards 10250 or lower in the near term before again resuming the upward rally. Near term looks bearish while below 10365.
COMMODITIES
Gold (1271.52) is trading above important support region of 1250-1260 and while that holds could possibly bounce back towards 1290-1300 levels in the near term. That could well go with the resistance on the US Dollar Index which has a decent resistance near 95.00-95.20 which is likely to hold for now.
Brent (60.34) has moved up as expected. Resistance near 61 is likely to hold pushing the crude price to lower levels of 58.
WTI (53.91) is trading just below immediate resistance and if that holds, the price can come down in the next few sessions towards 53.00 or even lower.
Copper (3.0975) has broken below 3.10 much faster than expected maybe due to the fall In the Chinese stock index. Near to medium term looks bearish.
FOREX
Maybe the markets will be a little quiet for a couple of days after last week's volatility. Also, the FOMC is coming up on Wednesday.
The Euro (1.1610), which saw of a low of 1.1573 on Friday, is likely to have Support at 1.1510 while the Dollar Index (94.82) has immediate Resistance at 95.00-20. Both these Support and Resistance could turn out to be relatively strong.
Dollar-Yen (113.65) has come off from Friday's high of 114.45, just below the stated Resistance at 114.50. A break below 113.50 (possible) can lead to test of 113.10-00. Overall upside might be limited to 115.00 in the medium term.
The Euro-Yen (131.92) fell further on Friday and the market might try to explore prospects of fall towards 130 in the next few weeks. However, immediate Support is seen in the 131.50-35 region.
The Pound (1.3138) dipped to 1.3068 on Friday. It has medium term Support at 1.3070-40 now and may trade sideways between 1.3040-3300 for some days. The Aussie (0.7678)is finding some Support in the 0.7630-20 region. Below this, there is a jumble of Supports down to 0.7520-00. Expect messy trade between 0.77-76 for a couple of days. The earlier anticipated fall towards 0.7520 might not be easy.
Dollar-Yuan (6.6438) seems to be on a slow rise towards 6.67. Dollar-Rupee (65.045) might be quiet between 64.90-65.20 for a couple of days, deciding the future course of action.
INTEREST RATES
US FOMC on Wednesday. Will the Fed surprise with an earlier than expected rate hike? By the presence of immediate Resistances at 3.00% on the 30Yr (2.94%), at 2.50% on the 10Yr (2.43%) and near 2.20% on the 5Yr (2.04%), it might seem that they will not try to surprise the market.
The US Yield Curve (30-10 Spread 0.51% and 30-5 Spread 0.90%) could flatten a bit again, with the Near end moving up a little more than the Middle and Far end sections.
A rate hike, if it happens on Wednesday, can lead to volatility because it is not expected.