Sample Category Title
EUR/GBP Trading Mixed
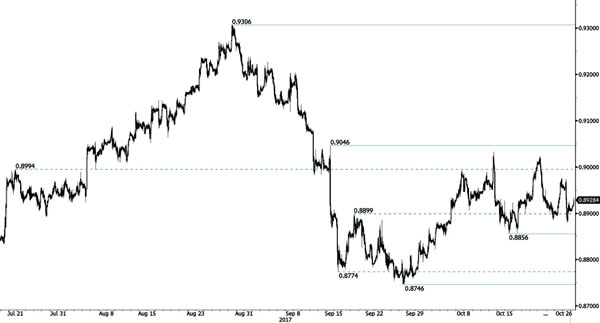
EUR/GBP is showing increasing short-term buying interest near the weak support at 0.8899 (19/09/2017 low). However, as long as prices are below the resistance at 0.9046 (05/09/2017 high), the short-term technical structure is biased to the downside Hourly support is given at a distance at 0.8746 (27/09/2017 low).
In the long-term, the pair has largely recovered from recent lows in 2015. The technical structure suggests a growing upside momentum. The pair is trading above from its 200 DMA. Strong resistance can be found at 0.9500 (psychological level).
AUD/USD Pausing Above 0.77
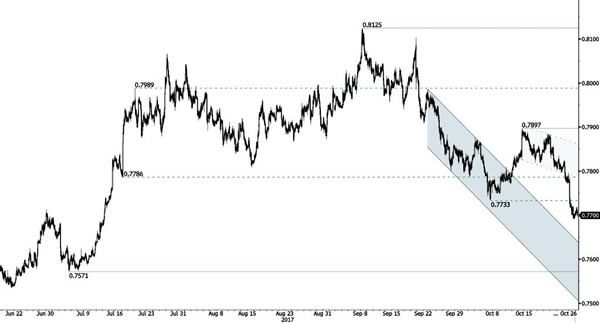
AUD/USD has weakened. Monitor the key support at 0.7571. Hourly resistance is given at 0.7897 (13/10/2017 high). Further support lies at at 0.7733 (06/10/2017 low). Expected to show continued decline.
In the long-term, the trend is turning positive. Key supports stands at 0.6009 (31/10/2008 low) . A break of the key resistance at 0.8164 (14/05/2015 high) is needed to invalidate our long-term bearish view.
EUR/GBP Elliott Wave Analysis
EUR/GBP – 0.8935
Although the single currency retreated again from last week’s high of 0.9023 and further consolidation below indicated resistance at 0.9033 would be seen, as low has been formed at 0.8746 late last month, reckon downside would be limited to 0.8850-55 and bring another rebound later, above said resistance at 0.9033 would add credence to this view, bring a stronger rebound to 0.9050-60 and possibly 0.9080, having said that, reckon upside would be limited to previous support at 0.9115-20 and price should falter well below resistance at 0.9203, bring another decline later this month.
Our latest preferred count is that the wave V of a 5-wave series from 0.5682 ended at 0.9805 earlier and major from there has possibly ended at 0.8067 as A-B-C-X-A-B-C. We are keeping our view that the entire correction from 0.9805 has possibly ended at 0.7756 and as labeled as the attached daily chart and impulsive move from 0.9084 has ended at 0.6938 as a 5-waver which marked as the (C) wave, recent impulsive rise is labeled as (I) (II), (i) (ii) series, indicated upside target at 0.9084 had been met, the retreat from 0.9576 suggest wave iii ended there and next upside target for wave v of (III) should head towards 0.9700 but price should falter well below parity .
On the downside, expect downside to be limited to 0.8880 and 0.8850-55 should hold, bring another rebound later. Below 0.8800-05 would suggest the rebound from 0.8746 has ended instead, bring weakness to 0.8770-75, break there would confirm and bring retest of 0.8746, once this support is penetrated, this would signal the decline from 0.9307 top has resumed for correction of early uptrend to 0.8690-95 (61.8% Fibonacci retracement of 0.8312-0.9307) and possibly towards previous support at 0.8652.
Recommendation: Hold long entered at 0.8880 for 0.9080 with stop below 0.8780

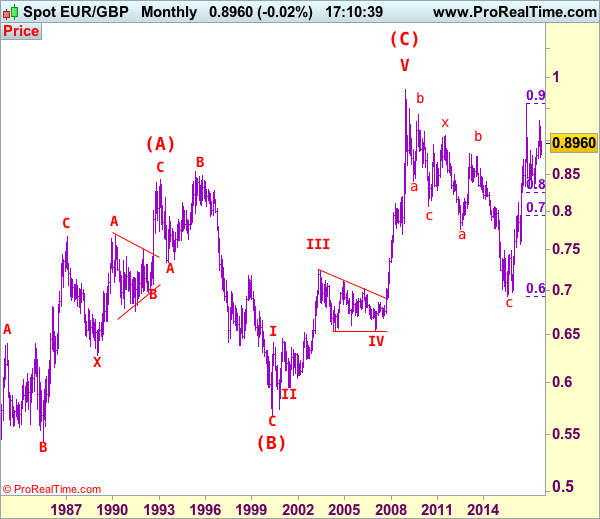
Euro's long term uptrend started in Feb 1981 at 0.5039 and is unfolding as a (A)-(B)-(C) move with (A): 0.8433 (Feb 1993), (B): 0.5682 (May 2000) and impulsive wave (C) should have ended at 0.9805 with wave III ended at 0.7254 (May 2003), triangle wave IV at 0.6536 (23 Jan 2007) and wave V as well as wave (C) has ended at 0.9805.
We are keeping an alternate count that only wave III ended at 0.9805 and the correction from there is the wave IV and has possibly ended at 0.6936, however, it is necessary to see a daily close above resistance at 0.9576 in order to change this to be the preferred count.
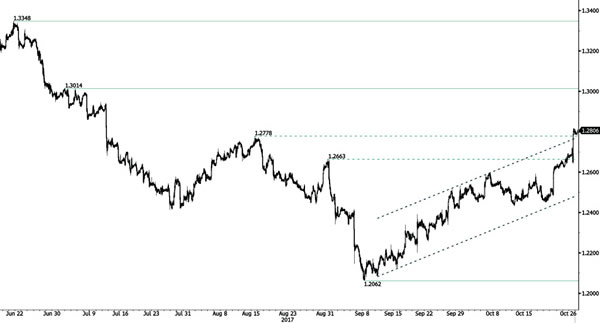
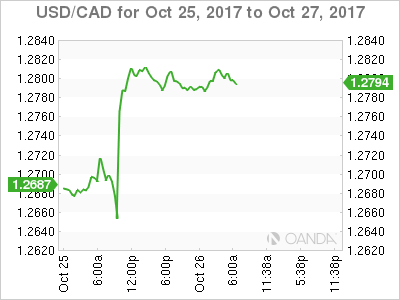
USD/CAD Surging
USD/CAD has broken resistance at 1.2778 (15/08/2017 high). This suggests an extension of bullish momentum. Hourly support lies at 1.2331 (26/09/2017 high). Expected to show continued short-term bullish pressures within uptrend channel.
In the longer term, the pair has broken longterm support that can be found at 1.2461 (16/03/2015 low). Strong resistance is given at 1.4690 (22/01/2016 high). The pair is likely to head further lower.
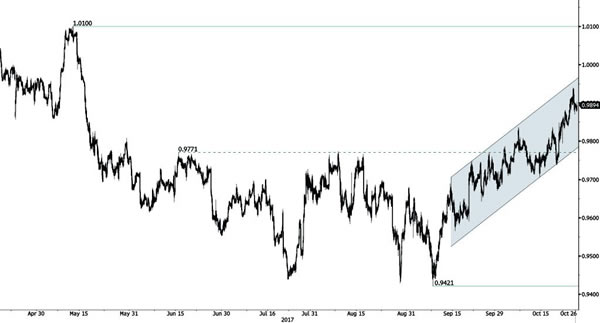
USD/CHF Strong Bullish Trend
USD/CHF is seeing a slight pause of bullish momentum. The technical structure suggests an improving short-term buying interest. Expected to show continued bullish pressures within uptrend channel. Hourly support stands at 0.9712 (12/10/2017 low).
In the long-term, the pair is still trading in range since 2011 despite some turmoil when the SNB unpegged the CHF. Key support can be found 0.8986 (30/01/2015 low). The technical structure favours nonetheless a long term bullish bias since the unpeg in January 2015.
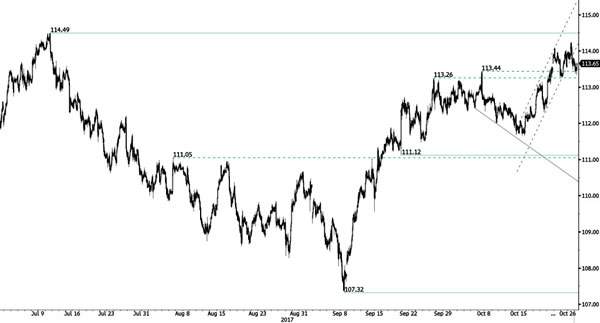
USD/JPY Sideways Price Action
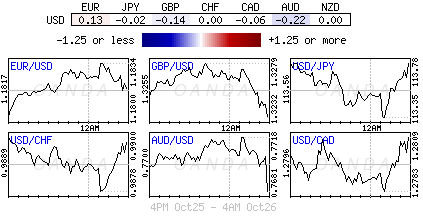
USD/JPY has bounced back lower after reaching after setting a new hourly resistance at 114.24 (25/10/2017 high). Next key resistance can be found at 114.49 (11/07/2017 high). Support is located at 111.12 (20/09/2017 low).
We favor a long-term bearish bias. Support is now given at 99.02 (10/08/2013 low). A gradual rise towards the major resistance at 125.86 (05/06/2015 high) seems unlikely. Expected to decline further support at 93.79 (13/06/2013 low).
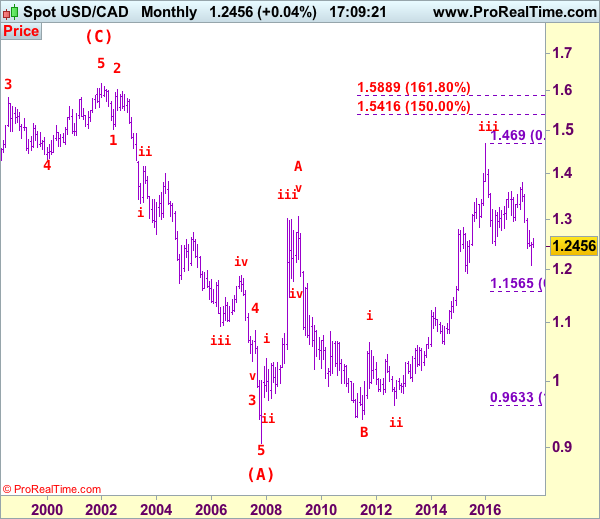
USD/CAD Elliott Wave Analysis
USD/CAD – 1.2797
The greenback has surged after finding good support at 1.2450 last week, adding credence to our bullish view that low has been formed at 1.2061 and mild upside bias remains for this rise to bring retracement of recent decline, hence further gain to 1.2925-30 (50% Fibonacci retracement of 1.3794-1.2061), then towards psychological resistance at 1.3000, however, reckon upside would be limited to 1.3090-00 and price should falter below 1.3130-35 (61.8% Fibonacci retracement), bring retreat later.
We are keeping our view that the wave b from 1.0657 (a leg top) has possibly ended at 0.9633 with (a): 0.9800, wave (b): 1.0447 and wave c at 0.9633, the subsequent rise from there is now treated as wave c exceeded indicated upside target at 1.3770-80 and 1.4000 and wave (3) has possibly ended at 1.4690 and wave (4) correction has commenced for retracement back towards 1.2000.
On the daily chart, our latest preferred count remains that the A of (B) rally from 0.9059 low (7 Nov 2007) unfolded into an impulsive wave with i: 0.9059-1.0380, ii ended at 0.9819, iii at 1.3019 followed by triangle wave iv at 1.2026 , then wave v formed a top at 1.3066 and also ended the wave A. The wave B is unfolding as an double three a-b-c-x-a-b-c and is sub-divided as a: 1.2192, b: 1.2716 and wave c at 1.0784, followed by wave x at 1.1725, another set of a-b-c unfolded with 2nd a at 0.9931, 2nd b at 1.0674. the 2nd c has possibly ended at 0.9407, therefore, consolidation with upside bias is seen for major correction, indicated target at 1.3900 had been met and gain to 1.4700 would follow.
On the downside, whilst initial pullback to 1.2695-00 cannot be ruled out, reckon downside would be limited to 1.2635-40 and previous resistance at 1.2599 (now support) should contain downside and bring another rise later. A daily close below this level would suggest top is possibly formed, bring weakness to 1.2540-50 and possibly 1.2500 but said last week’s low at 1.2450 should remain intact, bring another rise later.
Recommendation: Buy at 1.2610 for 1.2850 with stop below 1.2510.

Longer term - The selloff from 1.6194 (21 Jan 2002) to 0.9059 (07 Nov 2007) is viewed as (A) wave which is a 5-waver as labeled on the monthly chart as below, the subsequently rally is labeled as (B) with impulsive A leg of (B) ended at 1.3066, wave B of (B) is unfolding which has either ended at 0.9407 or would extend one more fall but downside should be limited to 0.9200 and 0.9000 should hold.
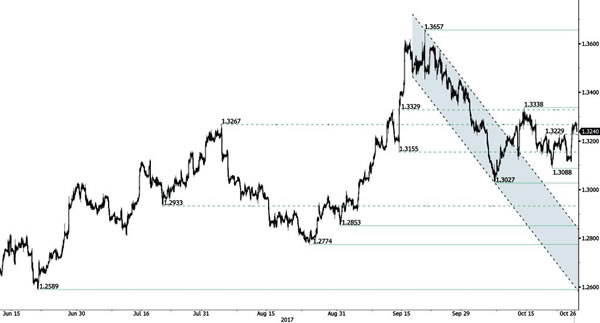
GBP/USD Consolidating
GBP/USD has successfully tested resistance at (1.3229 reaction high) bouncing towards 1.3027 support. Key resistance stands at 1.3229 then 1.3338 (13/10/2017 high). Key support can be found at (1.3088 12/10/2017 low).
The long-term technical pattern is reversing. The Brexit vote had paved the way for further decline. Long-term support can be found at 1.1841 (07/10/2017 low). Long-term resistance given around 1.35 is at stake and indicates a long-term reversal in the negative trend. Yet, it is very unlikely at the moment.
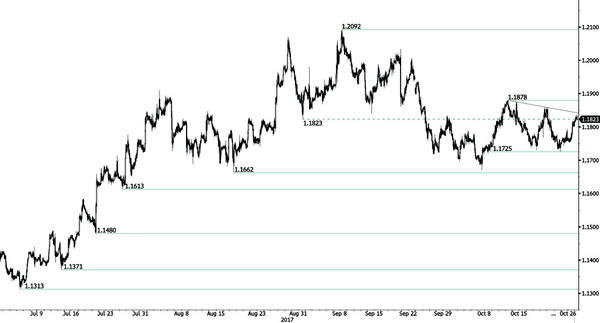
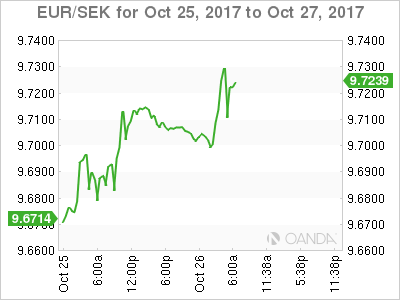
EUR/USD Monitoring Declining Trendline
EUR/USD remains safety above hourly support at 1.1725 (23/10/20107 low). Break will trigger bearish extension to strong support given at a distance at 1.1662 (17/08/2017 low). Key resistance is located at 1.1878 (12/10/2017 high). Expected to show renewed short-term weakness.
In the longer term, the momentum is now turning largely positive. We favour a continued bullish bias. Key resistance is holding at 1.2252 (25/12/2014 high) while strong support lies at 1.0341 (03/01/2017 low).
ECB Decision: ‘Lower For Longer’ Or ‘Higher For Shorter’?
Thursday October 26: Five things the markets are talking about
What to Expect from the ECB
The EUR is expected to be better bid on any signal that the European Central Bank (ECB) is likely to cut asset purchases 'further and faster' than the market expects.
Nevertheless, the chance of a 'hawkish' surprise are low given the market now fully expects the ECB to announce plans to reduce bond purchases at today's meeting.
The speed of the reduction should depend on the development of economic growth, the inflation rate and inflation expectations. The current €60B per month program ends in December, but most expect a reduction of purchases to last at least six months and perhaps longer.
With forward guidance ruling out any rate hike any time soon, the focus is going to be on the extent to which QE asset purchases will be tapered and the deadline.
There are a number of possible outcomes.
1. A sizeable reduction in asset purchases from the current €60B p.m. to perhaps €20B p.m. over an extended period of time.
2. Or a smaller reduction to perhaps €40B p.m. over a shortened period.
Either option would increase QE, however, the ECB would probably view option one, slower taper, the preferred choice as preferable because of sluggish inflation.
1. Stocks mixed results
In Japan, the Nikkei share average edged up overnight, lifted by shares backed by strong earnings. The Nikkei ended +0.2% higher, while the broader Topix rallied +0.1%.
In Hong Kong, equities tracked Wall Street lower ahead of today's ECB meeting. Both the Hang Seng index and the China Enterprises Index lost -0.4% respectively.
Note: China's Communist Party's Congress, which concluded on Tuesday, has offered investors few surprises in terms of economic policies.
In China, blue-chip indexes powered to a fresh 28-month high overnight, supported by stellar earnings reports and as investors expect Beijing to push forward 'Belt and Road' projects. The blue-chip CSI300 index rose +0.4%, while the Shanghai Composite Index added +0.3%.
In Europe, regional indices trade mostly higher ahead of the ECB rate meeting. Mixed earnings have capped the DAX's move – Germanys Bayer is down -3%, while the U.K Barclays bank is impeding FTSE progress.
U.S stocks are set to open in the red (-0.1%).
Indices: Stoxx600 flat at 387.20, FTSE +0.3% at 7465, DAX +0.1% at 12973, CAC-40 +0.2% at 5385, IBEX-35 -0.2% at 10137, FTSE MIB +0.1% at 22476, SMI +0.4% at 9117, S&P 500 Futures -0.1%
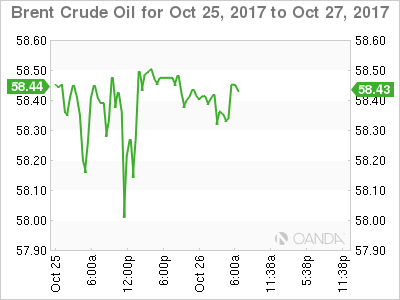
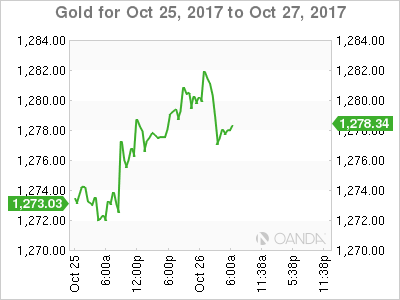
2. Oil prices inch lower on increases in U.S crude inventories, gold higher
Oil prices are a tad lower overnight, pressured by an unexpected increase in U.S crude inventories and as oil output and exports from the U.S rose last week.
Brent crude for December delivery is down -8c at +$58.36 a barrel, while U.S West Texas Intermediate (WTI) crude is down -14c at +$52.04.
EIA data yesterday showed that U.S crude inventories rose by +856k barrels last week. The market had expected a drawdown of -2.6m barrels.
Also providing pressure is the increase in U.S production. Data this week showed that there is a +1.1m bpd rebound in U.S crude production to +9.5m bpd after the falloff due to Hurricane Nate.
Ahead of the U.S open, gold prices are a tad better bid amid a weaker U.S dollar, with the market expecting the ECB to taper monetary stimulus later this morning. Spot gold is up +0.3% at +$1,280.42 an ounce.
3. Sovereign yields back up
U.S bonds yield continue to edge higher as investors anticipate tighter monetary policies. The yield on the U.S 10-year note has backed up above +2.44%, the highest yield in seven-months, and any signs from the ECB this morning that they will be reducing QE should support higher Euro debt yields. Germany's 10-year Bund yield advanced less than +1 bps to +0.48%, the highest in three months.
The market is also pricing in a good chance that President Trump could nominate a replacement for Ms. Yellen who would quicken the pace of interest-rate increases.
Earlier this morning, Sweden's Riksbank left their repo rate unchanged at -0.50% as expected. The central bank will maintain its Repo Rate path and current QE bond-buying program, as monetary policy is needed to remain 'expansionary' for inflation to continue to be close to +2% target.
Norway's central bank (Norges) has also left its deposit rate unchanged (+0.5%), as expected. The decision was unanimous and the balance of risks unchanged from last meeting (Sept). Improvement in the labor market appears to be continuing and the SEK currency remains weaker than projected.
Note: Turkey's central bank holds its MPC meeting at 06:00 EDT, where all policy rates are expected to be left unchanged.
4. Dollar takes a back seat ahead of ECB
The EUR (€1.1807) has backed off from its six-day high (€1.1838) set earlier this morning, as investors await the ECB announcement at 07:45 EDT, followed by ECB President Draghi's press conference at 08:30 EDT. The ECB is expected to deliver their plans to scale back monetary easing. The impact on the 'single' unit is expected to be limited, unless the ECB hints at the expected timing of interest rates rising, which is not expected. On the other hand, surprisingly cautious comments by Draghi could see the EUR retrace most of yesterday's gains.
The CAD (C$1.2800) has fallen to a ten-week low outright after the Bank of Canada took a 'cautious' approach on future rate decisions, despite keeping the +1% rate on hold. Governor Poloz yesterday said that the loonie's strength has delayed the prospect of CPI rising to +2% until H2 of 2018. The BoC expects growth to average around +3.5% between 2017 and 2019, but added 'this outlook remains subject to substantial uncertainty about geopolitical developments and fiscal and trade policies.'
With Fed Dec rate hike odds just below +100%, monetary policy divergence should continue to support USD/CAD.
5. German consumers upbeat on economy, but fret over inflation
GfK's monthly survey this morning indicates that German consumer sentiment will weaken in November – it gives a reading of 10.7 points for the coming month, compared with 10.8 points in October.
Digging deeper, the German consumer expects that the domestic economy will continue to grow, which in turn gives them safety in jobs and planning. However, Germans remain wary of inflation as the most recent data from September showed the headline rate at +1.8%.