Sample Category Title
NZDUSD Maintains Bearish Bias, Downtrend Expected To Resume
NZDUSD maintains a bearish bias since declining steadily from the September 20 peak of 0.7434. Downside pressure in the market increased after the bearish crossover of the 20 and 50-period moving averages on the 4-hour chart.
The recent sharp decline has shown signs of exhaustion, with RSI at oversold levels, as the market pauses just above 0.6860. This level will act as immediate support and a break below it would open the way towards 0.6817 (May 11 low) before proceeding to 0.6674 (May 30 low).
NZDUSD needs to rise back above key resistance at 0.7200 in order to ease downside pressure. Gains through this key level would see prices move towards 0.7343 resistance and then a re-test of 0.7434. From here, the market would be on track for a rise towards the multi-year peak of 0.7557.
On the 4-hour chart, risk is clearly tilted to the downside, with the downtrend still in progress. Only a move back into the 0.7200 handle would indicate the downtrend has ended.
Technical Outlook: AUDUSD – Bears Probe Below 200SMA On Fresh Extension On Thursday
The Aussie remains in red for the fifth straight day and posted new 15-week low at 0.7677 on Thursday, driven further down by dovish comments from RBA deputy governor Debelle.
The pair fell sharply on Wednesday, down nearly 1% for the day after softer than expected Australian inflation data.
Fresh bearish extension on Thursday probed below 200SMA (0.7692) which contained Wednesday's fall, signaling further downside on sustained break lower.
Bears eyes initial target at 0.7670 (Fibo 138.2% projection of the downleg from 0.7897) and could extend towards key double-Fibonacci support at 0.7630 (Fibo 61.8% of 0.7328/0.8124 / Fibo 38.2% of 0.6825/0.8124).
Meanwhile, consolidation above 200SMA could be anticipated as slow stochastic is strongly oversold on daily chart. Falling daily Tenkan-sen (currently at 0.7783) is expected to cap extended upticks.
Res: 0.7718, 0.7732, 0.7783, 0.7808
Sup: 0.7692, 0.7670, 0.7630, 0.7600
Elliott Wave Analysis: Intra-Day Updates
EURUSD is picking up from the lows, away from the 1.1730 zone, where a potential three-wave corrective move had ended. Current rally can so be an indication that a new bullish continuation is underway. As such we see a five-wave recovery in action, that will in sessions ahead take price above the 1.1870 region. However, if price starts to trade below the former swing low at 1.1752 levelm, then current count will be invalidated.
Some elliott wave tips, when looking at a chart like this one: Here we see price nicely trading higher. If price tends to unfold a five-wave rally, that this can suggest a change in trend is underway. In our case, we expect more gains to follow on EURUSD.
EURUSD, 1H

Now let's look at the S&P500!
S&P500 is also displaying a bullish development, away from the 2543 level, where a three-wave corrective move had ended. We labeled current impulse up as wave 1, and the following minor correction that may follow as wave 2. A later breach above the 2568 level will indicate a completed wave 2 and wave 3 to be in progress.
S&P500, 1H

Daily Technical Analysis: EURUSD, GBPUSD, USDJPY, USDCHF
EURUSD
The EURUSD had a bullish momentum yesterday topped at 1.1817. The bias is bullish in nearest term testing the upper line of the bearish channel as you can see on my H1 chart below, located around 1.1840/50 area. A clear break above that area would expose 1.1900 key resistance. Immediate support is seen around 1.1785. A clear break below that area could lead price to neutral zone in nearest term testing 1.1725 but key support remains at 1.1670 region. The major bullish trend remains valid but need a clear break at least above 1.1900 to resume the bullish scenario targeting 1.2000 – 1.2090 area.
GBPUSD
The GBPUSD failed to continue its bearish momentum yesterday topped at 1.3271. The bias is bullish in nearest term testing 1.3330 key resistance. A clear break and daily close above that area would reactivate my bullish mode targeting 1.3615 region. Immediate support is seen around 1.3210. A clear break below that area could lead price to neutral zone in nearest term testing 1.3150 region but key support remains at the daily EMA 200 and the trend line support located around 1.3000 region.
USDJPY
The USDJPY was indecisive yesterday. The bias is neutral in nearest term probably with a little bullish bias testing 114.50 key resistance area which remains a good place to sell with a tight stop loss. Immediate support is seen around 113.20. A clear break below that area could trigger further bearish pressure testing 112.75/25 region. On the upside, a clear break above 114.50 would expose 115.50 or higher. Overall I remain neutral.
USDCHF
The USDCHF was indecisive yesterday. The bias is neutral in nearest term. Immediate resistance is seen around 0.9910. A clear break above that area could trigger further bullish pressure testing 0.9950 or higher. Immediate support is seen around 0.9868 (yesterday’s low). A clear break below that area could trigger further bearish pressure testing 0.9836 area. Overall I am neutral on this pair.
Technical Outlook: USDJPY Lacks A Catalyst For Eventual Clear Break Above 114.00
USDJPY The pair dipped to 113.33 in early Thursday's trading after Wednesday's rally hit new over three-month high at 114.23 but the day ended in red after quick pullback, signaling repeated upside rejection.
Bulls stalled just ahead of 114.33 barrier (Fibo 61.8% of 118.66/107.31 fall), signaling further consolidation before final break higher.
Overall bullish structure seems to lack catalyst for sustained break above 114.00 which would signal continuation of larger uptrend through 114.33 Fibo barrier and former tops at 114.36/49 (07 May / 09 July respectively).
Dips were so far contained above 113.24 higher base (23/24 Oct lows) which is seen as ideal support, however, extension towards 112.99/80 (rising 10/20SMA's) cannot be ruled out.
Only firm break below the latter supports would sideline bulls and signal correction.
Slow stochastic is hovering around overbought zone boundary and supports scenario of stronger correction.
The greenback eyes today's release of US weekly jobless claims and pending home sales for fresh signals, with upbeat results expected to lift the dollar
Res: 113.80, 114.09, 114.23, 114.33
Sup: 113.33, 113.24, 112.80, 112.52
EUR/GBP Candlesticks and Ichimoku Analysis
Weekly
• Last Candlesticks pattern: N/A
• ime of formation: N/A
• Trend bias: Near term up
Daily
• Last Candlesticks pattern: Shooting star
• Time of formation: 29 Aug 2017
• Trend bias: Down
EURGBP – 0.8954
Despite last week’s choppy trading, the single currency has remained confined within recent established range, suggesting further consolidation would be seen and recovery to 0.8975-80, then 0.9000 is likely, however, reckon indicated resistance at 0.9033 would hold from here, bring further sideways trading. Only a break of said resistance at 0.9033 would suggest a temporary low has been formed at 0.8746, bring a stronger rebound to 0.9050-60 but reckon upside would be limited to 0.9110-15 and as top has been formed at 0.9307, price should falter below 0.9203, bring another leg of corrective decline later.
On the downside, below 0.8880 (this week’s low) would bring test of previous support at 0.8856 but break there is needed to revive bearishness and suggest the rebound from 0.8746 low has ended and bring further fall to 0.8800, break there would bring retest of 0.8746. Looking ahead, only a drop below 0.8746 would signal early fall from 0.9307 top has resumed and extend weakness towards 0.8690-95 (61.8% Fibonacci retracement of 0.8312-0.9307) but previous support at 0.8652 would hold.
Recommendation: Stand aside for this week.

On the weekly chart, the single currency has remained locked within near term established range and further consolidation below the Tenkan-Sen would be seen. Only a break of indicated resistance at 0.9033 would suggest the retreat from 0.9307 has possibly ended, bring recovery to 0.9060-70, however, if our view that top has been formed at 0.9307 is correct, upside would be limited to 0.9120-25 and price should falter well below 0.9203, bring another leg of decline in later part of Q4.
On the downside, below support at 0.8856 would suggest the recovery from 0.8746 has ended and bring another test of this level, break there would add credence to our view that top has been formed at 0.9307 and signal another leg of decline from this top is underway for retracement of early upmove to 0.8690-95 (61.8% Fibonacci retracement of 0.8312-0.9307) and possibly support at 0.8562 but reckon downside would be limited to the lower Kumo (now at 0.8571) and previous resistance at 0.8531 should turn into support and contain euro’s downside.

EUR/CHF Candlesticks and Ichimoku Analysis
Weekly
• Last Candlesticks pattern: Long white candlestick
• Time of formation: 24 Jul 2017
• Trend bias: Up
Daily
• Last Candlesticks pattern: Morning doji
• Time of formation: 25 Jul 2017
• Trend bias: Up
EUR/CHF – 1.1695
As the single currency has surged again after finding support again around the Tenkan-Sen, the breach of previous resistance at 1.1624 adds credence to our view that recent upmove has resumed and upside bias remains for medium term upmove to extend further gain to 1.1770-80, then 1.1800-10, however, loss of upward momentum should prevent sharp move beyond 1.1850-60 and reckon 1.1900 would hold from here, risk from there is seen for a retreat to take place later.
On the downside, whilst pullback to 1.1650 is likely, reckon the Tenkan-Sen (now at 1.1596) would limit downside and bring another rise later. A daily close below the Kijun-Sen (now at 1.1547) would defer and suggest a temporary top is possibly formed instead, bring weakness to 1.1520-25 but only break of 1.1485 support would confirm and bring retracement of recent rise to 1.14225-30, then towards support at 1.1388 which is likely to hold form here.
Recommendation: Buy at 1.1600 for 1.1800 with stop below 1.1500.

On the weekly chart, the single currency finally penetrated resistance at 1.1624, confirming medium term upmove from 0.8426 low has resumed and bullishness is seen for further gain to 1.1760-70, then 1.1800-10 but overbought condition should prevent sharp move beyond 1.1840-50 and reckon 1.1900-10 would hold, price should falter well below 1.2000, risk from there has increased for a retreat to take place later.
On the downside, whilst pullback to 1.1600-10 cannot be ruled out, reckon 1.1570 would contain downside and bring another rise later. A weekly close below the Tenkan-Sen (now at 1.1526) would suggest top is possibly formed, break of support at 1.1485 would add credence to this view, bring retracement of recent rise to 1.1388, below there would provide confirmation, then further fall to 1.1345 support would follow. Looking ahead, once this level is penetrated, this would turn outlook bearish for further subsequent decline to 1.1300, then towards another previous support at 1.1259.

Technical Outlook: GBPUSD – Bulls Look For Break Above Daily Cloud, ECB’s Verdict Could Influence Pound Too
Cable is consolidating within widening daily cloud following strong rally on Wednesday (the biggest one-day rally since 15 Sep) which cracked cloud top but failed close above it. Technical studies are turning into bullish setup with fresh bullish sentiment, boosted by strong UK GDP data yesterday, keeping near-term focus at the upside. Break above cloud top (1.3294) will be strong bullish signal for acceleration above 1.33 and test of next strong barrier at 1.3337(13 Oct high). Daily cloud base (1.3214), reinforced by converged 10/20SMA's, offers solid support which is expected to hold dips. Cable is eyeing the outcome of ECB's meeting and could follow the Euro after central bank's releases its decision about QE program.
Res: 1.3278, 1.3294, 1.3311, 1.3337
Sup: 1.3229, 1.3214, 1.3182, 1.3159
Technical Outlook: EURUSD Remains Firm Ahead Of ECB
The Euro maintains firm tone on Thursday ahead of ECB. Near-term price action is holding in the middle of thick daily cloud and constructive above 10/20SMA's which were taken out on Wednesday's strong rally. Long bullish candle of the previous day underpins for further upside as fresh bullish acceleration today approached 55SMA target at 1.1841. Daily techs are gaining bullish momentum for fresh extension towards barriers at 1.1858 (19/20 Oct double-top) and 1.1879 (12 Oct high). Supports at 1.1794 (broken 10SMA) and 1.1783 (broken 20SMA) should keep the downside protected. ECB is widely expected to keep interest rates unchanged on today's meeting, with markets focusing on central bank's plan for tapering its asset purchase program. Traders are looking for more details to be announced on ECB President Mario Draghi press conference (12:30 GMT). Markets expect the ECB to trim its monthly asset purchase from current 60 billion Euros per month to 40 billion, with question whether the program would last six or nine months after it starts. Market observers speculate about two scenarios for extension of the plan. The first one sees extension six for months with amount of 40 billion Euros and the second one expects extension for nine months with monthly amount of 30 billion Euros. ECB's final decision is expected to be strong market driver. More hawkish approach is expected to further inflate the single currency which is already boosted by weaker dollar, for acceleration towards upper breakpoint, provided by daily Ichimoku cloud top at 1.1921. Softer tone from the European Central Bank would put the single currency under pressure, with loss of key handles (10/20SMA's) expected to shift near-term focus lower.
Res: 1.1841, 1.1858, 1.1879, 1.1921
Sup: 1.1809, 1.1794, 1.1783, 1.1752
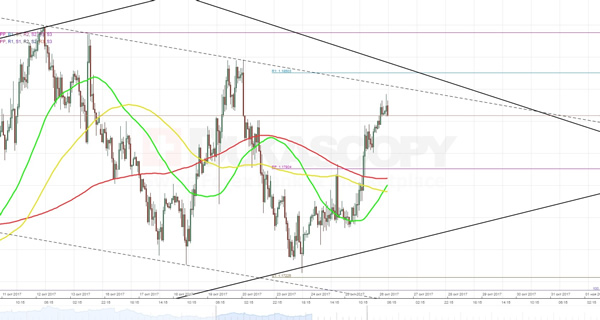
EURUSD Analysis: Anticipates ECB Meeting
Despite a release of better than expected US purchase orders data the currency rate did not manage to bypass the 55-hour SMA and soared in the opposite direction. The main drivers that pushed and are continuing to push the pair to the top are expectations on the upcoming ECB meeting. On the one hand, the currency rate faces two notable resistance levels near 1.1835 and 1.1850. The first one represents an upper trend-line of an alleged descending triangle, while the second one represents an upper boundary of a large descending channel. However, if the central bankers’ meeting produces a decision about cutback of the quantitative easing program the Euro might easily break through these barriers and reach the 1.1900 mark.