Sample Category Title
EUR/AUD Daily Outlook
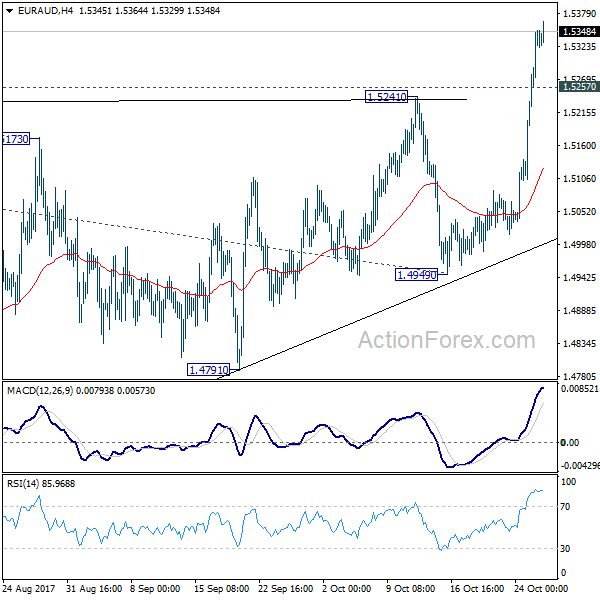
Daily Pivots: (S1) 1.5174; (P) 1.5263; (R1) 1.5420; More....
Intraday bias in EUR/AUD remains on the upside at this point. Medium term rise from 1.3624 should now target 61.8% projection of 1.3624 to 1.5226 from 1.4949 at 1.5939 first. On the downside, below 1.5257 minor support will turn intraday bias neutral for consolidations. But outlook will remain cautiously bullish as long as 1.4949 support holds.
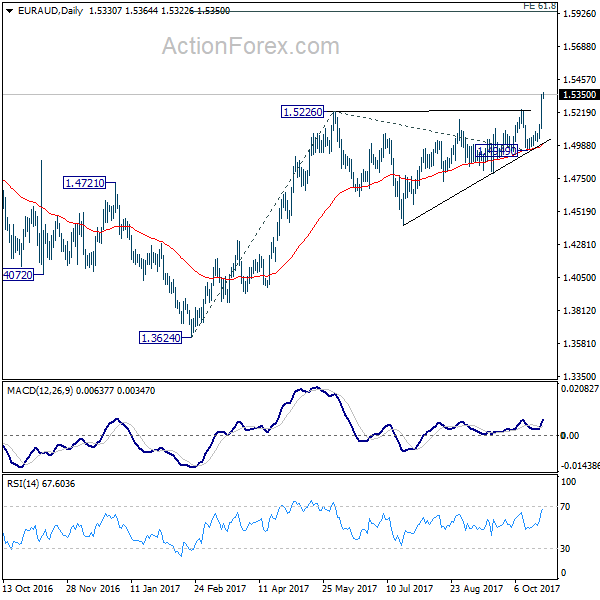
In the bigger picture, we're holding on to the view that corrective decline from 1.6587 medium term top has completed at 1.3624. Rise from 1.3624 is expected to extend to retest 1.6587. The corrective structure of the price actions from 1.5226 is affirming this view. Sustained trading above 1.5226 will target a test on 1.6587 key resistance. However, break of 1.4421 support will dampen our view and would drag EUR/AUD lower to retest key support zone around 1.3624.
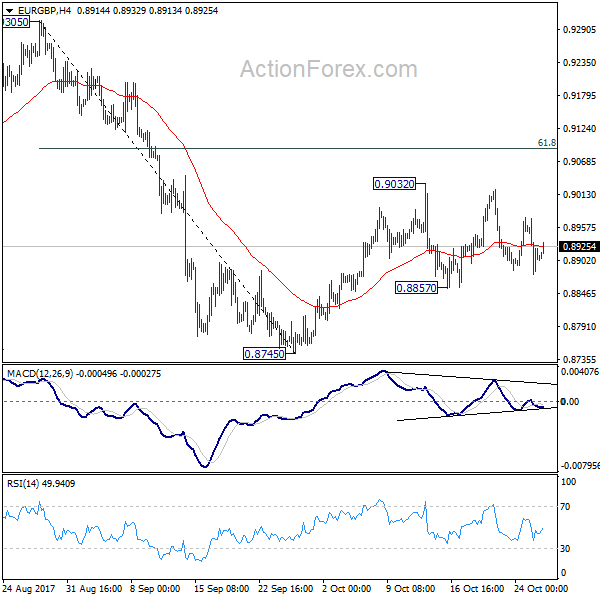
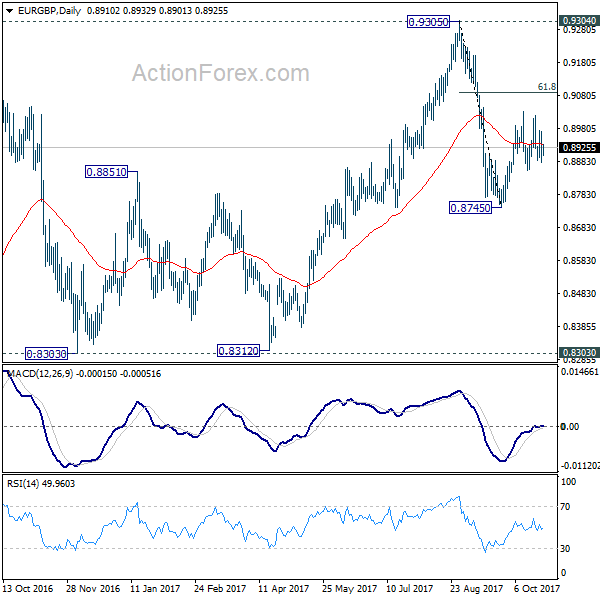
EUR/GBP Daily Outlook
Daily Pivots: (S1) 0.8906; (P) 0.8941; (R1) 0.8988; More...
EUR/GBP is staying in range of 0.8857/9032 and intraday bias remains neutral first. As long as 61.8% retracement of 0.9305 to 0.8745 at 0.9091 holds, deeper fall is in favor. Below 0.8857 minor support will turn bias to the downside. Further break of 0.8745 will resume whole decline form 0.9305 and target 0.8303 key support level. Nonetheless, sustained break of 0.9091 will bring retest of 0.9305 instead.
In the bigger picture, there are various ways to interpret price actions from 0.9304 high. But after all, firm break of 0.9304/5 is needed to confirm up trend resumption. Otherwise, range trading will continue with risk of another fall. And in that case, EUR/GBP could have a retest on 0.8303. But we'd expect strong support from 0.8116 cluster support (50% retracement of 0.6935 to 0.9304 at 0.8120) to contain downside.
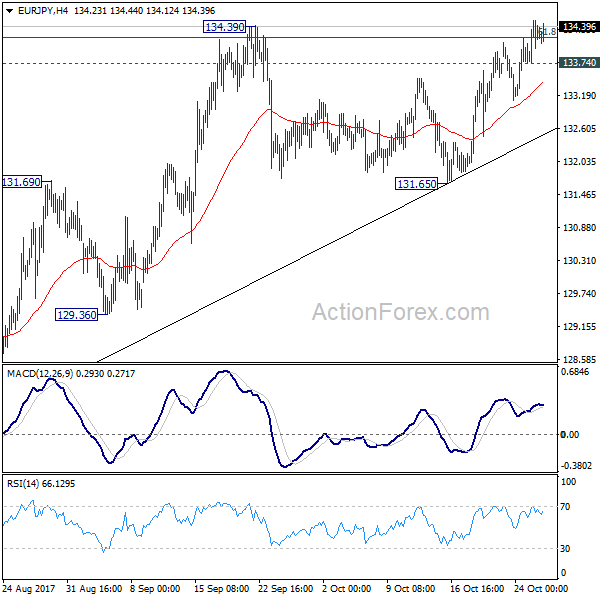
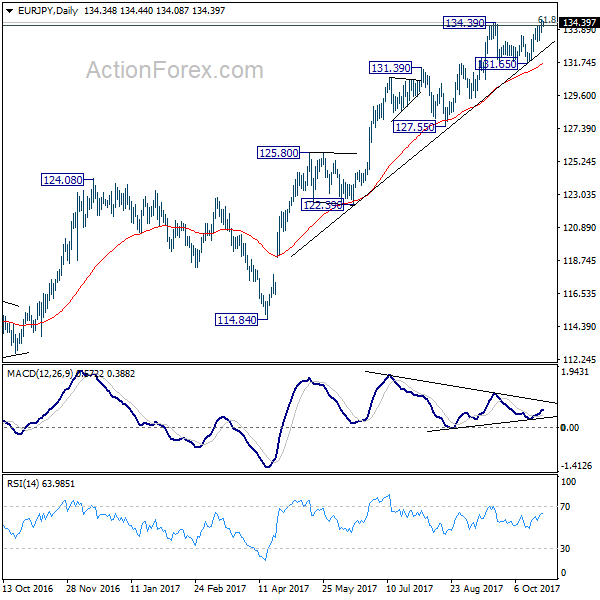
EUR/JPY Daily Outlook
Daily Pivots: (S1) 133.90; (P) 134.20; (R1) 134.64; More...
EUR/JPY's breach of 134.39 resistance argues that medium term rally is resuming. Intraday bias is cautiously on the upside. Sustained trading above 134.39 will confirm and target 141.04 long term resistance. However, break of 133.74 minor support will dampen this view and turn bias back to the downside for 131.65 support instead.
In the bigger picture, medium term rise from 109.03 (2016 low) is seen as at the same degree as the down trend from 149.76 (2014 high) to 109.03 (2016 low). 61.8% retracement of 149.76 to 109.03 at 134.20 is already met. Sustained break there will pave the way to key long term resistance zone at 141.04/149.76. However, break of 127.55 support will argue that the medium term trend has reversed and will turn outlook bearish for deeper fall.
Daily Wave Analysis: EUR/USD Bullish Bounce Faces Resistance Before ECB Rate Decision
Currency pair EUR/USD
The EUR/USD is facing an interest rate decision later today by the European Central Bank (ECB), which could cause strong price movement and volatility. From a wave perspective, price could be finishing a wave 1 (blue) and ready for a retracement back to the Fibonacci levels of wave 2 (blue). These Fib levels could act as support if indeed a larger wave C (purple) of wave X (pink) indeed takes place.

Invalidation for the wave 1-2 (blue) is a break below the 100% Fibonacci level. A break above the resistance trend line could indicate a larger wave 3 (green).

Currency pair GBP/USD
The GBP/USD broke above the resistance (red) trend line could indicate that a larger wave C (orange) is taking place.

The GBP/USD could be in a wave 3 (brown) bullish breakout but needs to break above the resistance (red) before more upside is likely.

Currency pair USD/JPY
The USD/JPY is building a potential wave 4 (blue) within the uptrend. A break above resistance (red) could see price challenging the 114.50-115 target zone.

The USD/JPY bounced at the 38.2% Fibonacci level which was part of a wave 4 correction (blue). A break above resistance (red) could confirm the wave 5 (blue/purple) breakout.

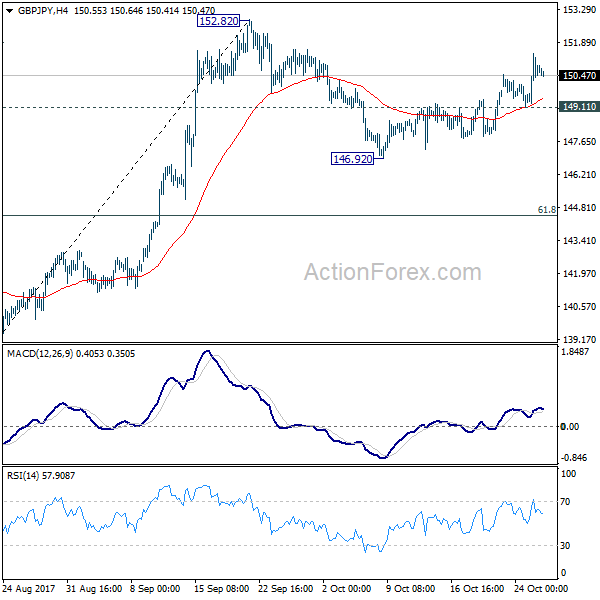
GBP/JPY Daily Outlook
Daily Pivots: (S1) 149.11; (P) 149.60; (R1) 150.06; More
Intraday bias in GBP/JPY remains on the upside as rebound from 146.92 is in progress for 152.82 high. Firm break there will confirm resumption of medium term rise from 122.36 and target 163.87 resistance next. On the downside, break of 149.11 minor support will turn bias to the downside and extend the correction from 152.82. In that case, we'd expect strong support from 61.8% retracement of 139.29 to 152.82 at 144.45 to bring rebound.
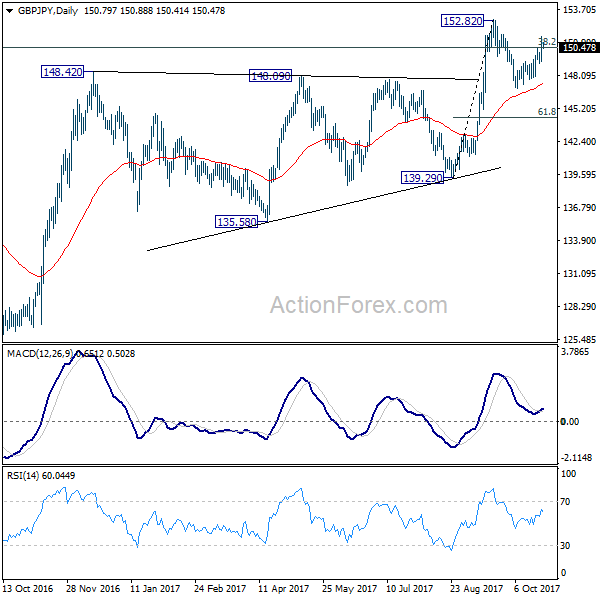
In the bigger picture, medium term rebound from 122.36 is still expected to resume after corrective pull back from 152.82 completes. Firm break of 38.2% retracement of 196.85 to 122.36 at 150.43 will carry long term bullish implications. In that case, GBP/JPY could target 61.8% retracement at 167.78. However, break of 139.29 will indicate rejection from 150.43 key fibonacci level. And the three wave corrective structure of rebound from 122.36 will argue that larger down trend is resuming for a new low below 122.26.
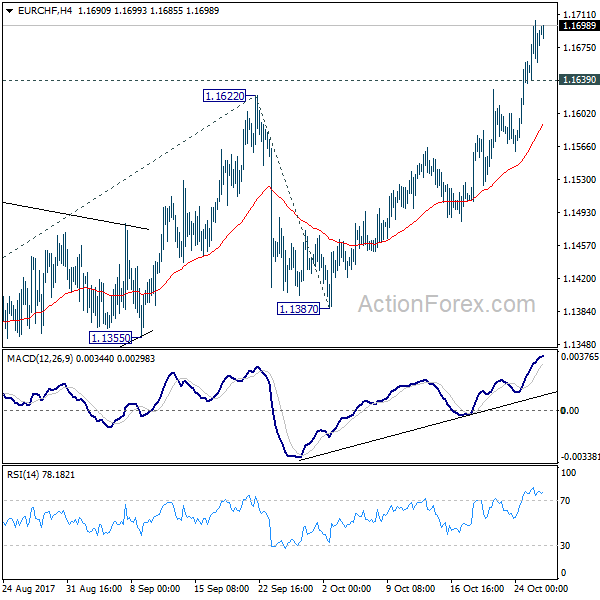
EUR/CHF Daily Outlook
Daily Pivots: (S1) 1.1650; (P) 1.1678; (R1) 1.1716; More...
EUR/CHF's rally is still in progress and intraday bias remains on the upside. Current up trend should target 61.8% projection of 1.0652 to 1.1622 from 1.1387 at 1.1986, which is close to 1.2 key level. On the downside, below 1.1639 minor support will turn bias neutral and bring consolidations. But near term outlook will remain bullish as long as 1.1387 support holds.
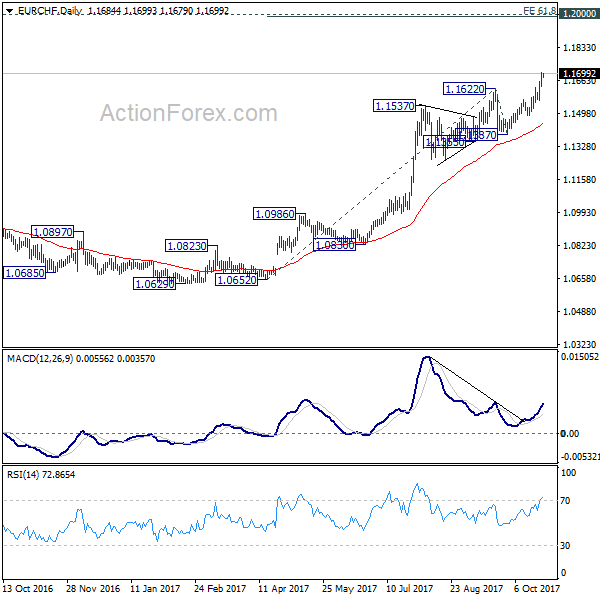
In the bigger picture, long term rise from SNB spike low back in 2015 is still in progress. EUR/CHF should now be heading back to prior SNB imposed floor at 1.2000. For now, this will be the favored case as long as 1.1355 support holds.
US Dollar In Monstrous Uptrend Vs Swiss Franc
Key Highlights
- The US Dollar climbed higher this week and moved above 0.9840 against the Swiss Franc.
- There is a short-term bullish trend line forming with support at 0.9880 on the 4-hours chart of USD/CHF.
- The US New Home Sales in Sep 2017 increased by 18.9% (MoM), better than the forecast of -0.9%.
- Today, the US Pending Home Sales for Sep 2017 will be released, which is forecasted to increase by 0.2% (MoM).
USDCHF Technical Analysis
The US Dollar surged higher during the past few days and moved above the 0.9800 handle against the Swiss Franc. The USD/CHF pair is now placed well in the bullish zone above 0.9840.
The pair recently traded as high as 0.9939 and started correcting lower. It tested the 23.6% Fib retracement level of the last wave from the 0.9736 low to 0.9939 high.
On the downside, there is a short-term bullish trend line forming with support at 0.9880 on the 4-hours chart. However, the most important support is close to 0.9840 and the 50% Fib retracement level of the last wave from the 0.9736 low to 0.9939 high.
The overall trend remains bullish for USD/CHF and dips towards 0.9850-40 are most likely to find buyers in the near term.
US New Home Sales
Recently in the US, the number of New Home Sales for Sep 2017 was released by the US Census Bureau. The forecast was slated for a decline in sales by 0.9% compared with the previous month.
The actual result was better than the forecast, as there was a rise in sales by 18.9% to a seasonally adjusted annual rate of 667,000. However, the last reading was revised down from -3.4% to -3.6%.
Looking at the Housing Price Index in August 2017, there was a rise of 0.7% compared with the previous month, and more than the forecast of +0.4%.
The report stated:
For the nine census divisions, seasonally adjusted monthly price changes from July 2017 to August 2017 ranged from -0.1 percent in the New England division to +1.4 percent in the Pacific division. The 12-month changes were all positive, ranging from +5.0 percent in the Middle Atlantic division to +9.3 percent in the Pacific division.
Overall, the USD/CHF pair has no reason to move down and likely to remain supported above 0.9880-0.9860 in the near term.
Economic Releases to Watch Today
ECB Interest Rate Decision – Forecast 0%, versus 0% previous.
US Initial Jobless Claims – Forecast 253K, versus 222K previous.
US Pending Home Sales for Sep 2017 (MoM) – Forecast +0.2%, versus -2.6% previous.
US Goods Trade Balance Sep 2017 – Forecast $-63.80B, versus $-62.94B previous.
EUR/USD Daily Outlook
Daily Pivots: (S1) 1.1770; (P) 1.1794 (R1) 1.1835; More...
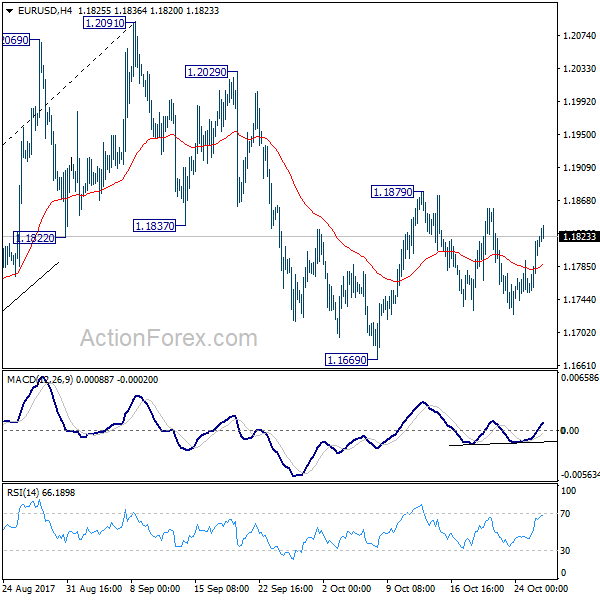
Intraday bias in EUR/USD remains neutral at this point. On the downside, break of 1.1669 will resume the corrective fall from 1.2091 to 38.2% retracement of 1.0569 to 1.2091 at 1.1510. We'd expect strong support from there to complete the correction. On the upside, break of 1.1879 will revive the case that pull back from 1.2091 has already completed at 1.1669. In such case, intraday bias will be turned back to the upside for retesting 1.2091 high.
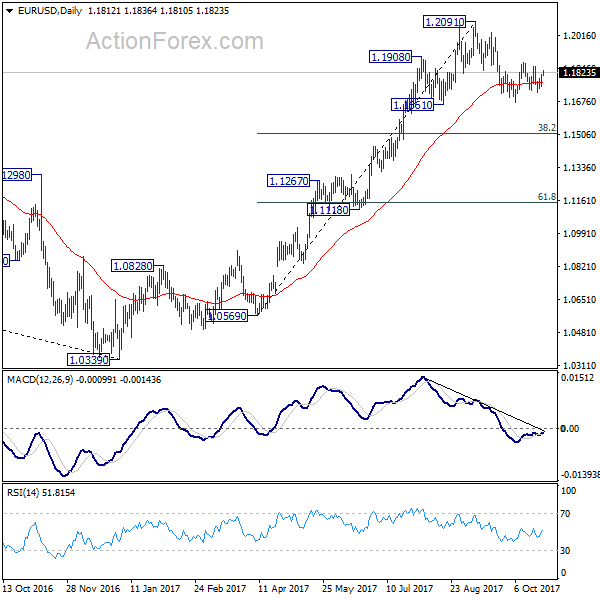
In the bigger picture, rise from medium term bottom at 1.0339 is not finished yet. It's expected to continue after pull back from 1.2091 completes. And, next target will be 38.2% retracement of 1.6039 (2008 high) to 1.0339 (2017 low) at 1.2516. However, it should be noted that there is no confirmation of trend reversal yet. That is, such rebound from 1.0399 could be a correction. And the long term fall from 1.6039 (2008 high) could resume. Hence, we'd be cautious on strong resistance from 1.2516 to limit upside.
Forex: Strong Economic Data From The UK & US
On Wednesday, the UK Office for National Statistics released Gross Domestic Product, that beat expectations, coming in with growth of 0.4% in Q3. Improving by 0.1% on the previous quarter of 0.3%, UK Chancellor Phillip Hammond commented that it showed a “resilient economy which is supporting a record number of people in employment”. The mainstay of the UK, the services sector, which accounts for nearly 80% of economic growth, grew by 0.4% as it did in the previous quarter. Industrial production also grew by 1% during Q3, helped by a 1% jump from manufacturing and a 1.5% increase from mining and quarrying. Despite the growth in GDP, the estimate for annual growth is below the 1.8% last year and is the slowest for 5 years. The better-than-expected data helped push GBP higher against its peers with GBPUSD rising to a near 3-week high.
The US Census Bureau released Durable Goods Orders and ex Transportation data for September on Wednesday that increased more than expected. Durable goods for September climbed to 2.2%, beating expectations of a 1% rise, to $238.7 billion. The bulk of the increase was a result of higher transportation orders which rose by 5.1%. Durable Goods have now increased in 3 out of the last 4 months. The data indicated a favorable manufacturing sector, despite the recent Hurricanes that disrupted employment data. Following the release, the USD saw initial buying interest before retracing lower.
The Bank of Canada held its benchmark interest rate at 1% on Wednesday, but raised concerns about the Canadian economy. Policy makers, led by Governor Stephen Poloz, left the benchmark overnight rate at 1%, after consecutive hikes at the bank's last two decisions in July and September, and warned they will remain “cautious” when considering future hikes. Following the announcement, the markets are now discounting the likelihood of another interest rate hike this year, which caused CAD to weaken by 1%. Many are now expecting a hike in Canadian interest rates by March of next year and not January as many had forecast.
The markets are now focusing on today's ECB Meeting at 12:45 BST.
EURUSD is 0.1 higher in early trading, around 1.1825.
USDJPY is 0.1 lower in early trading, around 113.52.
GBPUSD is little changed, trading around 1.3265.
Gold is 0.2% higher overnight, trading around $1,280.
WTI is 0.2% lower in early trading, around $52.18.
Major data releases for today:
At 08:45 BST, the Reserve Bank of Australia Assistant Governor Guy Debelle is scheduled to speak at the ABS Auditorium, Abercrombie Business School at the University of Sydney.
At 12:45 BST, the European Central Bank will announce its Interest Rate decision. The markets are not expecting any change.
At 13:30 BST, the US Department of Labor will release Initial Jobless Claims for the week ending October 20th, along with Continuing Jobless Claims for the week ending October 13th. Initial claims are expected to have risen to 253K from the previous 222K. Continuing claims are forecast to come in at 1.890M, a slight increase on the previous 1.888M. Any significant deviation from the forecasts are likely to see USD volatility.
At 13:30 BST, following the 12:45 BST ECB interest rate decision there will be the ECB Monetary policy statement and press conference. The markets will be keen to hear news of changes in policy which may affect EUR.
GBP/USD Daily Outlook
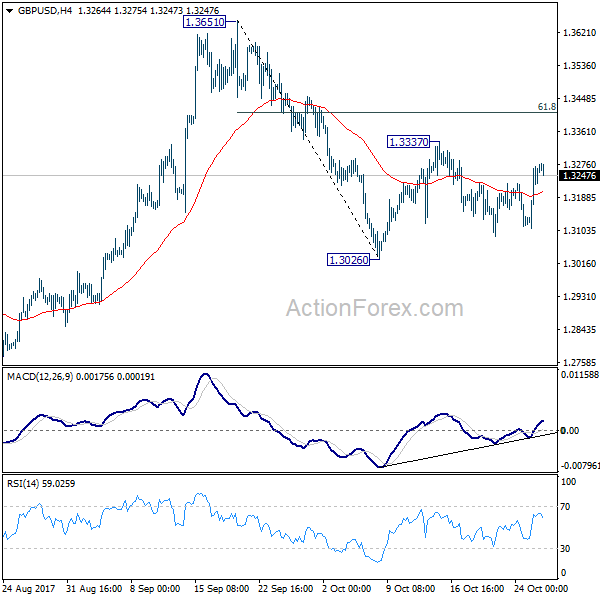
Daily Pivots: (S1) 1.3157; (P) 1.3214; (R1) 1.3319; More....
GBP/USD is still bounded in range of 1.3026/3337 and intraday bias stays neutral at this point. On the downside, break of 1.3026 will resume the decline from 1.3651 and target 1.2773 key support level. This will also revive the case of medium term reversal. Meanwhile, on the upside, break of 1.3337 will resume the rebound from 1.3026 to 61.8% retracement of 1.3651 to 1.3026 at 1.3412 and above.
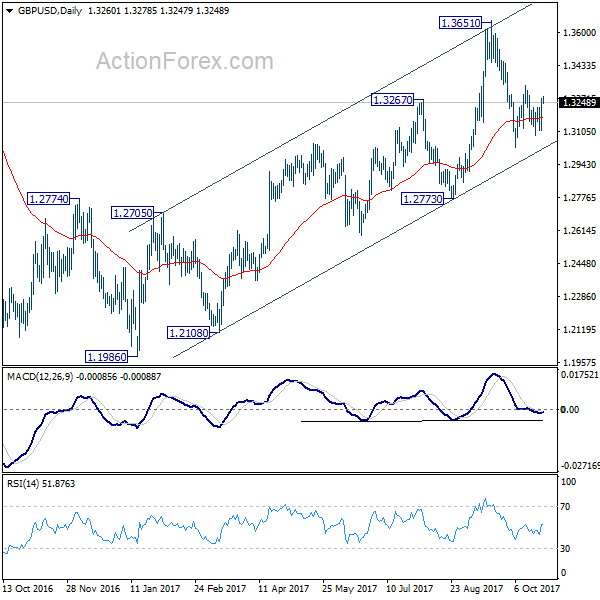
In the bigger picture, while the medium term rebound from 1.1946 was strong, GBP/USD hit strong resistance from the long term falling trend line. Outlook is turned a bit mixed and we'll stay neutral first. On the downside, decisive break of 1.2773 key support will argue that rebound from 1.1946 has completed. The corrective structure of rise from 1.1946 to 1.3651 will in turn suggest that long term down trend is now completed. Break of 1.1946 low should then be seen. On the upside, break of 1.3835 support turned resistance will revive the case of trend reversal and target 38.2% retracement of 2.1161 (2007 high) to 1.1946 (2016 low) at 1.5466.