Sample Category Title
Can. Dollar Lower Ahead of US, Canada Jobs Data
The Canadian dollar is showing limited movement for third consecutive day. In the European session, USD/CAD is trading at 1.4328, up 0.14% on the day.
The week wraps up with January employment reports from both Canada and the US, which could mean USD/CAD will be active in the North American session. Canada and the US are coming off sparkling job growth numbers in December and it will be interesting to see how the market reacts to the January data, which is expected to be much lower.
Employment in Canada climbed 91 thousand in December, a blowout reading which was the largest gain since Jan. 2023. It was the fourth straight monthly increase and that trend is expected to continue, with a market estimate of 25 thousand for January. The unemployment rate is expected to rise to 6.9%, up from 6.7% in December. This would be the highest unemployment rate since Sep. 2021 and would support the case for further rate- cutting from the Bank of Canada.
US nonfarm payrolls expected to drop
The US wraps up the week with nonfarm payrolls, one of the most important economic events. The market estimate stands at 170 thousand for January, after a surprisingly strong gain of 256 thousand in December. If the January forecast is accurate, it would mark a sharp drop that would make headlines, but it would not be far off the past three-month average.
The Federal Reserve is unlikely to show much concern if job creation slows, as long as the labor market is cooling at a slow pace. The Fed is expected to cut rates only once or twice this year, but that could change if inflation or the labor market provide any surprises.
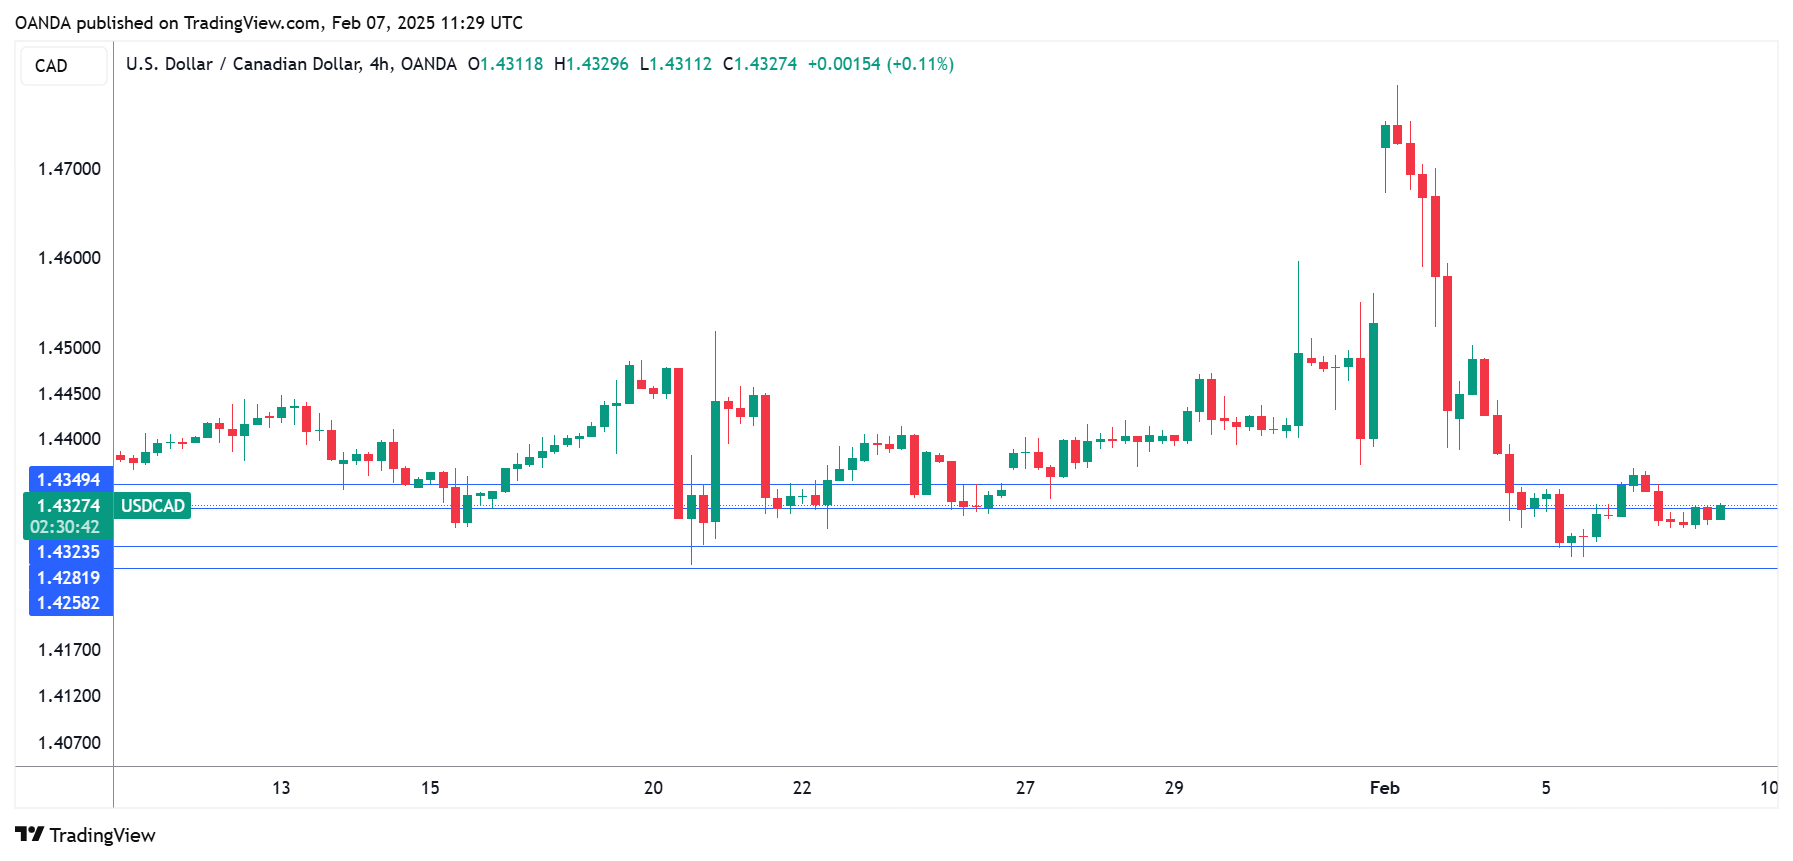
USD/CAD Technical
- USD/CAD is testing resistance at 1.4324. Above, there is resistance at 1.4348
- There is support at 1.4282 and 1.4258
Yen Eyes US Payrolls, Japan Household Spending Jumps
The Japanese yen is in negative territory on Friday. This follows a two-day rally which saw the yen jump 1.9% and hit a three-month high. In the European session, USD/JPY is trading at 151.94, up 0.39% on the day. On the data front, Japan’s household spending was much stronger than expected and the US releases nonfarm payrolls.
Japan’s household spending hits 2.5-year high
Japan’s household spending has been struggling as inflation remains relatively high. This made the December report a pleasant surprise, as household spending was much higher than expected. Annually, household spending climbed 2.7%, crushing the market estimate of 0.2% and rebounding from -0.4% in November. The monthly gain of 2.3% followed the November reading of 0.4% and beat the market estimate of -0.5%.
Household spending was the strongest since Aug. 2022, driven by strong wage gains. However, it is questionable whether the impressive gain is a temporary blip, given that the December wage growth was largely driven by bonuses. Still, real wages (adjusted for inflation) rose for a second straight month in December, which supports the case for the Bank of Japan to continue raising interest rates. BoJ policy makers have been unusually candid about plans to raise rates, although the timing is uncertain, with May or August strong possibilities for the next rate hike.
US nonfarm payrolls expected to drop
The US wraps up the week with nonfarm payrolls, one of the most important economic events. The market estimate stands at 170 thousand for January, after a surprisingly strong gain of 256 thousand in December. If the January forecast is accurate, it would mark a sharp drop that would make headlines, but is close to the past three-month average.
The Federal Reserve won’t be worried if job creation slows, as long as the labor market is cooling at a slow pace. The Fed is expected to cut rates only once or twice this year, but that could change if inflation or the labor market provide any surprises.
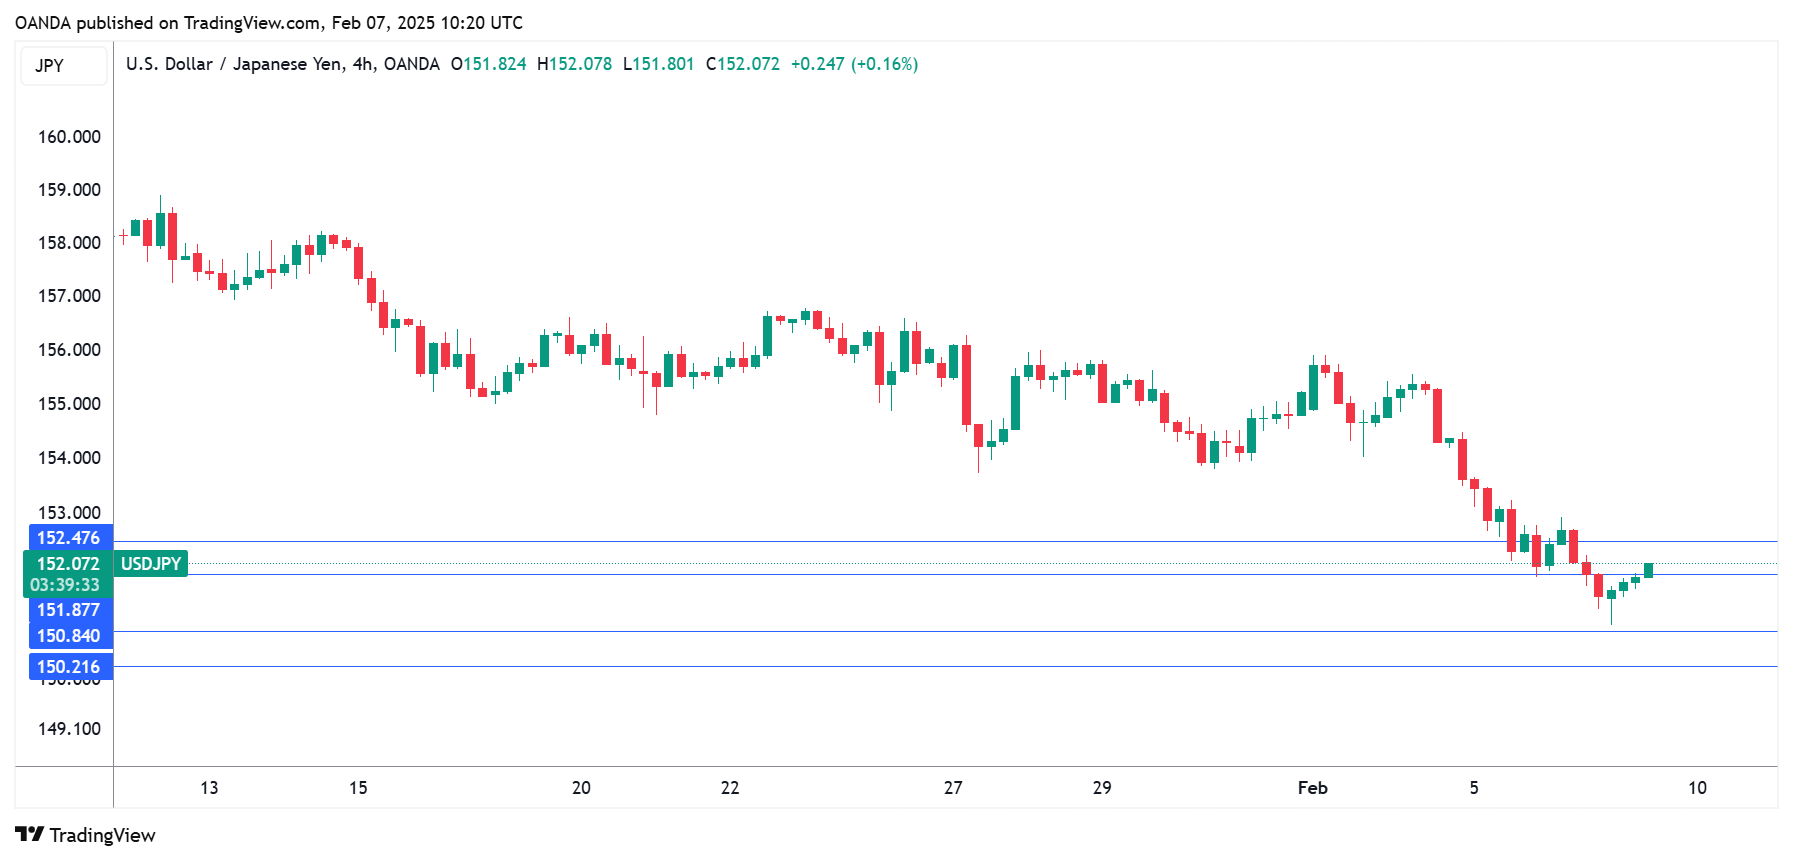
USD/JPY Technical
- USD/JPY is testing resistance at 151.86. Next, there is resistance at 152.48
- 150.83 and 150.21 are the next support levels
Gold’s Rise: A New Bull Market Dawns
Gold prices reached all-time highs at the end of last month and have continued to climb steadily into the first week of February. This marks the sixth consecutive bullish weekly candle, with a 2.5% gain over the past seven days. This performance is noteworthy, especially given the fluctuations in most other markets.
From a technical perspective, gold is starting a Fibonacci extension pattern. The global rally commenced in October 2023 following initial signals from the Federal Reserve indicating an easing of monetary policy and a subsequent slowdown in the pace of rate hikes. Between October and November 2024, after appreciating by 55% to reach the $2790 level, gold experienced significant profit-taking, resulting in a pullback to $2550, which represents 76.4% of the initial rally. This was followed by several weeks of intense trading between bullish and bearish market participants.
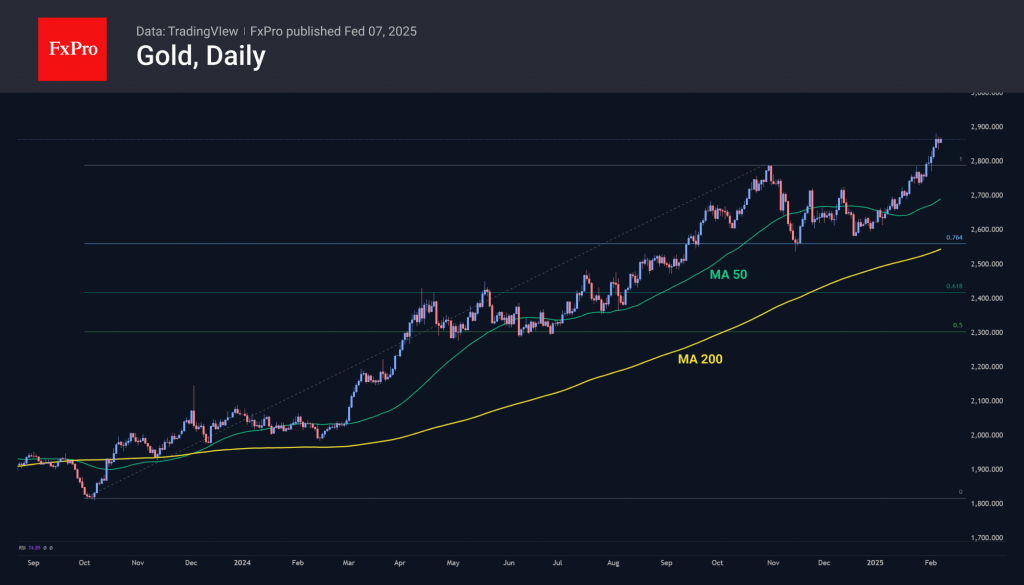
By the end of December, steady buying momentum had returned to the gold market. A move above $2800 in late January has led to discussions about the potential onset of a new global growth wave. If this trend continues, the price of gold may potentially reach the $3400 per troy ounce area between August and October of this year.
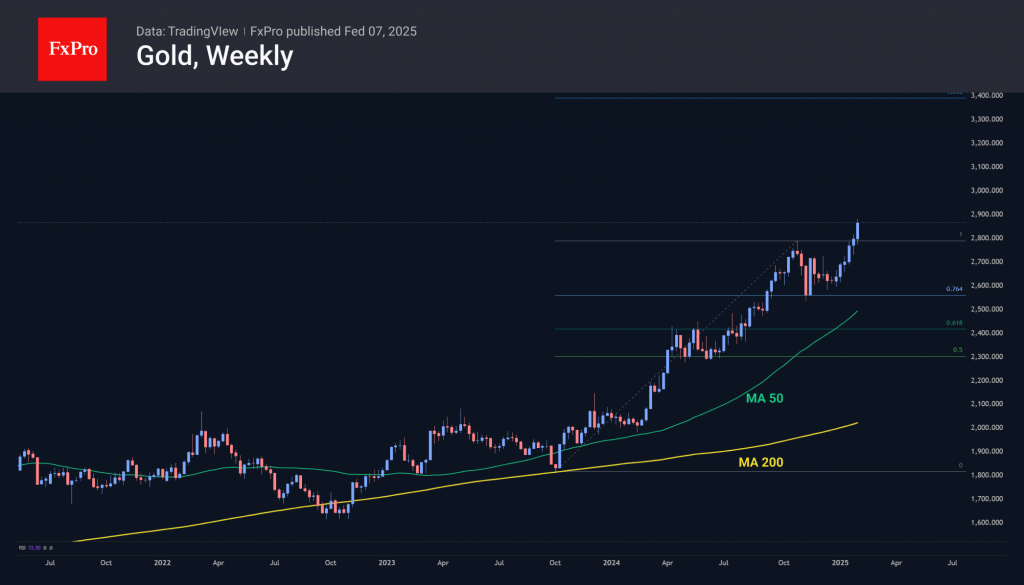
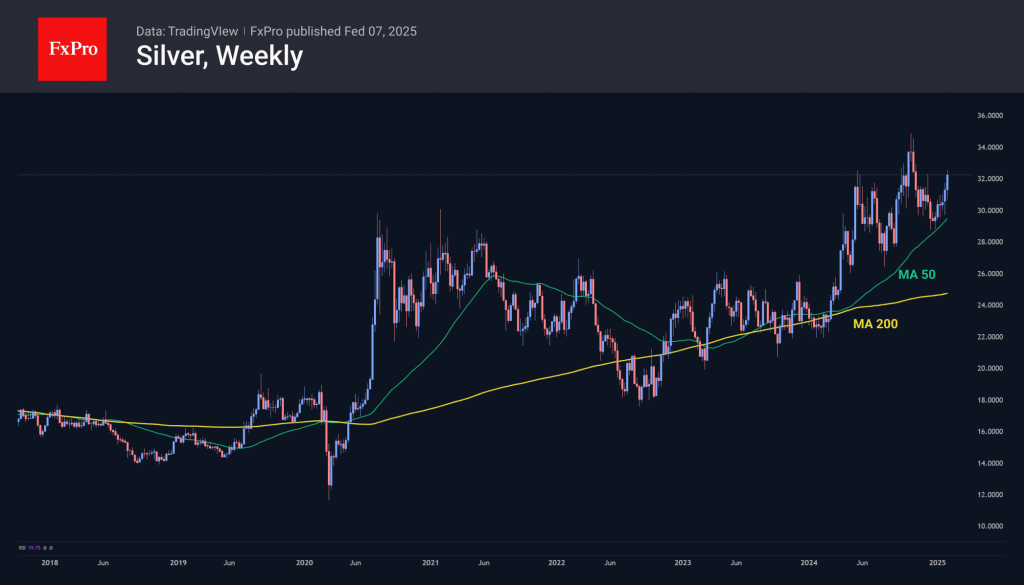
In contrast, silver remains more subdued, currently sitting 7% below its highs from October last year. However, it has shown strong performance over the past week. Should gold continue its upward trajectory, silver is expected to rise at a faster pace, thereby recovering lost ground.
Crypto Market Blues: A Week of Decline
Market Picture
The cryptocurrency market has decreased by more than 11% over the past seven days. The primary impact for bearish investors occurred over the weekend and on Monday following the imposition of US tariffs against Canada, Mexico, and China. Despite an initial rally, the market continued its decline, reaching a value of 3.15 trillion, which represents a dip below the previous cyclical low.
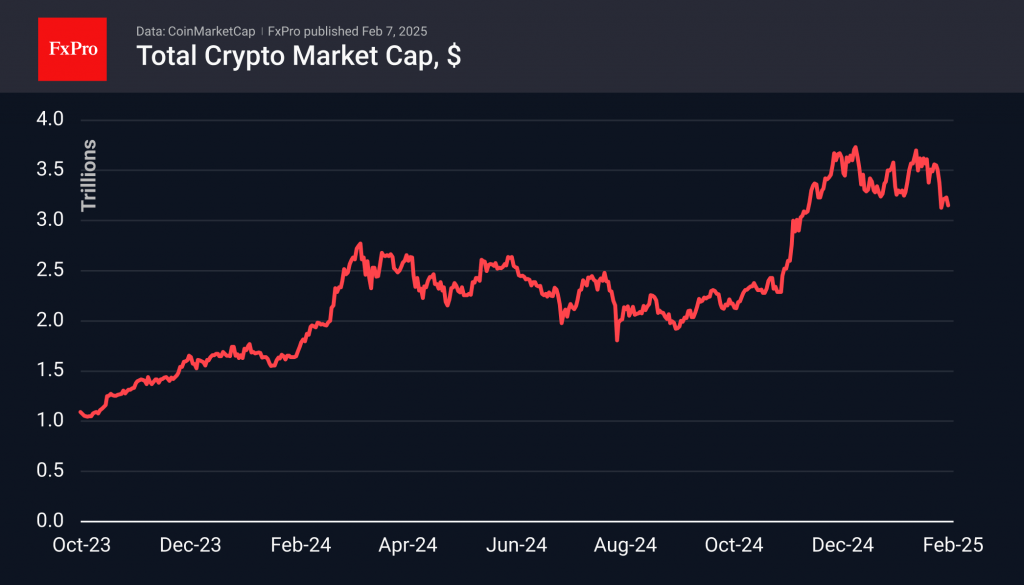
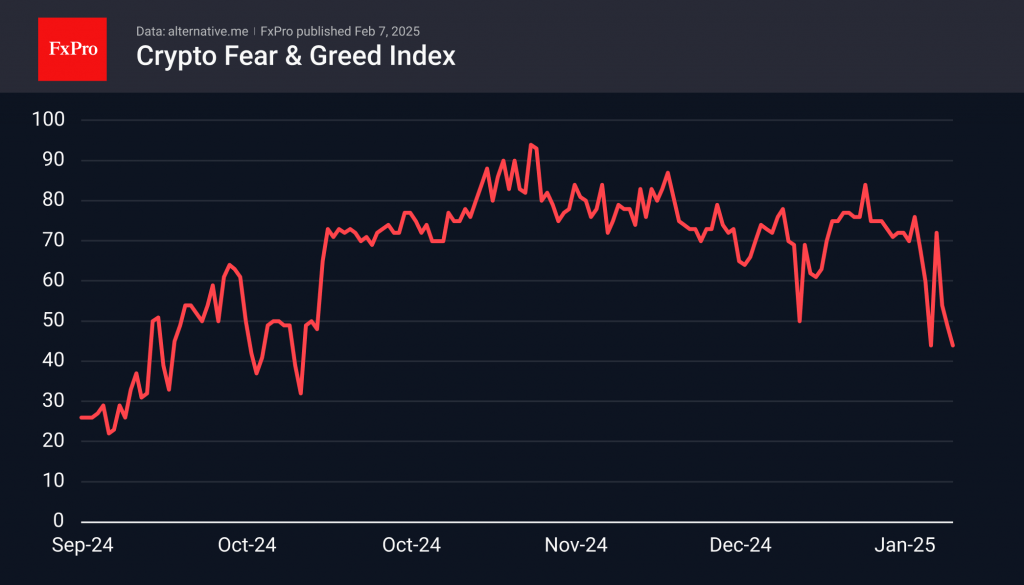
A similar pattern was observed in March of last year when the market experienced a prolonged and somewhat alarming sideways slump. The crypto market sentiment indices accurately reflected this mood, demonstrating a shift back into fear territory by the end of the week.
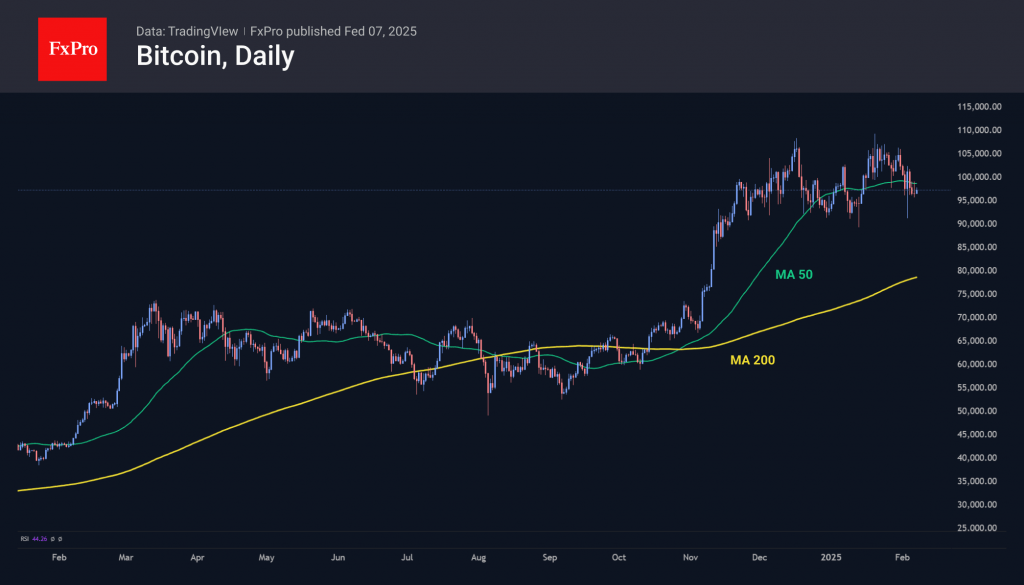
Current conditions are relatively favourable for bitcoin. Although the leading cryptocurrency has also declined, it has done so at a slower rate compared to the overall market, losing slightly more than 6% over the seven-day period. Bitcoin’s price has fallen below $97K and is now trading beneath its 50-day moving average. Consolidation below this level indicates a potential disruption of the uptrend, with a pullback to the 200-day moving average, near $80K, considered a possible target.
News Background
Arthur Hayes forecasts that Bitcoin will return to the $70K-$75K range. The Former BitMEX head said the driver of the decline would be the realisation that the current US president’s policies are virtually the same as those of his predecessors. He believes the creation of a US Special Bitcoin Reserve (SBR) could be a “net negative” for the industry as digital gold becomes a “political weapon. “
Ethereum’s share of the total crypto market capitalisation has fallen to its lowest level in four years. JPMorgan said ETH will continue to face “intense competition” from Solana and Layer 2 (L2) solutions with lower fees and higher performance.
If Ethereum holds $2500, it could “bounce to $4000 or even $6000,” predicts tech analyst Ali Martinez. If the $2500 level is breached, the next target will be $1700. Martinez noted that capital continues to flow from Bitcoin and Ethereum into stablecoins.
According to a JPMorgan survey of 4,200 of the bank’s global clients, 71% of institutional investors do not plan to trade cryptocurrencies in 2025.
USDCHF: Inverse Head-And-Shoulders Pattern
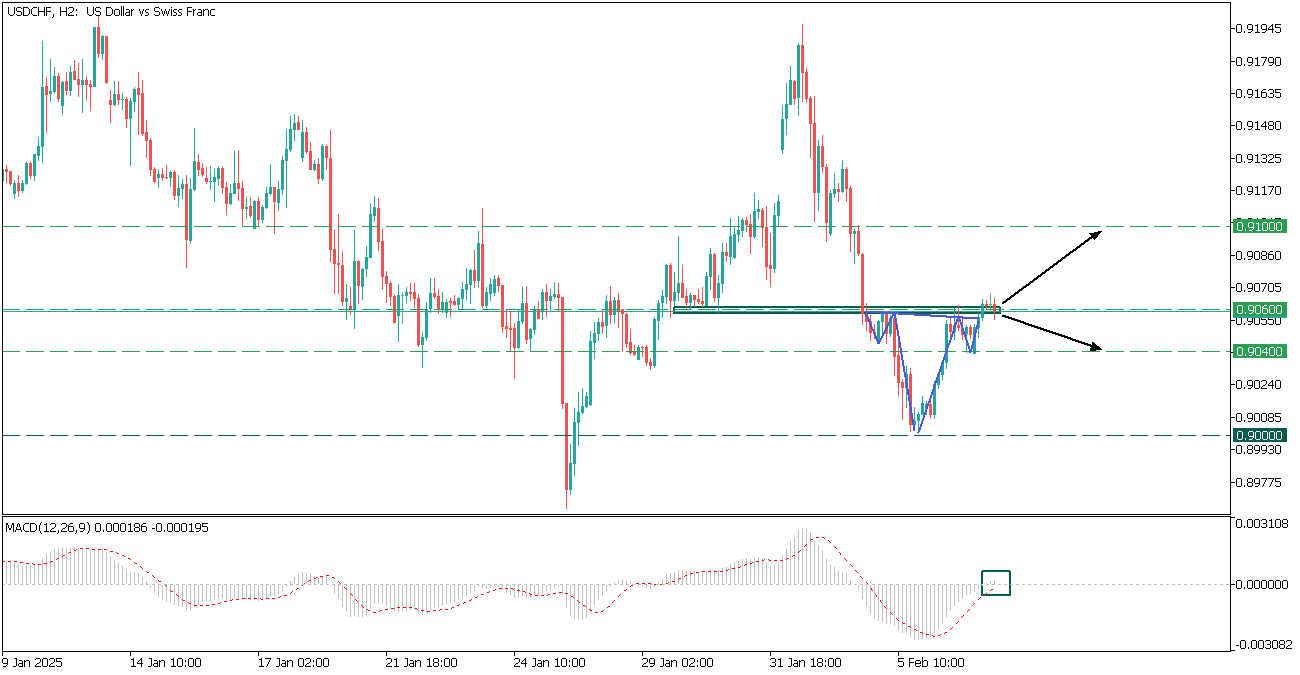
USDCHF, H2
USDCHF is recovering after a decline and formed a head-and-shoulders pattern.
- The MACD histogram crosses the 0-line upwards, however the 0.9060 resistance area is strong, giving a mixed sentiment for the asset.
- If the price breaks above the 0.9060 resistance, it may propel the asset to 0.9100.
However, if the retest fails. It may trigger a decline toward the 0.9040.
USD/JPY Looks for a Rebound
- USD/JPY bulls show some signs of life near a two-month low.
- Oversold signals present; key resistance at 151.80.
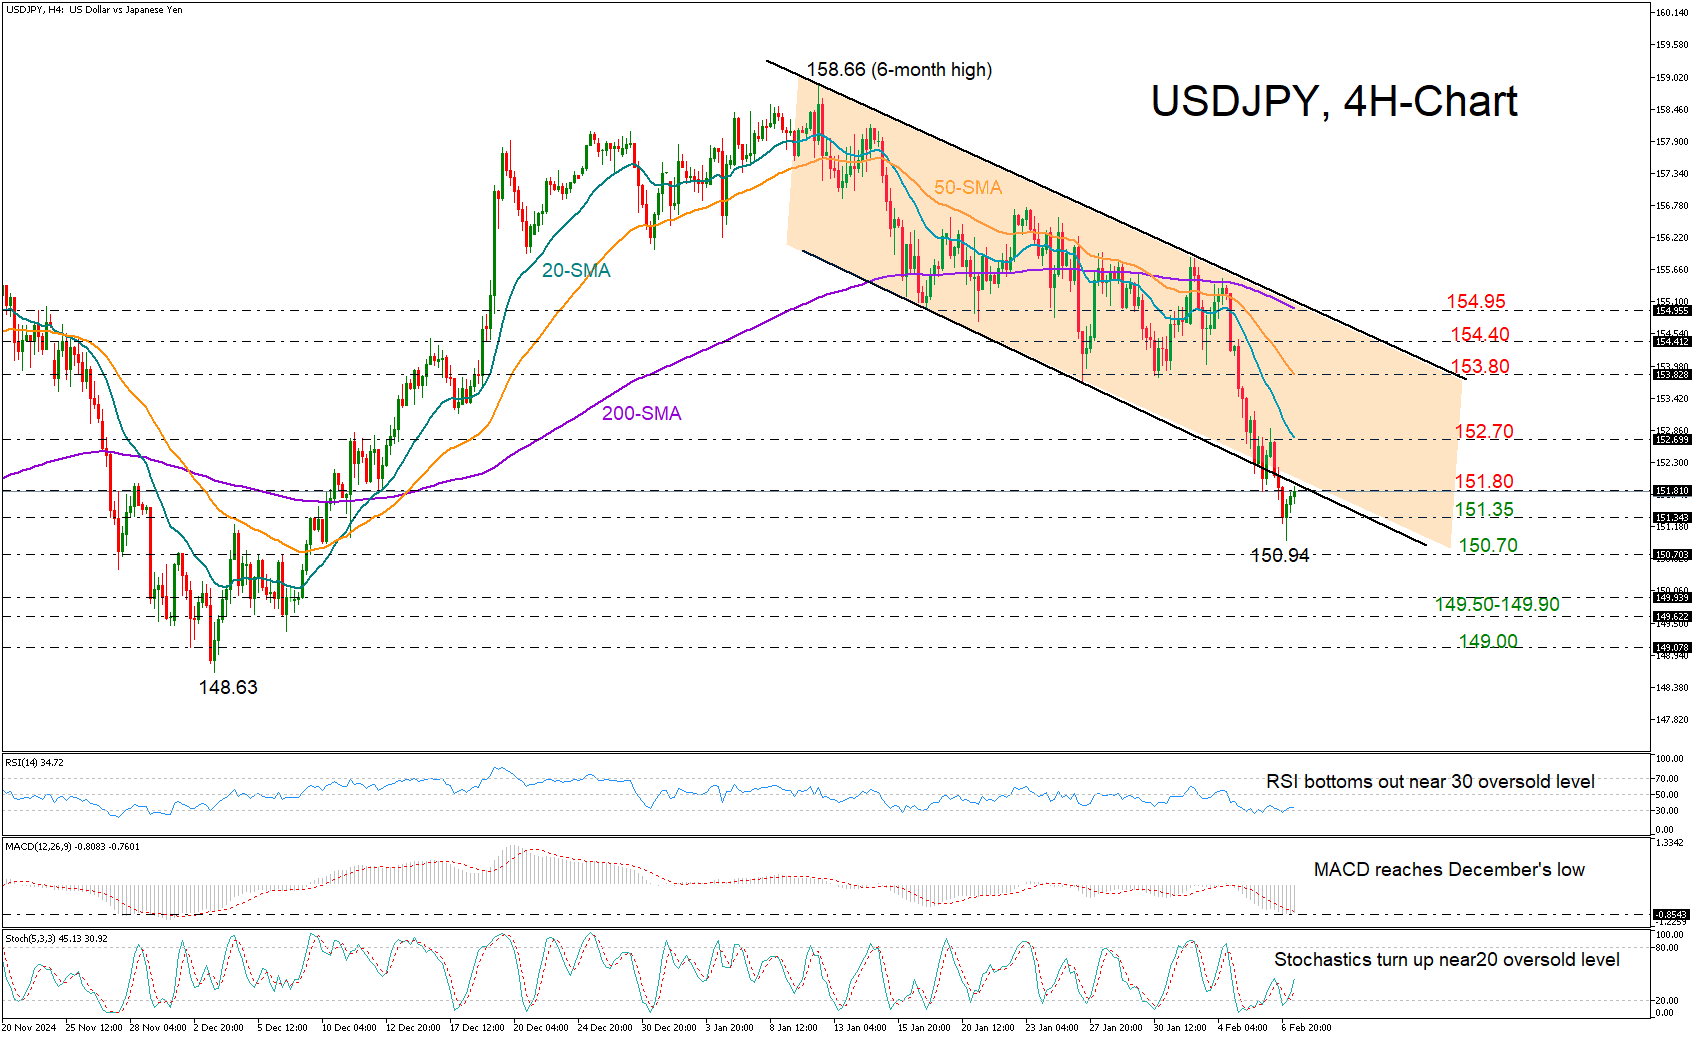
USDJPY is showing tentative signs of life after its recent freefall took a halt at 150.94 – the lowest since December – though upside pressures remain subdued, with the price currently struggling to cross above 151.80.
The falling exponential moving averages (EMAs) are endorsing the negative trajectory in the market, but oversold signals coming from the RSI and the stochastic oscillator suggest the decline has gone too far and a recovery or a consolidation phase could be underway.
If the bulls claim the 151.80 region, where the lower band of the broken bearish channel is placed, they could set their sights on the 20-period EMA at 152.70. A move higher could pave the way towards the 50-day EMA near 153.80, while the 154.40 region could be another obstacle before the channel’s upper band and the 200-period EMA at 154.95 come under examination.
In the bearish scenario that the pair closes below the 151.35 floor, the 150.70 barrier taken from December could provide some relief. If selling interest intensifies, traders might watch for a sharp drop to 149.50-149.90 and then down to 149.00.
Summing up, USDJPY is maintaining a bearish short-term outlook but oversold conditions hint that a rebound could be in play if 151.80 is conquered.
Crude Oil Price Hits New 2025 Low
As shown on the XBR/USD chart, the price of Brent crude oil dropped to $73.92 yesterday:
→ this marks a new low for 2025;
→ the decline since 15 January exceeds 9%.
Bearish sentiment is being driven by Trump's policies. According to Reuters, the Brent crude price is falling due to:
→ US President Donald Trump’s renewed trade war with China;
→ threats of tariff hikes for other countries;
→ high oil inventory levels in the US;
→ Trump’s promise yesterday to increase US oil production.
Additionally, the US Treasury Department announced yesterday that it was imposing new sanctions on several individuals and tankers involved in delivering millions of barrels of Iranian crude oil to China each year, adding to the volatility of Brent crude prices.
Could the Brent crude price continue to fall?
From a technical analysis perspective of the XBR/USD chart, we can see that the price has dropped to a key support level around $75 per barrel. At this level, bulls had the upper hand, managing to break a major resistance line at the end of 2024. It is possible that bulls remain strong in this price range, and the long lower wick on the candlestick—marked with a blue arrow—supports this idea.
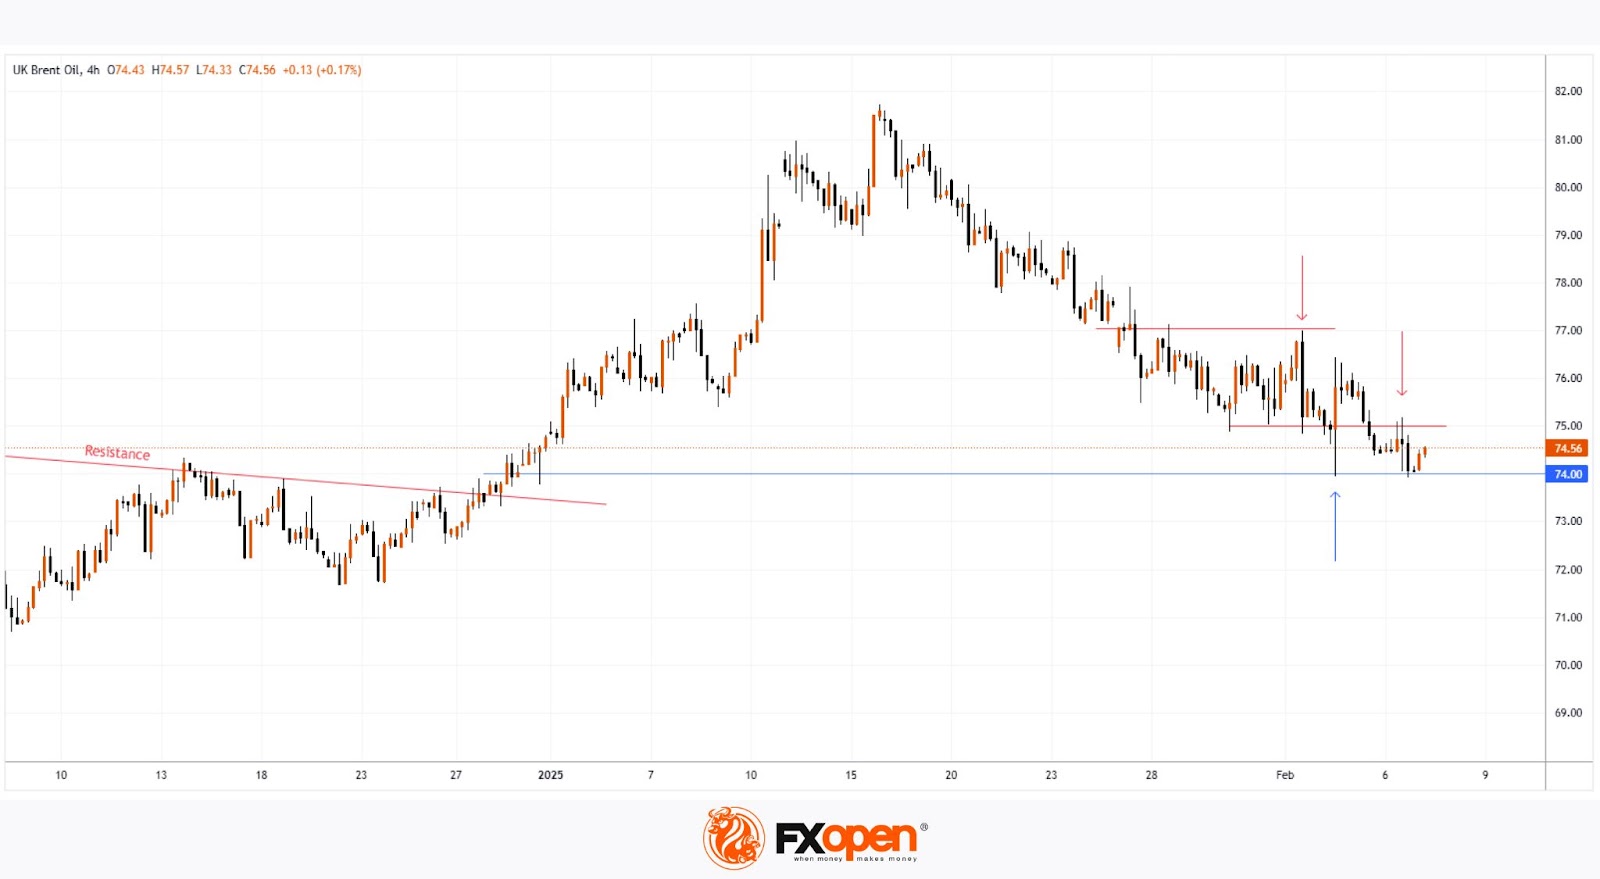
On the other hand, bears appear to be gradually gaining control at increasingly lower levels (as indicated by the red arrows):
→ the $77 level acted as resistance when Brent crude prices moved in February;
→ the $75 level has now shifted from support to resistance.
Given these factors, it is reasonable to assume that supply and demand forces may balance each other out at current levels, leading to signs of consolidation in the Brent crude price chart.
Start trading commodity CFDs with tight spreads. Open your trading account now or learn more about trading commodity CFDs with FXOpen.
This article represents the opinion of the Companies operating under the FXOpen brand only. It is not to be construed as an offer, solicitation, or recommendation with respect to products and services provided by the Companies operating under the FXOpen brand, nor is it to be considered financial advice.
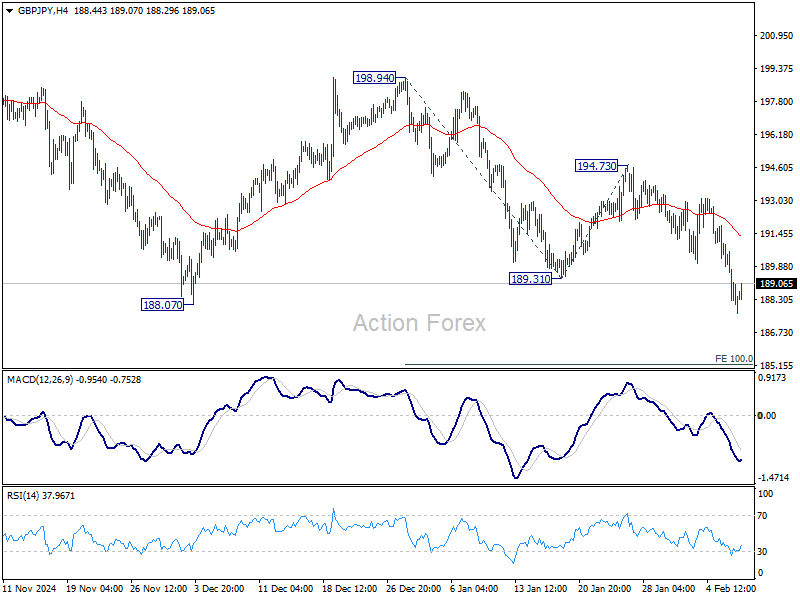
GBP/JPY Daily Outlook
Daily Pivots: (S1) 187.28; (P) 189.13; (R1) 190.18; More...
Intraday bias in GBP/JPY remains on the downside for the moment. Corrective pattern from 180.00 might have completed already. Deeper fall would be seen to 100% projection of 198.94 to 189.31 from 194.73 at 185.10. For now, risk will stay on the downside as long as 194.73 resistance holds, in case of recovery.
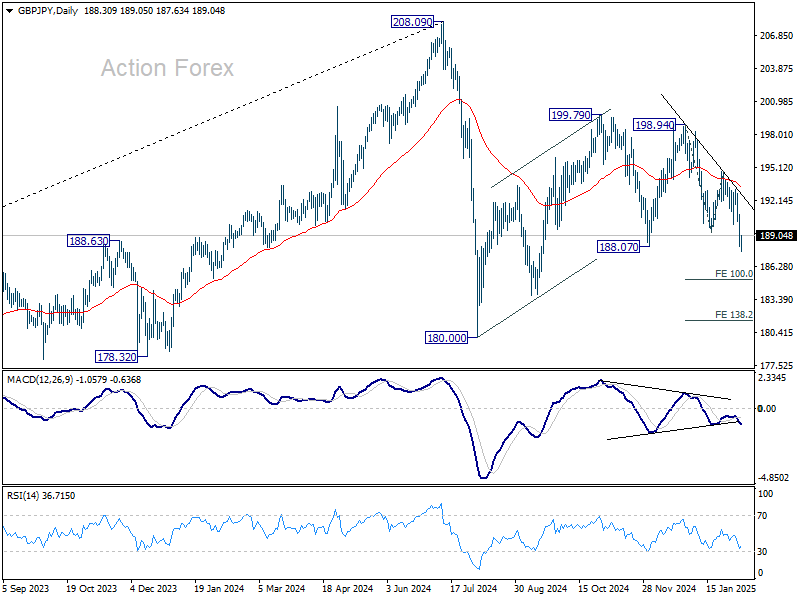
In the bigger picture, price actions from 208.09 are seen as a correction to whole rally from 123.94 (2020 low). The range of consolidation should be set between 38.2% retracement of 123.94 to 208.09 at 175.94 and 208.09. However, decisive break of 175.94 will argue that deeper correction is underway.
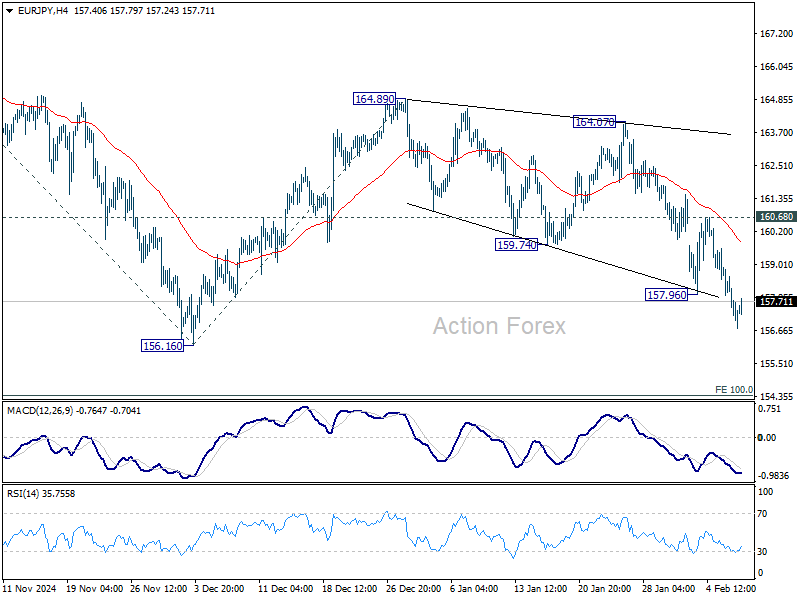
EUR/JPY Daily Outlook
Daily Pivots: (S1) 156.59; (P) 157.72; (R1) 158.41; More...
EUR/JPY's fall resumed by breaking through 157.96 and intraday bias is back on the downside for 156.16 support. Firm break there would argue that corrective pattern from 154.40 has completed at 166.67. Deeper fall would be seen to 100% projection of 166.7 to 156.16 from 164.89 at 154.38. For now, risk will stay on the downside as long as 160.68 resistance holds, in case of recovery.
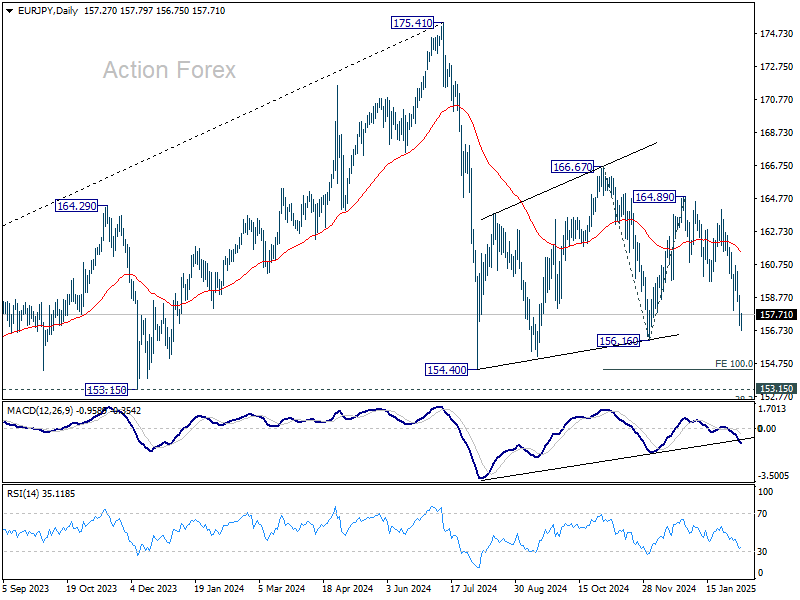
In the bigger picture, price actions from 175.41 are seen as correction to rally from 114.42 (2020 low). The range of consolidation should have been set between 38.2% retracement of 114.42 to 175.41 at 152.11 and 175.41 high. However, decisive break of 152.11 would argue that deeper correction is underway.
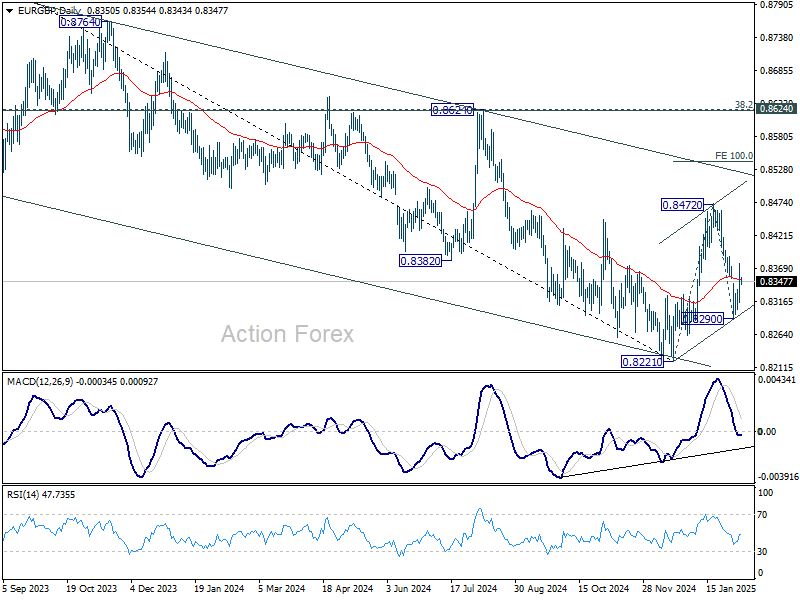
EUR/GBP Daily Outlook
Daily Pivots: (S1) 0.8317; (P) 0.8348; (R1) 0.8381; More...
Intraday bias in EUR/GBP remains mildly on the upside for the moment. Rebound from 0.8290 would extend to 0.8472 resistance. Firm break there will resume the rebound from 0.8221. On the downside, break of 0.8290 will target a retest on 0.8221 low.
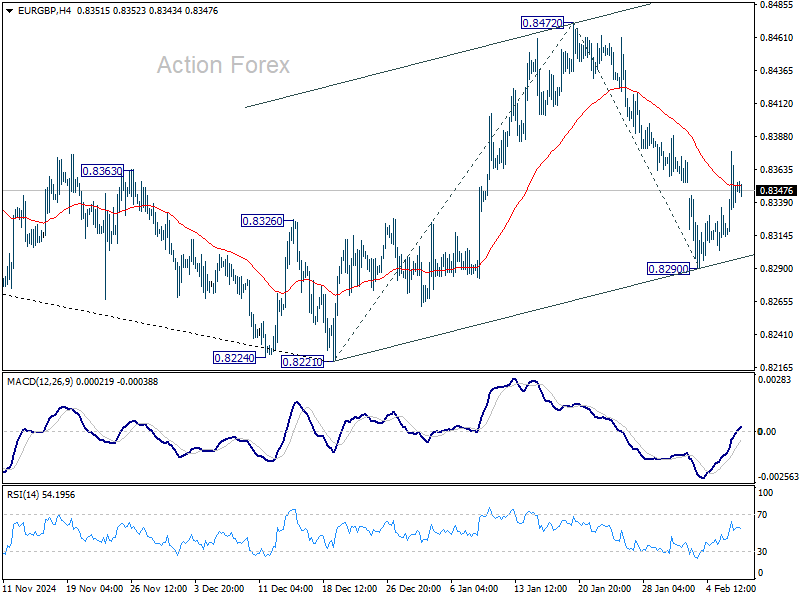
In the bigger picture, a medium term bottom should be in place at 0.8221, just ahead of 0.8201 key support (2022 low). Sustained trading above 55 W EMA (now at 0.8442) will pave the way to 0.8624 cluster zone (38.2% retracement of 0.9267 to 0.8221 at 0.8621), even just as a correction to the down trend from 0.9267 (2022 high). But still, medium term outlook will be neutral at best as long as 0.8621/4 holds.