Sample Category Title
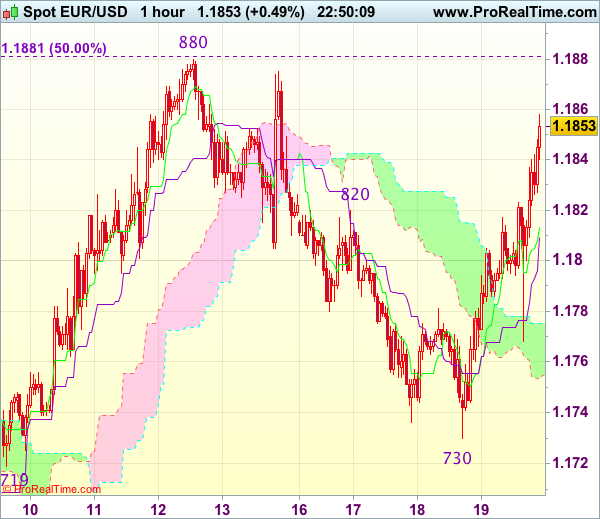
Trade Idea Wrap-up: EUR/USD – Exit short entered at 1.1850
EUR/USD - 1.1848
Most recent candlesticks pattern : N/A
Trend : Near term up
Tenkan-Sen level : 1.1813
Kijun-Sen level : 1.1809
Ichimoku cloud top : 1.1775
Ichimoku cloud bottom : 1.1755
Original strategy :
Sold at 1.1850, Target: 1.1750, Stop: 1.1885
Position : - Short at 1.1850,
Target : - 1.1750
Stop : - 1.1885
New strategy :
Exit short entered at 1.1850,
Position : - Short at 1.1850
Target : -
Stop : -
As the single currency found renewed buying interest at 1.1768 earlier today in European session and has rallied, dampening our bearishness and near term upside risk remains for the rebound from 1.1730 to extend gain to resistance at 1.1880 but break there is needed to retain bullishness and signal another leg of erratic upmove from 1.1669 low is underway for gain to 1.1900-10 first.
In view of this, would be prudent to exit short entered at 1.1850 and stand aside for now. Below 1.1820 would bring weakness to 1.1800 but said support at 1.1768 should remain intact, bring another rise later. Only a drop below this support would revive bearishness for weakness to 1.1730-40, break there would extend fall to 1.1700 but said recent low at 1.1669 should remain intact.
Yen Improves Despite Strong US Data
The Japanese yen has gained ground on Thursday, erasing most of the losses which marked the Wednesday session. In the North American session, USD/JPY is trading at 112.41, down 0.45% on the day. In economic news, unemployment claims plunged to 222 thousand, well below the estimate of 240 thousand. There was more good news, as the Philly Fed Manufacturing Index jumped to 27.9, crushing the estimate of 21.9 points. On Friday, the US will release Existing Home Sales and Fed Chair Janet Yellen speaks at an event in Washington.
Who will replace Janet? The markets are keeping a close eye on who will replace Janet Yellen as head of the powerful Federal Reserve. Yellen is due to finish her 3-year term in February 2018. Yellen is apparently interested in serving a second term, but President Trump likely has other ideas. Trump has not been complimentary towards Yellen, although it's hard to argue that Yellen has done an admirable job. Yellen has ended quantitative easing, raised interest rates and started to unwind the Fed's balance sheet. Trump's shortlist includes Jerome Powell, Kevin Warsh and John Taylor. Trump may lean towards Taylor, an economist who is considered more hawkish on policy than Yellen. Under Taylor, interest rates would likely move substantially higher than the current 1.25%, and a rate hike early in 2018 could strengthen the US dollar.
Japan's economy has impressed in 2017, and an important reason for the rebound has been the manufacturing sector. Manufacturing indicators are pointing upwards and recent polls are pointing to strong optimism among manufacturers. A Reuters poll released on Tuesday showed that manufacturer confidence in October was at its highest level since 2007, echoing a Bank of Japan survey taken earlier in October. Automobile and electric machinery exports remain strong and have helped boost the manufacturing sector. The BOJ holds a policy meeting on October 30-31, at which time it will set interest rates and will also publish its long-term economic and price forecasts. We can expect the economic forecasts to be more positive than the inflation projection. With the BoJ forecasting that inflation will not reach 2 percent until fiscal year 2020, it's a safe bet that the bank's accommodative policy will not be tightened any time soon.
Economic Growth in China Remains Largely Unchanged in Q3
Chinese real GDP growth met expectations in Q3, rising 6.8 percent year-over-year. The deceleration in fixed investment spending in China continued, however, as a result of both secular and cyclical trends.
Chinese GDP Growth Slows Slightly in Q3
Data released today showed the Chinese economy growing 6.8 percent on a year-ago basis in Q3, matching the Bloomberg consensus forecast (top chart). The print marks a 0.1 percentage point slowdown from the 6.9 percent pace registered through the first two quarters of the year.
Although a breakdown of GDP into its demand components is not yet available, sector level data indicate that growth was largely steady in the key sectors of the Chinese economy. Growth in the secondary industry, which includes mining/quarrying, manufacturing, construction and utilities production, ticked lower by 0.1 percentage point to 6.3 percent on a year-over-year, year-to-date basis. The momentum may have reversed course late in the quarter, however, as Chinese industrial production data released in a separate report today showed output climbing 6.6 percent year-over-year in September, a marked improvement from the 2017 low of 6.0 percent growth in August. Growth in the tertiary industry, or the service sector, was modestly stronger, as was output in the primary sector, which includes agriculture, forestry and fishing.
Economic growth in China has firmed in 2017 relative to last year's pace amid the stronger global growth environment. At present, we expect real global GDP to accelerate about half a percentage point in 2017 from the growth rate registered in 2016. Even with the faster growth at home and abroad, fixed investment spending in China has continued to decelerate (middle chart). Some of the slowdown has been the continuation of a secular trend; investment spending has decelerated for most of this cycle as the Chinese economy continues the steady transition towards a more consumption-oriented growth model. To that point, retail sales data released today showed continued double-digit year-to-date growth through the month of September. More recently, investment spending growth has continued to slow as Chinese policymakers have moved to tighten policy amid concerns that the credit expansion, that occurred when the economy was slowing, might lead to debt imbalances.
Outlook Is for Modestly Slower Growth in China in 2018
As we have highlighted in previous reports, the leverage in the nonfinancial corporate sector in China, particularly for state-owned enterprises (SOEs) is an area we have identified as a potential risk to the outlook (bottom chart).* At the ongoing 19th Party Congress, the signals from leaders have suggested that policymakers will not move anytime soon to scale back the SOEs. We do not believe the corporate leverage/SOE challenges are likely to cause an implosion in the Chinese economy anytime soon, but they do represent both a downside risk to the outlook and a secular drag on the economy's potential growth rate. We continue to expect real GDP in China to decelerate modestly in 2018 to a 6.3 percent pace.
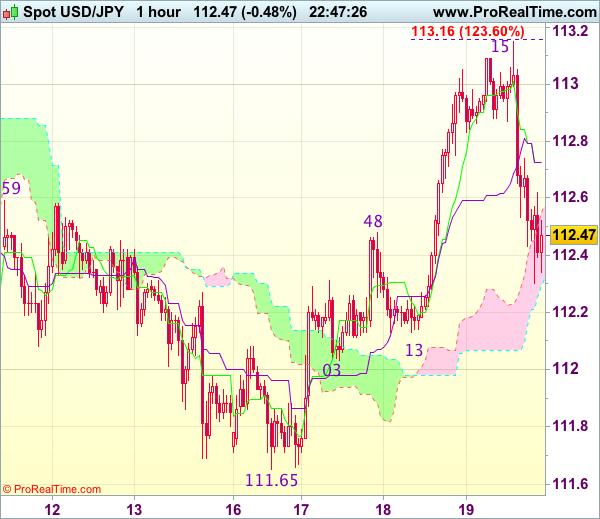
Trade Idea Wrap-up: USD/JPY -Stand aside
USD/JPY - 112.54
Most recent candlesticks pattern : N/A
Trend : Near term up
Tenkan-Sen level : 112.73
Kijun-Sen level : 112.73
Ichimoku cloud top : 112.55
Ichimoku cloud bottom : 112.30
New strategy :
Stand aside
Position : -
Target : -
Stop : -
Despite intra-day brief rise to 113.15, the subsequent much deeper than expected retreat has dampened our bullishness and signals a temporary top has been formed there, hence consolidation with mild downside bias is seen for test of indicated strong support area at 112.03-13 but break there is needed to add credence to this view and signal the rebound from 111.65 has ended, bring another fall towards this level later.
On the upside, whilst recovery to the Kijun-Sen (now at 112.73) cannot be ruled out, price should falter well below said resistance at 113.15 and bring another retreat later. Only break of said resistance at 113.15 would revive bullishness for retest of recent high at 113.44 which is likely to hold on first testing.
Chinese Economic Activity Weakens in the Third Quarter, In Line With Expectations
Chinese real gross domestic product (GDP) rose by 6.8% (year-on-year) in the third quarter, in line with consensus expectations. On a quarter-over-quarter basis, growth slowed a touch to a 1.7% pace in the third quarter, also in line with consensus. Growth in 17Q1 was revised up to 1.4% q/q from 1.3%, while growth in 17Q2 was revised up to 1.8% q/q from 1.7%. Altogether, the data released overnight puts China's economy on pace to expand at a 6.8% pace in 2017.
Nominal GDP grew 11.2% (y/y) in the third quarter, on par with the 11.1% pace recorded in the second quarter. Producer prices rose an average of 6.3% y/y, extending the streak of strong producer price gains that began at the start of this year. Consumer prices rose an average of 1.6% y/y in the quarter, the strongest pace of advance seen this year.
Economic activity on an industry basis was broad-based, with all major sectors expanding on a year-on-year basis. Secondary industry performance slowed a touch in the third quarter, likely a reflection of slower construction activity. Growth in tertiary (services) industries ticked up a bit from the previous quarter and recorded the strongest gain yet this year at 8.0% y/y. Service industries comprise the largest share of economic activity in China at just over half.
Fixed asset investment (excluding rural areas) slowed to a sub-8.0% trend pace in the third quarter after advancing at almost a 9.0% trend pace in the second quarter (reported on a year-over-year, year-to-date basis). It should be noted that fixed asset investment has been slowing consistently since early-2013 when it was rising by around 20% per year, reflecting the shift toward services.
Industrial production rose 6.6% (y/y) in September, a touch firmer than the consensus call for a 6.5% gain. However, industrial production in the third quarter as a whole slowed to its slowest pace of advance year-to-date at 6.3% y/y, suggesting slower economic activity in the fourth quarter.
Key Implications
Once again Chinese economic activity did not disappoint market expectations. But, monthly indicator data suggests that growth is likely to slow a bit further in the fourth quarter, reminiscent of the trend of strong mid-year growth giving way to weaker activity at year-end and at the start of the next year observed since 2015.
Concerns remain about the rapid pace of credit growth in China, particularly in the years following the Great Recession. Total social financing credit growth ticked up a touch in the third quarter, but remained well below the strong pace recorded in the first quarter. Slower credit growth is consistent with weaker trend growth of fixed asset investment. Chinese authorities have made some gains in reining in excess credit growth, but remain sensitive to historically high and rising levels of debt across all sectors (consisting of corporate, household, and government) in light of the risks that this poses to its domestic banking sector, particularly in an environment of slowing economic growth. As such, we anticipate policymakers will continue to maintain a tightening bias in domestic credit conditions at least for the remainder of this year.
The 19th National Congress of the Communist Party of China kicked off yesterday, and is expected to last until October 24th. Over the next few days we anticipate Chinese officials to outline an updated five-year economic plan for China, as well as announce new political appointments. Some of the most notable announcements thus far include ambitions for China to become a globally influential leader by 2050, and plans to continue to pursue market-oriented reforms that help to assure foreigners that China will open up to more foreign investment. We plan on releasing a summary of the major announcements after the conclusion of the congress.
Brent Oil Plunges
The price dropped sharply and erased the last two day's gains. It could drop much deeper in the upcoming days if will close the day below the $57.30 per barrel. Brent is very heavy right now and seems poised to turn to the downside again in the upcoming period. The rate is pressuring an important dynamic support, a valid breakdown will signal a further drop in the upcoming period.
I've said in the previous weeks that the rate could start a larger drop if will stabilize somewhere below the 57.00 psychological level. Price increased in the last weeks, but I've said that this could be only temporary and the bears could take the lead again on the short term.
Brent drops even if the United States Crude Oil Inventories have dropped to -5.7 million barrels in the previous week, much below the -4.7M estimate and versus the -2.7M in the former reading period.
Price edges lower on the Daily chart and looks determined to take out the dynamic support from the median line (ML) of the major ascending pitchfork and the horizontal support from the 57.72 static support.
Will drop much deeper if will close below the median line (ML) of the ascending pitchfork. Technically, it is expected to drop much deeper after the failure to reach and retest the upside line of the ascending channel and the 59.50 previous high. Only a valid breakdown from the up channel will signal a further drop.
EUR/CHF Setting Up For Further Gains
The rate dropped significantly today and recovered after the yesterday's impressive rally. Is retesting the broken fifth waring line (wl5) of the former descending pitchfork, the 1.1536 broken horizontal resistance (resistance turned into support) and the upper median line (uml) of the minor descending pitchfork.
A rejection from here will send the rate much higher in the upcoming period, the next target will be at the 1.1621 previous high.
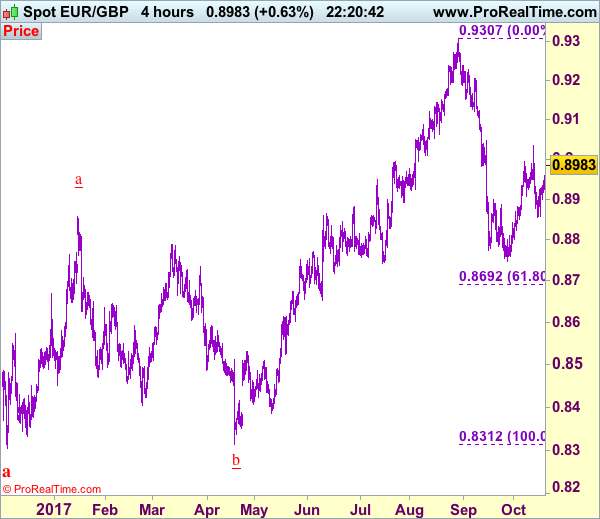
EUR/GBP Testing A Confluence Area
EUR/GBP increased sharply and resumed the minor rebound. Is pressuring the confluence between the minor downtrend with the median line (ML) of the major ascending pitchfork. A valid breakout through the confluence area and above the 0.9000 psychological level will accelerate the bullish momentum. Another drop will be confirmed by a rejection, followed by a minor drop.
Trade Idea: EUR/GBP – Hold short entered at 0.8975
EUR/GBP - 0.8979
Original strategy :
Sold at 0.8975, Target: 0.8855, Stop: 0.9015
Position : - Short at 0.8975
Target : - 0.8855
Stop : - 0.9015
New strategy :
Hold short entered at 0.8975, Target: 0.8855, Stop: 0.9015
Position : - Short at 0.8975
Target : - 0.8855
Stop : - 0.9015
Although the single currency has rebounded again today and marginal gain from here cannot be ruled out, if our view that top has been formed at 0.9033 last week is correct, upside would be limited and bring another decline later, below 0.8925 would suggest an intra-day top is formed, bring test of 0.8899 but break there is needed to signal the rebound from 0.8856 has ended, bring another test of indicated support at 0.8850-56. Once this level is penetrated, this would add credence to this view and signal the rise from 0.8746 low has ended, bring further fall to 0.8800-10 later.
In view of this, we are holding on to our short position entered at 0.8975. Above 0.9000 would defer and risk a stronger rebound to 0.9015-20 but still reckon price would falter well below said resistance at 0.9033, bring another selloff.
Our preferred count is that, after forming a major top at 0.9805 (wave V), (A)-(B)-(C) correction is unfolding with (A) leg ended at 0.8400 (A: 0.8637, B: 0.9491 and 5-waver C ended at 0.8400. Wave (B) has ended at 0.9413 and impulsive wave (C) has either ended at 0.8067 or may extend one more fall to 0.8000 before prospect of another rally. Current breach of indicated resistance at 0.9043 confirms our view that the (C) leg has ended and bring stronger rebound towards 0.9150/54, then towards 0.9240/50.
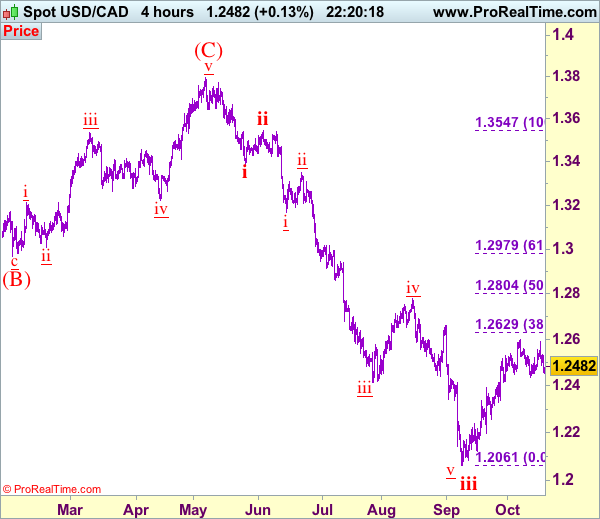
Trade Idea: USD/CAD – Stand aside
USD/CAD - 1.2481
Trend: Down
Original strategy :
Exit long entered at 1.2515,
Position: - Long at 1.2515
Target: -
Stop: -
New strategy :
Stand aside
Position: -
Target: -
Stop:-
As the greenback retreated after meeting resistance at 1.2591, retaining our view that further consolidation below indicated previous resistance at 1.2599 would be seen and test of 1.2433 support cannot be ruled out, however, break there is needed to signal top has been formed at 1.2599, bring further fall to 1.2400 and later towards 1.2350-55 but indicated previous support at 1.2313 would hold from here.
On the upside, above 1.2530-35 would bring another bounce towards 1.2591-99 but only break there would revive bullishness and signal the rise from 1.2061 low (wave iii trough) has resumed for further gain towards previous resistance at 1.2663, however, upside should be limited to 1.2700 and price should falter well below another previous resistance at 1.2778. We are keeping our count that wave v as well as wave (C) ended at 1.3794 and impulsive wave (i ii, i ii) is now unfolding with minor wave iii ended at 1.2414, followed by wave iv correction ended at 1.2778, wave v has reached our indicated downside target at 1.2100 and may extend to 1.2000.
To recap, wave B from 1.3066 is unfolding as an a-b-c and is sub-divided as a: 1.2192, b: 1.2716 and wave c is a 5-waver with i: 1.1983, ii: 1.2506, extended wave iii with minor iii at 1.0206, wave iv ended at 1.0781 and wave v as well as wave iii has ended at 0.9931, hence the subsequent choppy trading is the wave iv which is unfolding as (a)-(b)-(c) with (a) leg of iv ended at 1.0854, followed by (b) leg at 1.0108 and (c) leg as well as the wave iv ended at 1.0674. The wave v is sub-divided by minor wave (i): 0.9980, (ii): 1.0374, (iii): 0.9446, (iv): 0.9913 and (v) as well as v has possibly ended at 0.9407, therefore, consolidation with upside bias is seen for major correction, indicated target at 1.3700 and 1.4000 had been met and further gain to 1.4700 would be seen later.