Sample Category Title
GBP/USD Elliott Wave Analysis
GBP/USD – 1.3254
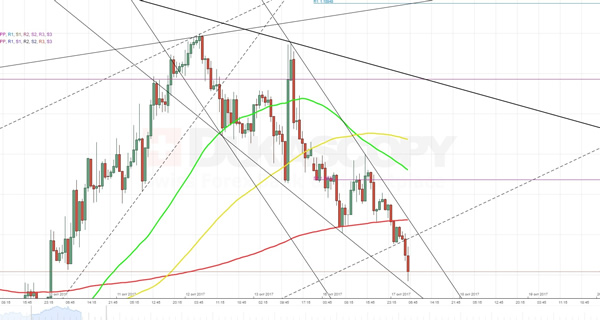
Although sterling found good support at 1.3121 last week and staged another rebound, as 1.3338 capped cable’s upside and the pair has retreated since, retaining our bearishness, as long as this resistance holds, consolidation with mild downside bias remains for another retreat, a daily close below said support at 1.3121 would signal the rebound from 1.3027 low has ended and bring retest of this level. Looking ahead, a drop below this level would signal the fall from 1.3658 top has resumed for weakness to 1.3000, then towards 1.2950 but support at 1.2909 should limit downside and another previous support at 1.2852 would remain intact.
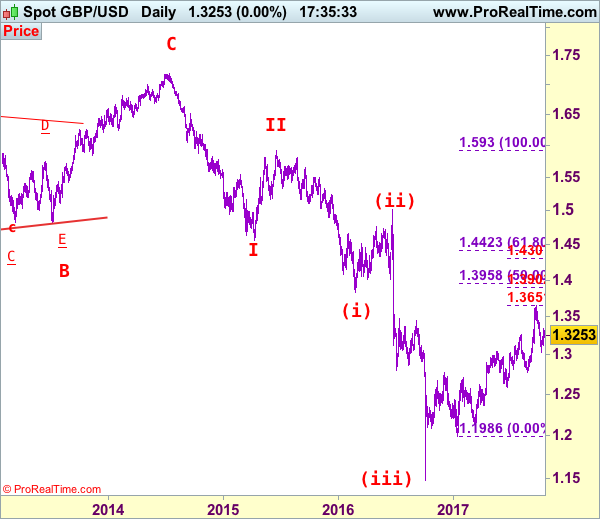
Our preferred count on the daily chart is that cable's rebound from 1.3500 (wave (A) trough) is unfolding as a wave (B) with A ended at 1.7043, followed by triangle wave B and wave C as well as wave (B) has possibly ended at 1.7192, below support at 1.4232 would add credence to this count, then further fall to 1.4000 level would follow but reckon downside would be limited to 1.3655 support and price should stay above previous support at 1.3500.
On the upside, expect recovery to be limited to 1.3295-00 and bring another retreat. Above previous support at 1.3343 would defer and risk a stronger rebound to 1.3400 and possibly towards resistance at 1.3455, however, if our view that top has been formed at 1.3658 is correct, upside would be limited and bring another decline later.
Recommendation: Hold short entered at 1.3300 for 1.3050 with stop above 1.3345.
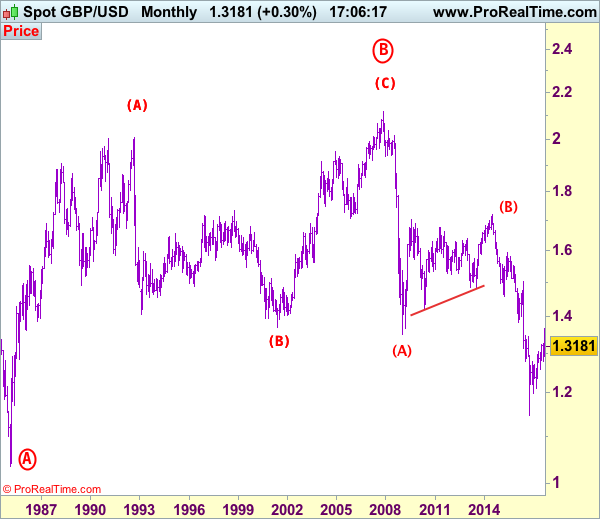
Longer term - Cable's rise from 1.0520 (Feb 1985) to 2.0100 (September 1992) is seen as [A], the decline to 1.3682 is labeled as (B) and (C) wave rally has ended at 2.1162 (9 Nov, 2007) which is also the top of larger degree wave B with circle. The selloff from there is a 5-waver with wave (A) ended at 1.3500 (23 Jan 2009), wave (B) itself is labeled as A: 1.6733, triangle wave B: 1.4813 and wave C as well as top of wave (B) ended at 1.7192 (2014), hence the selloff from there is an impulsive wave (C) with wave I : 1.4566, wave II 1.5930, an extended wave III is unfolding and already exceeded our downside target at 1.3500 and 1.3000, hence weakness to 1.2500 and possibly 1.2000 cannot be ruled out, however, price should stay well above psychological level at 1.0000.
GBP/JPY Elliott Wave Analysis
GBP/JPY – 148.65
Sterling’s retreat from 152.85 (last month’s high) turned out to be much stronger than expected, suggesting a temporary top has possibly been formed there, hence consolidation with mild downside bias is seen and weakness to 147.40-50 cannot be ruled out, however, break of support at 146.95 is needed to add credence to this view, bring retracement of recent rise to 146.00-10 and possibly towards support at 145.25, however, near term oversold condition should limit downside to 144.50 and 143.95-00 should remain intact.
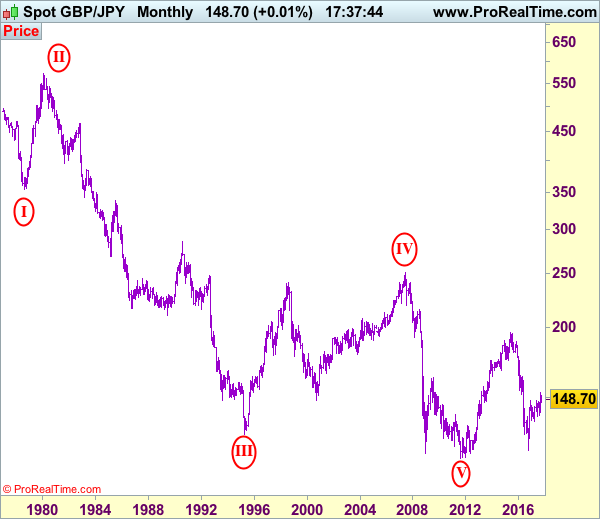
Our preferred count is that larger degree wave V with circle is unfolding from 251.12 with wave (I) 219.34, (II): 241.38 and wave (III) is subdivided into 1: 192.60, 2: 215.89 (23 Jul 2008) and wave 3 ended at 118.87 earlier in 2009. The correction from there to 162.60 is wave 4 which itself is a double three and is labeled as first a-b-c ended at 151.53, followed by wave x at 139.03, 2nd a ended at 162.60, 2nd b at 146.75 and 2nd c leg of wave 4 ended at 163.00. Therefore, the decline from 163.00 to 116.85 is now treated as wave 5 which also marked the end of larger degree wave (III), hence wave (IV) major correction has commenced for retracement of the wave (III) from 241.38 and upside target at 183.95-00 (50% Fibonacci retracement of the wave (II) from 241.38) had been met, a drop below 160.00 would suggest wave (IV) has ended at 195.85, bring decline in wave (V) for initial weakness to 130 (already met) and 120.
On the upside, whilst initial recovery to 149.25-30 and possibly 150.00 cannot be ruled out, reckon upside would be limited to 150.25-30 and price should falter below 150.95-00, bring another decline later. Only a daily close above resistance at 151.55-60 would suggest the pullback from 152.85 has ended and revive bullishness for retest of this level first. A break of this level would extend recent upmove from 120.50 low (wave v trough) for subsequent gain to 153.50-60, then 154.00-10, however, sharp move beyond 155.00 should not be repeated, risk from there has increased for a correction to take place later.
Recommendation: Stand aside for this week.
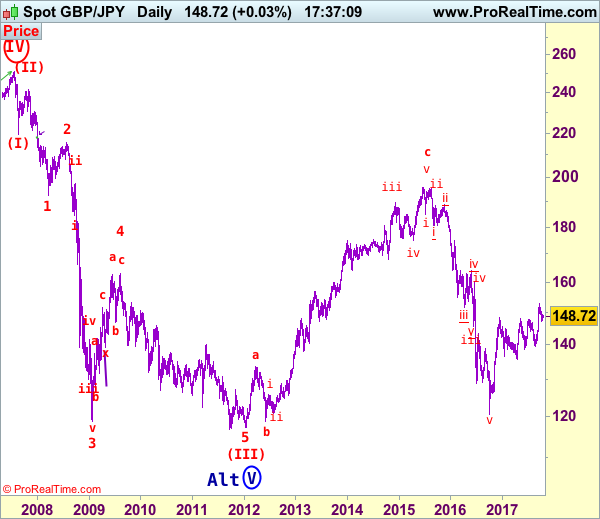
The long-term downtrend from 570.99 (29 Feb 1980) is labeled as an impulsive wave with III with circle ended at 129.77 (20 Apr 1995) and the corrective rebound to 251.12 (20 Jul 2007) is treated as wave IV with circle and the wave V with circle selloff from 251.12 has possibly ended at 116.80 (almost reached our indicated target at 116.00) and major correction has commenced from there and indicated upside target at 183.90-00 (50% Fibonacci retracement of 251.10-116.85) had been met, reckon upside would be limited to 199.80-90 (61.8% Fibonacci retracement) and bring wave (V) decline in later part of 2017.
Technical Outlook: WTI OIL Rallies Back Above $52 After Shallow Correction Overnight
WTI oil returns above $52 handle after dipping to $51.66 in Asia on profit-taking. Monday’s high at $52.35 is eyed for retest with final stretch towards key $52.84 barrier (28 Sep high), seen as likely near-term scenario.
Oil price remains supported by positive fundamentals which were boosted by recent clashes in Iraq, threatening of supply disruption in the region.
Also, positive technical studies are supplementing bullish sentiment in the market and favoring further rise of oil prices.
Firm break above $52.84 would signal extension the bull-leg from $49.09 (part of broader uptrend from 2017 low at $42.04) towards next target at $53.74 (12 Apr high).
Overbought conditions of daily slow stochastic have so far been ignored, but some corrective easing could be anticipated in the near-term.
Rising 20SMA ($51.00) should contain stronger dips.
Res: 52.35, 52.84, 53.18, 53.74
Sup: 51.66, 51.40, 51.00, 50.75
NZD/USD Another False Breakout?
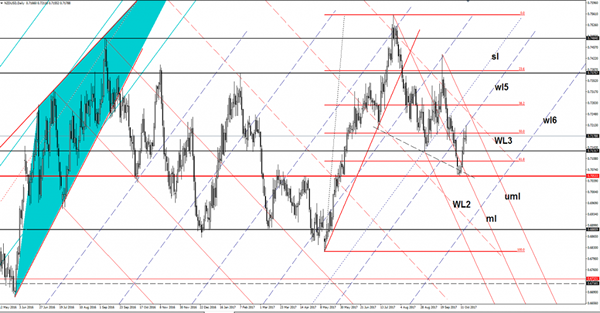
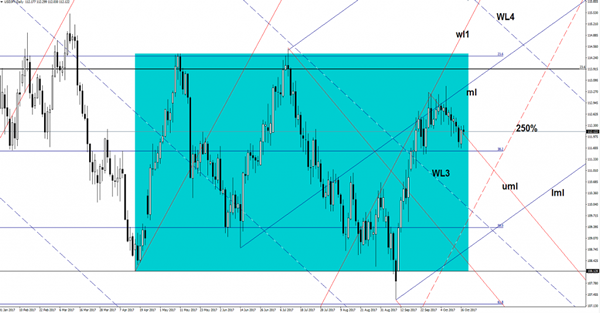
The rate rallied aggressively and retested the fifth warning line (wl5) of the ascending pitchfork, but failed to stay near this level and above the 50% retracement level. Another false breakout above the 50% retracement level will send the rate down again. However, it is still expected to retest the upper median line (uml) of the minor descending pitchfork. A larger increase will come only if the rate will make a valid breakout above the WL3.
AUD/USD In The Buyer’s Territory
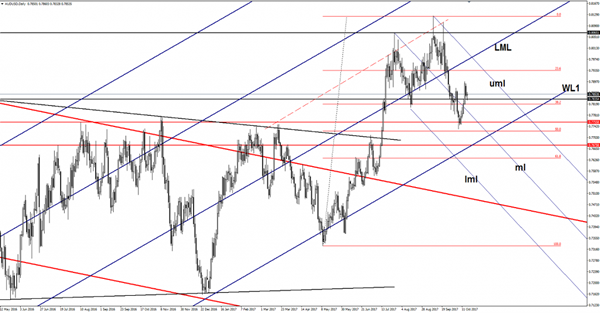
The currency pair increased in the last hours and erased the morning losses. Price is still in the green and could climb much higher as long as stay above the 0.7835 horizontal support (resistance turned into support). The next upside target will be at the upper median line (uml) of the minor descending pitchfork. It could be attracted by the confluence area formed between the 23.6% retracement level with the upper median line (uml) of the minor descending pitchfork.
USD/JPY Lost The Bearish Momentum
The USD/JPY dropped today and retested a broken dynamic support (resistance turned into support). Price increased sharply in the yesterday’s trading session as the Yen was punished by the Nikkei’s further increase. The Japanese stock index has managed to touch fresh new highs in the morning, has climbed as much as 21392 high, but failed to stay there and now is trading below the 21350 yesterday’s high. I’ve said in the last day’s that the JP225 could drop a little after the impressive rally, this situation will send the Yen higher. However, Nikkei’s further increase will force the Yen to depreciate.
The greenback still needs a helping hand from the United States data, the Import Prices may increase by 0.6%, matching the 0.6% growth in the former reading period, the Capacity Utilization Rate could increase from 76.1% to 76.2%, while the Industrial Production is expected to increase by 0.3% in September versus the 0.9% drop in the former reading period.
The USD/JPY has managed to jump above the upper median line (uml) of the minor descending pitchfork after the failure to reach the 38.2% retracement level. A retest of the upper median line (uml) will signal a further increase on the short term. Price is trading near the 112.20 level and it could consolidate on the short term before will recapture enough energy to be able to start a larger increase.
Catalonian Leaders Defends Independence Situation | Theresa May Needs To Break Dead Lock Situation
Geopolitcs sparked more interest for risker assets amid investors
Euro under pressure, Catalonians situation became more confusing
The mighty dollar has moved up the ladder once again on the back of the hopes that the next head of the Fed would be a hawkish person. This is not to say that the current Chairperson of the Fed isn’t moving the monetary policy. Janet Yellen, the current chairwomen of the Fed, has sent a clear message in her last statement that the consumer prices would accelerate after the period of softness fades away.
Remember, that the Fed has already increased the interest rate several times this year and another rate hike is still on the table towards the end of this year. Given that President Donald Trump wants to trigger that massive infrastructure plan, it would be more appropriate to keep the borrowing cost low, and for that to happen, the chairperson of the Federal Reserve Bank should be a dovish person not a hawkish one.
The European markets are trading higher despite the fact that North Korea issued another statement commenting that the nuclear war could trigger anytime. These comments sparked more interest for risker assets amid investors.
The euro currency is facing pressure as the situation with Catalonians has become even more confusing. Investors are watching the next move by the Catalonian president closely and more importantly the reaction to that move by Madrid.
As for sterling, bulls are falling short of steam as it appears that the Brexit negotiations are heading towards the deadlock situation. The Brexit negotiations have stalled for some time, the major worry is that both sides are not moving from their stance, and time is the biggest enemy for them.
This is because both sides have limited time to have a deal or just walk away without any deal. The UK Prime Minister attempted to unlock the talks and payed a visit to Brussels. However, that did not yield any positive outcome. After meeting each other, both sides reiterated their previous stance in their comments.
NZD/USD: NZ Consumer Price Index
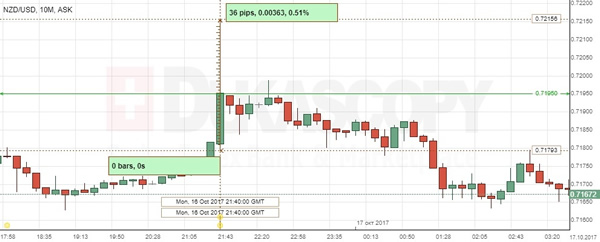
The Kiwi rose slightly against the American peer in a wake of the report showing the better-than-expected CPI growth for New Zealand. The NZD/USD exchange rate fluctuated between the 0.7180 and 0.7220 levels to initially appreciate to the 0.7195 mark further determined as a resistance level.
Statistics New Zealand report showed that the country's consumer inflation grew 0.5% in the September quarter, while the yearly CPI increase was at 1.9% in the reported period, where better growth was driven by food and housing costs. However, the strong figures were unlikely to change the Central Bank's determination to keep its key interest rates unchanged over the years.
EUR/USD: EU Trade Balance
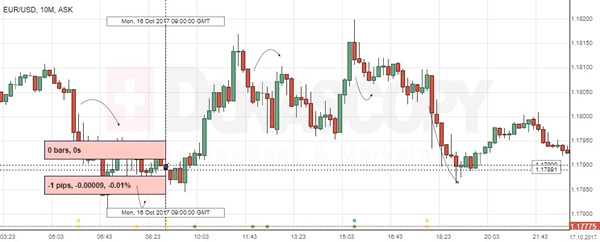
The EU trade balance reports caused a little reaction in the EUR/USD trading session on Monday. The Euro stayed against the US Dollar at the 1.1790 mark, though afterwards the pair accelerated gains amid lingering bullish support for the European single currency with several attempts to get through the 1.1810 area again.
The Eurostat revealed that trade balance in the Euro area recorded a non-seasonally adjusted surplus of €16.1B over the course of August. The release showed a 6.8% yearly increase in exports to €171.5B, while imports grew at a stronger annual pace of 8.6% to €155.4B in the same period. Due to the strong Euro, cheaper imports managed to complicate the ECB intention to raise inflation in the Euro zone.
EURUSD Analysis: Slips Below 200-Hour SMA
As it was expected, the currency pair failed to pass through the 200-hour SMA from the first attempt. However, a combined pressure of the 55- and 100-hour SMAs in conjunction with the weekly PP was too strong to allow the Euro to make any advances against the Dollar. As a result, the new trading session the rate started near the 1780 mark, facing no support barriers on its way up until the weekly S1 at 1.1735. This fact plus the 57% bearish market sentiment and an aggregate of technical indicators, which sends a clear sell signal, suggest that the currency pair is going to continue to move to the bottom, trying to reach the 100% Fibonacci retracement level at 1.1715. But there is a need to take into account an effect from release of the Euro Zone’s inflation data and German business sentiment.