Sample Category Title
GBPUSD Analysis: Prepares For Inflation Release
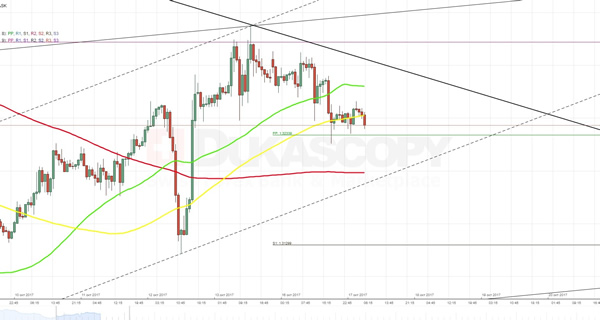
Although the Pound had all means to continue the surge, but confident appreciation of the Dollar prevented the pair from breaking through the monthly PP at 1.3322. On the other hand, this rebound to certain extent confirmed that the pair is trading simultaneously in three different channels. The fact that market sentiment is neutral and an aggregate of technical indicators sends a mixed signal suggests that traders are preparing for release of the UK inflation data as well Governor Carney’s testimony. If experts’ prognoses will match with reality, the rate most probably is going to fall from the junior ascending channel straight to the 200-hour SMA near 1.32. In the opposite case, bulls will have a good chance to make another attempt bypass the above monthly PP.
USDJPY Analysis: Advances By 47 Points
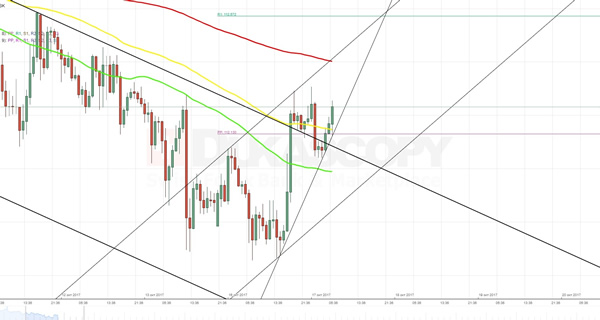
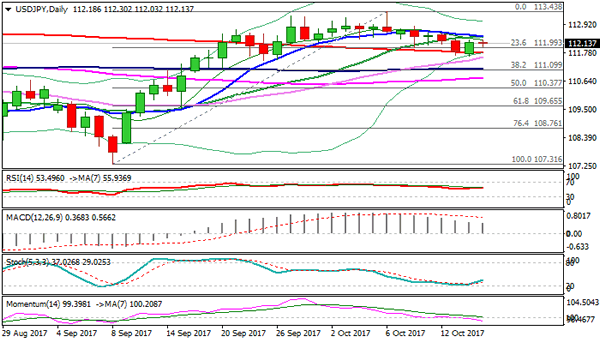
The Dollar edged higher against the Yen, as American officials confirmed their willingness to solve North Korean crisis through diplomatic means. The 47-pip surge pushed the pair out of a descending channel but then it stuck near the 112.14 mark that presented disposition of the 100-hour SMA and the weekly PP. A favourable informational background might strengthen the buck even more. Such scenario seems especially probable amid suspicion of existence of a new minor ascending channel. However, there is a need to take into account that the road upstairs is reliably secured by the 200-hour SMA. In the short run, this barrier is expected to force the pair to back down. But in larger perspective, as long as market sentiment will remain predominantly bullish, it has a chance to break to the top.
XAUUSD Analysis: Breaks From Rising Wedge
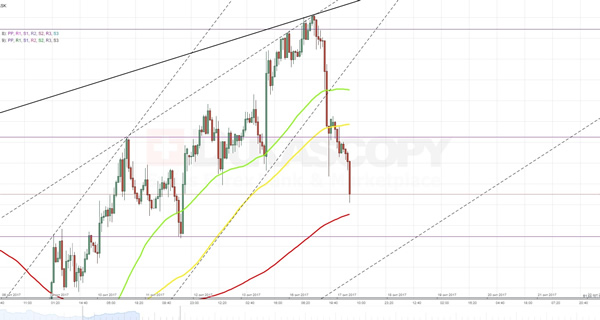
In result of the previous trading session the price of gold decreased by more than 0.86% amid the better than expected New York Manufacturing Index release and lower interest for safe haven assets. From technical point of view, this plunge matched with a breakout from the rising wedge pattern, which formed at the intersection of two ascending channels. The fact that the exchange rate is now located below the 55- and 100-hour SMAs as well as the weekly PP suggests that appreciation of the buck is going to continue at least until the clash with 200-hour SMA near 1,287.05. The bearish scenario looks more plausible also from daily perspective, as it clearly shows how the pair failed to surge above the monthly PP at 1,304.85.
Technical Outlook: USDJPY Back Above 112.00 After Repeated Failure At 200SMA
The pair is trading above 112.00 handle on Tuesday, following bounce on Monday and repeated failure to close below 200SMA (111.77).
The 200SMA marks pivotal support which was dented twice (dips to 111.68 and 111.65) but so far without clear break lower.
Repeated downside failure could hurt near-term bears on sustained break above converged 10/20SMA’s (112.42) which could shift near-term bias higher.
Stronger direction signals could be expected on break of 200SMA of 10/20SMA pivots.
Downside action on sustained break below 200SMA would open 111.33 (daily Kijun-sen) and 111.09/110.90 (100SMA / daily cloud top) in extension.
Conversely, firm break above converged 10/20SMA’s would expose 112.80/113.00 resistance zone initially.
Res: 112.30, 112.42, 112.54, 112.80
Sup: 112.03, 111.76, 111.65, 111.33
Trade Idea: GBP/USD – Hold short entered at 1.3315
GBP/USD – 1.3277
Original strategy :
Sold at 1.3315, Target:1.3115, Stop: 1.3375
Position: - Short at 1.3315
Target: - 1.3115
Stop: - 1.3375
New strategy :
Hold short entered at 1.3315, Target:1.3115, Stop: 1.3315
Position: - Short at 1.3315
Target: - 1.3115
Stop:- 1.3315
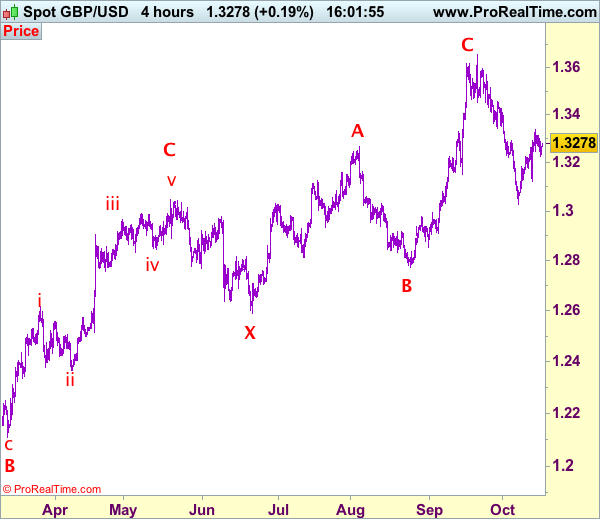
Although cable found support at 1.3225 and has rebounded, as long as indicated resistance at 1.3312-25 holds, mild downside bias remains for another retreat, below 1.3225 would bring weakness to 1.3195-00 but a drop below indicated support at 1.3121 is needed to retain bearishness and signal the rebound from 1.3027 has ended, bring further fall to 1.3065-75, then retest of said support at 1.3027.
In view of this, we are holding on to our short position entered at 1.3315. Above said resistance at 1.3312-15 would risk test of said resistance at 1.3338 (last week’s high), break there would abort and signal low has been formed at 1.3027 instead, bring at least a correction of the fall from 1.3658 top to 1.3390-00 later. Our preferred count is that (pls see the attached chart) the wave IV is unfolding as a complex double three (ABC-X-ABC) correction with 2nd wave B ended at 1.2774, hence 2nd wave C could have ended at 1.3658.
Our preferred count on the daily chart is that cable's rebound from 1.3500 (wave (A) trough) is unfolding as a wave (B) with A ended at 1.7043, followed by triangle wave B and wave C as well as wave (B) has ended at 1.7192, the subsequent selloff is the larger degree wave (C) which is still unfolding with minor wave (III) of larger degree wave 3 ended at 1.1986, hence wave (IV) correction is in progress which could either be a triangle wave (IV) of a complex formation but upside should be limited to 1.3500 and price should falter well below 1.4000, bring another decline in wave (V) of 3 for weakness to 1.1500, then 1.1200.
Trade Idea: GBP/JPY – Stand aside
GBP/JPY - 148.55
New strategy :
Stand aside
Position: -
Target: -
Stop:-
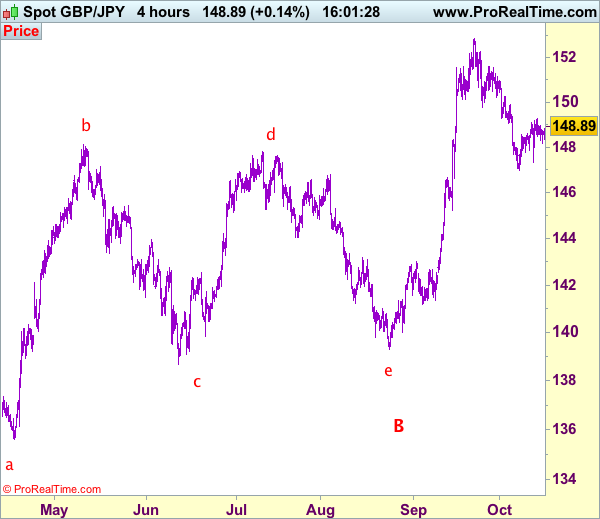
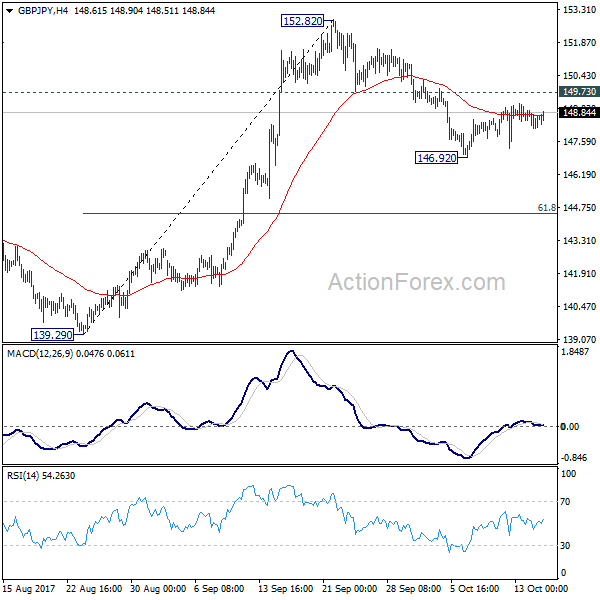
Despite retreating to 148.20, as sterling found support there and has rebounded again, suggesting further consolidation would take place and another bounce to 149.25 cannot be ruled out, above there would extend the rebound from 146.95 for retracement of the fall from 152.85 to 149.90-00 and possibly test of resistance at 150.25 but still reckon upside would be limited to 150.90-00 and bring another decline later.
On the downside, expect pullback to be limited to said support at 148.20 and bring another rebound. Below 147.95-00 would suggest top is possibly formed, bring weakness towards said support at 147.30 but break there is needed to revive bearishness and bring retest of 146.95. Looking ahead, once this level is penetrated, this would confirm the fall from 152.85 top has resumed for retracement of recent upmove to 146.60-65 and then 146.00, having said that, loss of momentum should limit downside and previous support at 145.25 should remain intact.
Our preferred count is that larger degree wave V with circle is unfolding from 251.12 with wave (I) 219.34, (II): 241.38 and wave (III) is subdivided into 1: 192.60, 2: 215.89 (23 Jul 2008) and wave 3 ended at 118.87 earlier in 2009. The correction from there to 162.60 is wave 4 which itself is a double three and is labeled as first a-b-c ended at 151.53, followed by wave x at 139.03, 2nd a ended at 162.60, 2nd b at 146.75 and 2nd c leg of wave 4 ended at 163.00. Therefore, the decline from 163.00 to 116.85 is now treated as wave 5 which also marked the end of larger degree wave (III), hence wave (IV) major correction has commenced for retracement of the wave (III) from 241.38 and upside target at 183.95-00 (50% Fibonacci retracement of the wave (II) from 241.38) had been met, a drop below 160.00 would suggest wave (IV) has ended at 195.85, bring decline in wave (V) for initial weakness to 130 (already met) and 120.
Trade Idea: EUR/JPY – Sell at 132.70
EUR/JPY - 132.03
Original strategy:
Sell at 132.70, Target: 130.95, Stop: 133.30
Position: -
Target: -
Stop: -
New strategy :
Sell at 132.70, Target: 130.95, Stop: 133.30
Position: -
Target: -
Stop:-
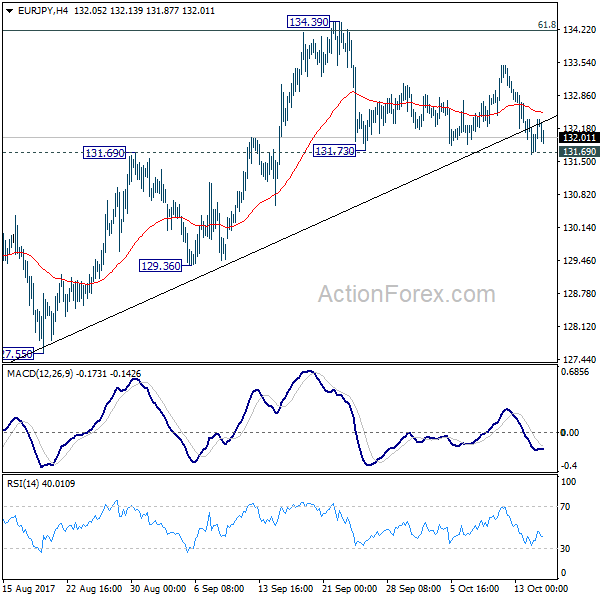
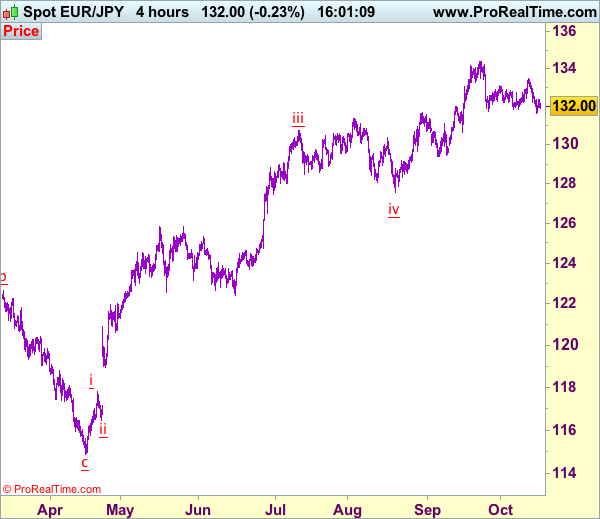
As euro found support at 131.6 yesterday and recovered, suggesting minor consolidation above this level would be seen and another bounce to 132.35-40 cannot be ruled out, however, reckon upside would be limited to 132.70-75 and bring another decline, below said support would add credence to our view that the decline from 134.41 top is still in progress and bearishness remains for this move to bring retracement of recent upmove to 130.95-00 but oversold condition should limit downside to support at 130.62 and reckon psychological support at 130.00 would remain intact.
In view of this, we are looking to reinstate short on recovery as 132.70-75 should limit upside. Only above indicated resistance at 133.50 would abort and risk further gain towards 134.00 but only break there would signal the correction from 134.41 has ended at 131.75, bring retest of this recent high. Once this level is penetrated, this would confirm recent uptrend has resumed and extend headway to 135.00-10 and later 135.50-60.
Our latest preferred count is that wave (ii) is ABC-X-ABC which ended at 123.33 and wave (iii) is unfolding with wave iii ended at 100.77, followed by wave iv at 111.57 and wave v as well as the wave (iii) has ended at 97.04, followed by wave (iv) at 111.43 and wave (v) has ended at 94.12 which is also the end of the larger degree v, this also implied the major wave (C) has also ended there, hence major correction has commenced from there with (A) leg unfolding in its lower degree wave c which has possibly ended at 145.69. Under this count, A-B-C wave (B) has commenced with A leg ended at 136.23, wave B at 143.79 and wave C has possibly ended at 149.79.
Our larger degree count is that the decline from 139.26 is wave (C) and is sub-divided into a diagonal triangle i-ii-iii-iv-v with wave i - 105.44, wave ii- 123.33, wave iii - 97.03, wave iv - 111.43, followed by the final wave v as well as the end of wave (C) at 94.12, this also mark the bottom of larger degree wave B. Under this count, major rise in wave C has commenced as an impulsive wave with minor wave III ended at 145.69, wave V is still in progress for further gain to 150.00. Having said that, this so-called wave V could well be the first leg of larger degree 5-waver wave C and this wave C should bring at least a retest of wave A top at 169.97 (July 2008).
GBP/JPY Daily Outlook
Daily Pivots: (S1) 148.17; (P) 148.57; (R1) 149.03; More
Intraday bias in GBP/JPY remains neutral first. With 149.73 minor resistance intact, deeper decline is still expected. . Below 146.92 will target 61.8% retracement of 139.29 to 152.82 at 144.45. Such decline is seen as a correction and we'd look for strong support from 144.45 to bring rebound. On the upside, break of 149.73 support turned resistance will argue that the pull back is completed and turn bias back to the upside for retesting 152.82 high. However, sustained break of 144.45 will put 139.29 key support in focus.
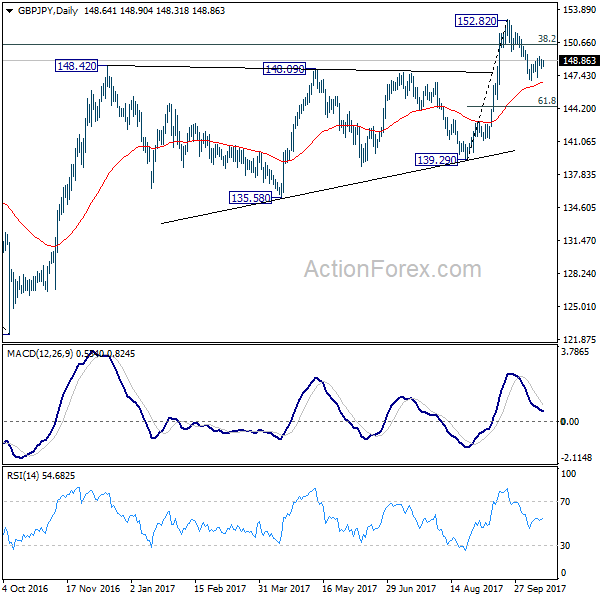
In the bigger picture, medium term rebound from 122.36 is still expected to resume after corrective pull back from 152.82 completes. Firm break of 38.2% retracement of 196.85 to 122.36 at 150.43 will carry long term bullish implications. In that case, GBP/JPY could target 61.8% retracement at 167.78. However, break of 139.29 will indicate rejection from 150.43 key fibonacci level. And the three wave corrective structure of rebound from 122.36 will argue that larger down trend is resuming for a new low below 122.26.
Trade Idea: AUD/USD – Hold short entered at 0.7875
AUD/USD – 0.7861
Original strategy:
Sold at 0.7875, Target: 0.7700, Stop: 0.7935
Position: - Short at 0.7875
Target: - 0.7700
Stop:- 0.7935
New strategy :
Hold short entered at 0.7875, Target: 0.7700, Stop: 0.7900
Position: - Short at 0.7875
Target: - 0.7700
Stop:- 0.7900
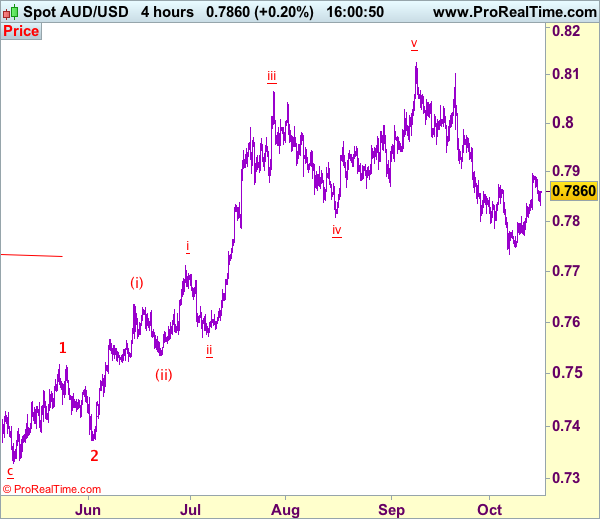
Although aussie rose to as high as 0.7897 late last week, the subsequent retreat from there has retained our bearishness and consolidation with mild downside bias remains for weakness to 0.7800, break there would suggest top is possibly formed, bring test of 0.7770-75, break there would add credence to this view, then retest of said support at 0.7733 would follow, below there would confirm recent fall from 0.8125 top has resumed for weakness to 0.7700-10 and later towards 0.7660-65.
In view of this, we are holding on to our short position entered at 0.7875. Only above previous support at 0.7908 (now resistance) would defer and risk a stronger rebound to 0.7950 but resistance at 0.7986 should remain intact and bring another decline later.
On the 4-hour chart, recent upmove from 0.7329 is unfolding as an impulsive rise with wave 3 as well as smaller degree wave (iii) extending, only minor wave v of (iii) has ended at 0.8125, hence bullishness remains for this move to extend headway to 0.8200, then towards 0.8300, however, reckon upside would be limited to 0.8400 and the final wave 5 should falter below 0.8500, bring correction later.
EUR/JPY Daily Outlook
Daily Pivots: (S1) 131.86; (P) 132.12; (R1) 132.59; More...
Intraday bias in EUR/JPY stays neutral as it's still holding on to 131.69 support. Still, it's getting more likely that 134.39 is a medium term top and a downside breakout could be seen soon. Focus is on 131.69 support. Decisive break there will be an early sign of medium term reversal and will target 127.55 key support level. On the upside, firm break of 134.39 is needed to confirm up trend resumption. Otherwise, more corrective trading would be seen.
In the bigger picture, medium term rise from 109.03 (2016 low) is seen as at the same degree as the down trend from 149.76 (2014 high) to 109.03 (2016 low). 61.8% retracement of 149.76 to 109.03 at 134.20 is already met. Sustained break there will pave the way to key long term resistance zone at 141.04/149.76. However, break of 127.55 support will argue that the medium term trend has reversal and will turn outlook bearish for deeper fall.