Sample Category Title
Dollar Rises As Hawkish Fed Candidate In Favor, Aussie Extends Losses After RBA Minutes
On Tuesday, the dollar drifted higher in Asia on speculations that a hawkish Fed candidate impressed the US President. On the other hand, the Australian dollar dipped into losses after the RBA meeting minutes reiterated concerns on overloaded household debt.
Markets were surprised to hear on late Monday that the Stanford Economist, John Taylor, who was in a lower position on Trump's shortlist of Fed chief candidates made an impression to Trump after an hour-long interview last week in the White House. Taylor is considered as more hawkish than the current Fed chair, Janet Yellen, as his studies on monetary policy suggest that interest rates should be three times higher than they currently are. Still, the former Fed board governor Kevin Warsh remains at the head of the list despite a group of economists criticizing his relative academic credentials.
The dollar gained 0.12% on the day versus its major rivals, with the index climbing to 93.42. Dollar/yen was trading flat around 112.14 during the session, while safe-haven gold fell by 0.32% to $1,290.30 per ounce despite North Korea's deputy UN ambassador warning that a nuclear war “could break out any moment”.
In a two-hour dinner in Brussels on late Monday, the British Prime Minister, Theresa May, and the chief of the European Commission, Jean-Claude Junker, agreed that Brexit talks should “accelerate over the months to come”, giving no details on the issues discussed. Today, the UK negotiator, David Davis and the EU negotiator, Michel Barnier will also join the meeting, three days before the EU summit in Brussels. However, the outcome of the May-Juncker meeting failed to provide support to the pound as the UK government worries that Brexit negotiations will break down unless the EU shows the willingness to move on to trade negotiations. The pound remained flat around five-day lows reached yesterday at $1.3251.
Later on the day, markets will keep a close eye on inflation readings out of the UK and on BOE chief Mark Carney's testimony before the parliament's Treasury select committee.
The euro was down by 0.25% at $1.1765 weighed by political risks in Germany, Austria, and Spain ahead of the CPI figures released during the European trading hours.
According to the RBA October's meeting minutes, the central bank has no intention to raise rates anytime soon as the statement supported that higher rates elsewhere “were a welcome development” but did not have any “mechanical implications” for Australia's rate setting. Moreover, the statement reiterated that household indebtedness continued to attract policymakers' attention as the debt level increased in an “environment of low interest rates and weak income growth”. Concluding, policymakers stated that economic growth is expected to grow gradually over the coming year, supported by the current accommodative monetary policy. Following the minutes, the aussie dropped to a two-day low of $0.7832 before it edged up to $0.7847.
The kiwi managed to touch a two-week high of $0.7204 in the wake of better-than-expected CPI figures released early in the Asian session but fell back to $0.7168 afterwards. The numbers showed that New Zealand's consumer prices jumped by 0.5% q/q in the third quarter after remaining unchanged at 0.0% in the previous quarter, while analysts projected a growth of 0.4%. On a yearly basis, prices rose by 1.9%, above the 1.8% forecasted and 1.7% seen previously.
USD/CHF Candlesticks and Ichimoku Analysis
Weekly
• Last Candlesticks pattern: Shooting star
• Time of formation: 7 Mar 2017
• Trend bias: Sideways
Daily
• Last Candlesticks pattern: Morning star
• Time of formation: 9 May 2017
• Trend bias: Near term up
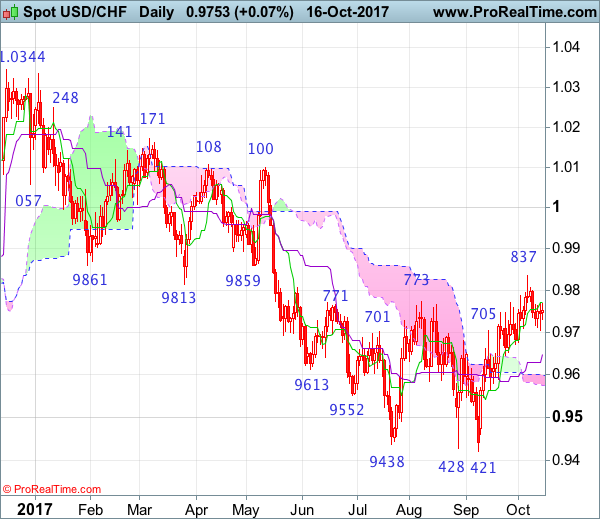
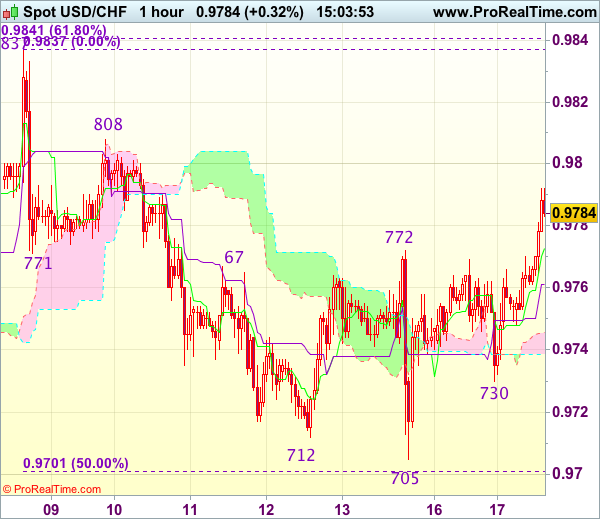
USD/CHF – 0.9784
Although the greenback found support at 0.9705 and has rebounded, break of resistance at 0.9837 (this month’s high) is needed to signal the rise from 0.9421 low has resumed and extend gain to 0.9845-50 (61.8% Fibonacci retracement of 1.0108-0.9421), then 0.9900-10, however, reckon upside would be limited and price should falter below psychological resistance at 1.0000. If said resistance at 0.9837 continues to hold, then further consolidation would take place and another retreat to 0.9705 is likely but downside should be limited to 0.9642 support and bring another rebound later.
On the downside, whilst initial pullback to 0.9705, then minor support at 0.9670 cannot be ruled out, reckon downside would be limited and renewed buying interest should emerge around 0.9650-55 and bring another rise later. A daily close below indicated support at 0.9642 is needed to signal top is formed instead, bring retracement of recent rise to the upper Kumo (now at 0.9600), however, lower Kumo (now at 0.9574) should hold on first testing and price should stay well above support at 0.9565.
Recommendation: Buy at 0.9650 for 0.9850 with stop below 0.9550.
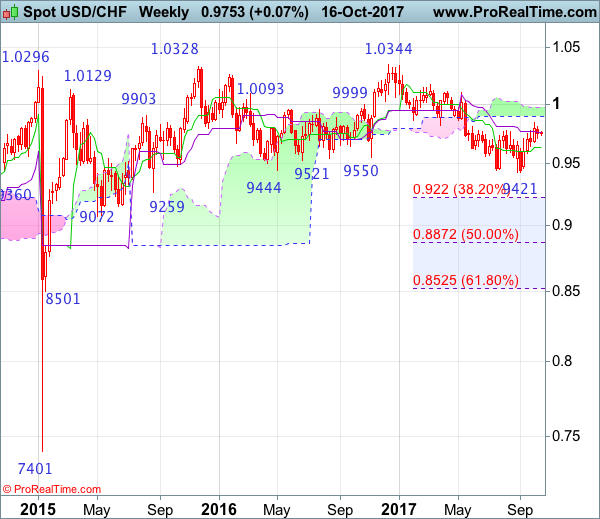
On the weekly chart, the greenback traded in relatively narrow range and further sideways trading is in store, although pullback from 0.9837 may bring pullback to 0.9670, reckon support at 0.9642 would limit downside and bring another rise later, above said resistance at 0.9837 would extend the rebound from 0.9421 low for retracement of recent decline to 0.9845-50 (61.8% Fibonacci retracement of 1.0108-0.9421), then test of the lower Kumo (now at 0.9894) but upside should be limited to the upper Kumo (now at 0.9970), price should falter well below resistance at 1.0100-08.
On the downside, although initial pullback to 0.9705 is likely, reckon support at 0.9642 would limit downside and bring another rise. A drop below the Tenkan-Sen (now at 0.9629) would suggest the first leg of rebound from 0.9421 low has ended, bring weakness to 0.9580 support but still reckon downside would be limited to support at 0.9565 and price should stay above 0.9490-00, bring another rebound later this month. .
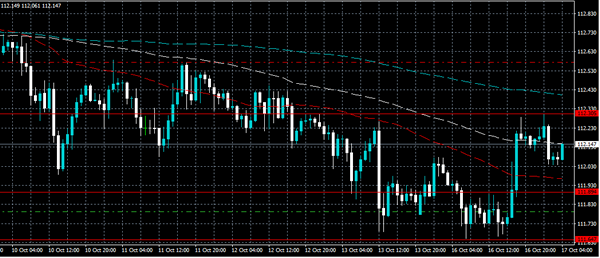
USDJPY Bullish Above 112 Level
The U.S dollar has moved above the 112 level against the Japanese Yen, hitting 112.30 during the Asian session, as the U.S dollar index strengthens across the board. The USDJP pair now awaits the London market open, where traders will watch further buying around the 93 mark in the U.S dollar index.
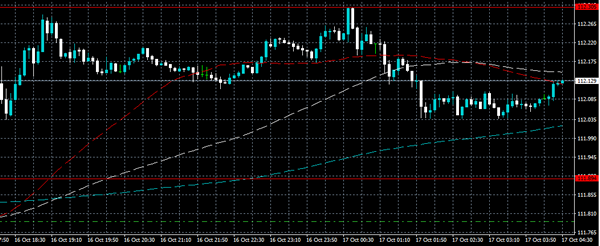
If the USDJPY can hold price-action above the 112 level, further bullish advancement towards the 112.30, 112.57 and 112.90 level can be seen.
Should the USDJPY pair slip below the 112 level, further declines towards 111.89, 111.79, 111.64 and 111.40 can be seen.
GBPUSD Bullish Above Weekly Pivot Point
The GBPUSD pair is trading around the 1.3250 level, after earlier slipped back to test its weekly pivot point, at 1.3233, as Brexit negotiations show no sign of progress between UK and EU officials in Brussels.
The British pound is now awaiting key UK inflation data for September, and a speech from Bank of England Governor Mark Carney.
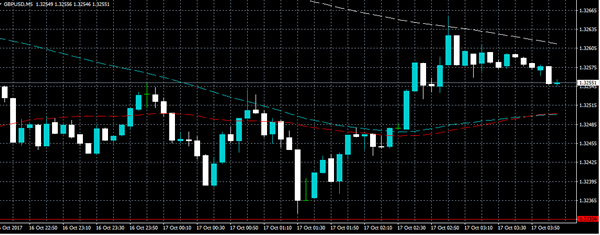
Going forward, the GBPUSD pair is expected to remain bullish while trading above the 1.3233 level. Further buying towards 1.3310, 1.3333 and 1.3362 can be expected while price-action trades above the 1.3233 support level.
Trade should expect a sell-off towards 1.3220, 1.3190 and 1.3170 if price trade below the key 1.3233 technical support level.
Traders Brace For Inflation Tuesday
The global financial markets will be drawn to headline inflation data on Tuesday, with final reports expected from the Eurozone and United Kingdom. A survey of German investor sentiment will also make headlines after a quiet start to the week.
Action begins at 08:00 GMT with a report on Italian trade. The Eurozone’s third-largest economy is expected to show an August trade surplus of €4.23 billion, down from €6.56 billion the month before.
A deluge of British inflation data will make its way through the financial markets at 08:30 GMT, including the retail price index, the producer price index and the consumer price index. Consumer prices are forecast to rise 3% annually in September, while core prices are projected to rise 2.8% over the same period.
Eurostat will produce euro-wide CPI data at 10:00 GMT. Annual CPI in the currency region is forecast to rise 1.5%. Core inflation is projected to come in at 1.1%, according to estimates.
About an hour earlier, the ZEW Institute will release its economic sentiment index for German and Eurozone investors. Confidence among investors is expected to rise in both jurisdictions.
Three central bankers will also deliver speeches on Tuesday, beginning at 08:00 GMT with Vitor Constancio, the Vice President of the European Central Bank (ECB). The ECB’s Peter Praet, who has served on the Executive Board since 2011, will also deliver a speech at 09:30 GMT.
Finally, Bank of England (BOE) Governor Mark Carney will deliver remarks at 10:15 GMT.
EUR/USD
Europe’s common currency resumed its descent on Monday, falling back below 1.1800 US. The EUR/USD could receive a boost from Eurozone data on Tuesday. An upward correction depends largely on the pair’s ability to reclaim the 1.1810 level. This would spark a rally back toward the mid-1.18 region.

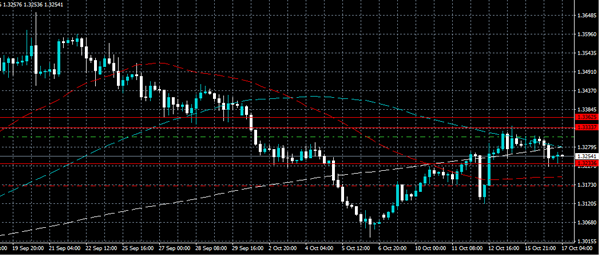
GBP/USD
The British pound steadied on Monday, trading in the mid-1.32 region against the dollar. Cable has been stuck in a 100-pip range between 1.3250 and 1.3350 for the past week, as investors await fresh details concerning Brexit and the BOE. Rangebound is the name of the game for now. With neither the pound nor the greenback showing signs of pulling ahead.
USD/JPY
The dollar is off to a solid start against the yen this week, with the USD/JPY climbing back above 112.00 on Monday. The pair continues to hold that critical line, although upside momentum appears to be limited at time of writing. Looking at the rest of the week, the yen may carry favour with investors ahead of Japanese general election on 22 October. Prime Minister Shinzo Abe is expected to deliver a solid performance in his bid for re-election. For investors, this likely means the continuation of ultra-loose monetary policy.

Trade Idea : USD/CHF – Stand aside
USD/CHF - 0.9780
Most recent candlesticks pattern : N/A
Trend : Near term down
Tenkan-Sen level : 0.9773
Kijun-Sen level : 0.9761
Ichimoku cloud top : 0.9746
Ichimoku cloud bottom : 0.9739
Original strategy :
Sold at 0.9755, stopped at 0.9775
Position : - Short at 0.9755
Target : -
Stop : - 0.9775
New strategy :
Stand aside
Position : -
Target : -
Stop : -
The greenback found renewed buying interest at 0.9730 and has staged another rebound, current break of resistance at 0.9772 suggests low has possibly been formed at 0.9705 last week and consolidation with mild upside bias is seen for gain to 0.9808 resistance but break there is needed to signal the fall from 0.9837 has ended instead, bring retest of this level which is likely to hold from here.
In view of this, would not chase this rise here and would be prudent to stand aside in the meantime. Below 0.9750 would bring test of said support at 0.9730 but break there is needed to signal the rebound from 0.9705 has ended, bring retest of this level. Once this support is penetrated, this would revive bearishness and extend the fall from 0.9837 to 0.9669-70 (61.8% Fibonacci retracement of 0.9565-0.9837 and previous support) but previous support at 0.9642 should remain intact.
Record Highs Are No Longer Justified
'Since Election Day on 8 November, the stock market is up more than 25%, unemployment is at a 17-year low andcompanies are coming back to the U.S.”Donald Trump
Indeed, the Dow Jones Industrial Average and the S&P 500 rose by more than 25% and 20%, respectively, since 8 November. President Trump gives credit to himself and no one can blame him, because fundamental data cannot justify current levels.
All three major U.S. indices reached new record highs yesterday, but investors have got used to this, and record highs are no longer making headlines. For those who have been waiting for a correction to buy the dips, they have missed the opportunity. The threat of nuclear war, expectations of higher interest rates, hurricanes and terrorist attacks all failed to pull markets from record levels.
Equity strategists have been forced to adjust their year-end target higher for U.S. indices, although little justification is provided. Valuations are becoming incredibly overstretched, yet investors do not seem to worry.
Forward 12-month P/E ratio on the S&P 500 rose above 18 this week, for the first time since mid-2002. Although multiples remain below the forward peak P/E ratio of 24.4 tested during the dot.com bubble, it’s still much higher than 10-year or 20-year averages of 14.1 and 16. This means investors are paying more, for less.
It looks to melike speculation and greed are driving the current bull market, which could be an indication of the latest stages of an uptrending market. However, it is not a wise decision to sell uptrend markets; speculation might continue to drive stocks higher, especially if earnings surprise to the upside.
Nobody knows when or what will trigger a sharp correction or a bear market. Timing the market is an almost impossible mission. However, for investors who would like to remain invested in the current bull market, it would be a good idea to buy protection. CBOE’s Volatility Index (VIX) is currently trading below 10 (-29.5% YTD), which means options prices are relatively cheap. The downside to buying a put option is that it expires and the investor loses the premium paid;but, given that things look a little crazy, the reward of buying put options is higher than the risk involved.
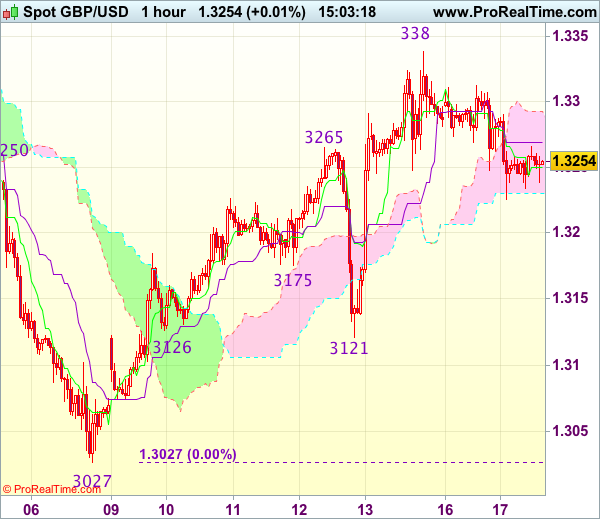
Trade Idea : GBP/USD – Stand aside
GBP/USD - 1.3261
Most recent candlesticks pattern : N/A
Trend : Near term up
Tenkan-Sen level : 1.3252
Kijun-Sen level : 1.3269
Ichimoku cloud top : 1.3292
Ichimoku cloud bottom : 1.3230
Original strategy :
Bought at 1.3250, stopped at 1.3245
Position : - Long at 1.3250
Target : -
Stop : - 1.3245
New strategy :
Stand aside
Position : -
Target : -
Stop : -
Although the British pound recovered after falling to 1.3225 overnight and consolidation with initial upside bias is seen, break of resistance at 1.3312 is needed to revive bullishness and signal the pullback from 1.3338 (last week’s high) has ended, bring retest of this resistance, break there would signal the rise from 1.3027 low has resumed for a stronger retracement of recent decline towards 1.3375-80 (61.8% Fibonacci retracement of 1.3596-1.3027), however, overbought condition should limit upside to 1.3400-10.
On the downside, below 1.3225 would bring further fall to 1.3200 and possibly towards 1.3170-75 but only break of indicated support at 1.3121 would shift risk back to downside and signal the aforesaid rise from 1.3027 has ended, then further fall to 1.3090-00 would follow. As near term outlook is mixed, would be prudent to stand aside for now.
Gold Price Is Back In Uptrend Above $1285 Vs US Dollar
Key Highlights
- Gold price after forming a bottom near $1260 against the US Dollar started an upside move.
- There was a break above a key bearish trend line with resistance at $1284 on the 4-hours chart of XAU/USD.
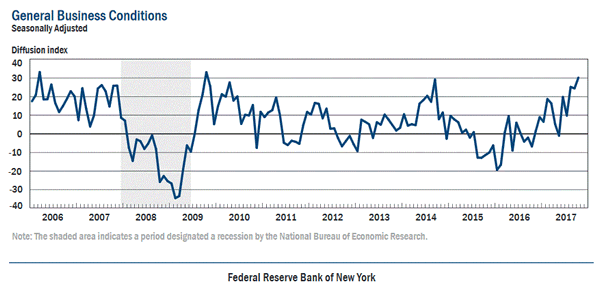
- Recently in the US, the NY Empire State Manufacturing Index posted a rise from 24.4 to 30.2 in Oct 2017.
- Today, the US Industrial Production for Sep 2017 will be released, which is forecasted to increase by 0.2% (MoM).
Gold Price Technical Analysis
Gold price formed a bottom earlier this month at $1260 against the US Dollar. The price is trading in the bullish zone and placed well above the $1285 and $1292 support levels.
Looking at the 4-hours chart of XAU/USD, there was a break above a key bearish trend line with resistance at $1284. Buyers also succeeded in clearing the 100 simple moving average (4-hour, red) at $1285, which is a strong bullish signal.
However, the price recently failed near $1308 and the 200 SMA (4-hour, green). Above the 200 SMA, the next major resistance is around the 50% Fib retracement level of the last decline from the $1357 high to $1260 low. A successful close above $1308 will most likely push the price towards $1320 in the near term.
On the downside, the $1285 level remains a crucial support for buyers along with the 100 SMA.
NY Empire State Manufacturing Index
Recently in the US, the NY Empire State Manufacturing Index for Oct 2017 was released by the Federal Reserve Bank of New York. The forecast was lined up for a decline from the last reading of 24.4 to 20.7.
The actual result was positive as the NY Empire State Manufacturing Index jumped to 30.2, which is the highest level in three years. Looking, at the shipments index, there was a sharp rise of 11 points to 27.5, and the new orders index came in at 18.0.
The report added:
The index for number of employees rose five points to 15.6, suggesting that employment expanded more strongly this month, while the average workweek index registered zero, indicating that the average workweek held steady.
Overall, the result was way above the market expectations and pushed Gold price from $1304 to $1295. Having said that, it seems like the price might continue to gain momentum as long as it stays above $1285.
Economic Releases to Watch Today
- UK Retail Price Index Sep 2017 (YoY) – Forecast +4.0%, versus +3.9% previous.
- UK Producer Price Index Sep 2017 (YoY) – Forecast +3.3%, versus +3.4% previous.
- UK Producer Price Index Sep 2017 (MoM) – Forecast +0.3%, versus +0.4% previous.
- UK Consumer Price Index Sep 2017 (YoY) – Forecast +3.0%, versus +2.9% previous.
- UK Core Consumer Price Index Sep 2017 (YoY) – Forecast +2.8%, versus +2.7% previous.
- Euro Zone CPI for Sep 2017 (YoY) – Forecast +1.5%, versus +1.5% previous.
- Euro Zone CPI for Sep 2017 (MoM) – Forecast +0.4%, versus +0.3% previous.
- Euro Zone Core CPI for Sep 2017 (YoY) – Forecast +1.1%, versus +1.1% previous.
- US Industrial Production Sep 2017 (MoM) – Forecast +0.2%, versus -0.9% previous.
- US Capacity Utilization Sep 2017 – Forecast 76.2%, versus 76.1% previous.
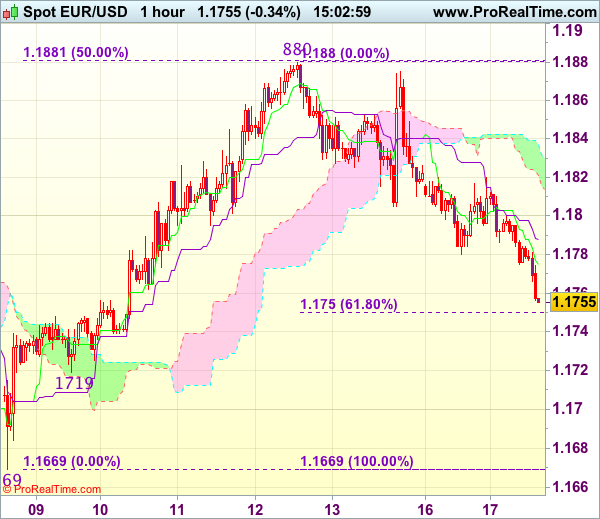
Trade Idea : EUR/USD – Sell at 1.1800
EUR/USD - 1.1765
Most recent candlesticks pattern : N/A
Trend : Near term up
Tenkan-Sen level : 1.1775
Kijun-Sen level : 1.1788
Ichimoku cloud top : 1.1837
Ichimoku cloud bottom : 1.1821
New strategy :
Sell at 1.1800, Target: 1.1700, Stop: 1.1835
Position : -
Target : -
Stop : -
As the single currency has fallen again after brief bounce to 1.1820 yesterday, suggesting top has possibly been formed at 1.1880 and the fall from there may extend weakness to 1.1750 (61.8% Fibonacci retracement of 1.1669-1.1880), break there would add credence to this view and bring test of support at 1.1719 but break there is needed to signal the rebound from 1.1669 has ended, then further decline to 1.1700 would follow.
In view of this, we are looking to sell euro on recovery as 1.1800 should limit upside. Above 1.1820 would suggest low is formed instead, bring a stronger rebound to 1.1845-50 but price should falter below said resistance at 1.1880, bring another retreat later.