
Sample Category Title
Currencies: Dollar Gets The Benefit Of The Doubt, For Now.
Sunrise Market Commentary
- Rates: More outperformance German Bund?
Today's eco calendar contains German ZEW investor sentiment and US industrial production. Risks are on the downside of expectations. Central bank speakers are a wildcard, especially at the ECB side with the rapidly approaching October 26 ECB-meeting in mind. The Bund's outperformance vs the US Note future is expected to last. - Currencies: Dollar gets the benefit of the doubt, for now.
The dollar was supported by a rising interest rate differential yesterday following speculation about the next Fed chair (Taylor). Today's eco data probably won't change the overall picture for the dollar or the euro. Event risk is omnipresent. A negative event might weigh on USD/JPY. The Catalan deadline might inspire some investor caution on the euro.
The Sunrise Headlines
- All three major US indices held on to their gains (+0.3%) and closed at record levels. Netflix Q3 earnings were strong. Overnight risk sentiment remains positive with most Asian indices posting similar gains.
- Theresa May is backing away from a Brussels showdown over Brexit this week after Angela Merkel warned her that the EU would not start discussing a transition deal with Britain until she put more money on the table.
- The Reserve Bank of Australia has warned that any further increases in the currency would hurt growth while again flagging ongoing resistance to joining peer central banks in normalising interest rates.
- New Zealand inflation accelerated more than economists expected in the third quarter (0.5% Q/Q & 1.9% Y/Y), fanned by more expensive food and housing costs, while underlying price pressures remained benign.
- Brent traded near a two-week high as Kurdish authorities halted oil output at two deposits amid clashes with Iraqi forces near Kirkuk. Iraq took control of government buildings, oil fields, a refinery and a military base. The US isn't happy but isn't taking sides, Trump said.
- European foreign ministers attacked President Trump's decision to pull his administration's backing for the Iranian nuclear agreement, calling the move a serious mistake that could lead to a military confrontation with Tehran.
- Today's eco calendar contains German ZEW investor sentiment, UK inflation data and US industrial production. Several central bankers speak, Germany taps the market and Q3 earnings season accelerates
Currencies: Dollar Gets The Benefit Of The Doubt, For Now.
USD gets benefit of the doubt, for now.
The dollar held up well yesterday despite Friday's ‘soft' US CPI data. Catalan uncertainty weighed on Spanish assets, but the impact on other European markets, including the euro, was limited. The dollar profited slightly from a very strong Empire manufacturing survey. Later in US dealing, USD yields and the dollar jumped higher on headlines that economist John Taylor made a good impression on President Trump in a meeting last week. EUR/USD closed the session at 1.1796. This time, the gain of USD/JPY was more substantial. The pair finished the day at 112.19 (from 111.89).
Overnight, Asian equities continue their established uptrend as major WS indices closed again at record levels yesterday evening. Headlines on all kinds of political event risk are omnipresent (North Korea again warned on a nuclear war, tensions in the Nafta negotiations between the US and Mexico, the dispute in Northern Iraq, Catalonia, Brexit), but they don't derail the global equity rally. USD/JPY trades in the 112.10/15 area. So, the pair fails to extend the gains after yesterday's ‘Taylor headlines'. EUR/USD is trading marginally lower in the 1.1770 area.
Today, the ZEW investors sentiment in Germany and EMU CPI (final) will be published in Europe. In the US, import prices, industrial production and the NAHB Housing index will be published. EMU CPI data are expected unchanged from the preliminary reading. ZEW confidence is expect to rise further. The current conditions index might near record levels. Even so, the report is usually only of intraday significance for FX trading, at best. US import prices are expected to rise 0.6% M/M and 2.6% Y/Y (from 2.1%). Industrial production is expected to rebound modestly (0.3% M/M) after a setback in August. The NAHB housing index is expected stable at 64. We don't expect today's US data to really change fortunes for the dollar. A bigger than expected rise in import prices might be marginally USD supportive. On the other hand we keep an eye at the housing data. Of late some indicators suggested a potential loss of momentum in the sector
Yesterday, the dollar made marginally progress against the euro and the yen supported by a rising interest rate differential and by speculation that the chances of John Taylor are rising to become Fed chairman. For now, the latter it is nothing more than speculation and rumours.
Today's data probably won't give clear guidance for USD trading. Political event risk remains plentiful (cf supra). These risks had only a very limited impact on markets and in particular on the FX markets until now. We assume that a flaring up of one of these uncertainties is a potential negative for USD/JPY. Catalonia might create some uncertainty on European markets and for the euro as the next political deadline (Thursday) nears. Yesterday, we started the week with a neutral-to-tentatively negative bias for EUR/USD. We maintain this call. Even after yesterday's ‘Taylor-driven rebound', we are not convinced on the USD/JPY performance.
From a technical point of view, EUR/USD dropped below the 1.1823/ 1.2070 consolidation pattern, but no real test of the 1.1662 support occurred. Last week, the pair even returned (temporary?) above the 1.1823 previous range bottom, which was disappointing for EUR/USD bears. We maintain a cautious sell-on upticks bias. However, the pair needs to drop below 1.1670/62 support to really give comfort to EUR/USD bears. The USD/JPY momentum was constructive in September. The pair regained 110.67/95 (previous resistance), a short-term positive. The 114.49 correction top is the next important resistance. The rally clearly lost momentum last week. A break beyond 114.49 looks ever more difficult.
EUR/USD: resumes gradual decline, but no important technical level within reach
EUR/GBP
Focus turns to price data and to the BoE
The focus for sterling trading remained on Brexit yesterday. UK PM May went to Brussels and met EU commission president Juncker and EU Chief Brexit negotiator Barnier. Sterling initially gained a few tics on the announcement of the Brussels' trip, hoping on a positive outcome. However, this hope was torpedoed by comments from ‘sources close to the UK government'. According to these rumours, Brexit negotiations were heading for a catastrophic breakdown unless the EU signalled it would allow to move to talks on trade and the transition period. The statement after the dinner didn't bring any concrete news, but talks were said to have been constructive. The impact on sterling was very limited. EUR/GBP finished the session at 0.8901. Cable closed at 1.3251, but this was partially due to USD strength.
Sterling is trading with a slightly positive bias this morning after yesterday's meeting between UK PM May and EU Commission president Juncker. Brexit will remain on the radar, but the focus might temporary turn to the UK eco data. UK price data will be published today. Headline inflation is expected to rise to 3.0%. This might reinforce the case for a BoE rate hike in the coming months. BoE's Carney, Ramsden and Tenreyro will also appear before the UK Parliament's Treasury committee. The tone of the appearance/assessment might be balanced even if the BoE considers a modest tightening of policy in the near future. Even so, today's events might be slight supportive for sterling in a daily perspective
EUR/GBP staged a strong uptrend since April to set a top at 0.9307 late August. UK price data and hawkish BoE comments reinforced a sterling rebound. Medium term, we maintain a EUR/GBP buy-on-dips approach as we expect the mix of euro strength and sterling softness to persist. The prospect of (limited) withdrawal of BoE stimulus triggered a good sterling countermove, but this rebound has run its course. EUR/GBP supports at 0.8743 and 0.8652 are difficult to break. We look to buy EUR/GBP on dips. The recent rebound above 0.89 improved the ST technical picture of EUR/GBP, but for now there were no convincing follow-through gains. EUR/GBP 0.9026 is the 50% retracement of the recent countermove.
EUR/GBP rebound loses momentum. CPI data might temporary support sterling
Daily Wave Analysis: EUR/USD Builds ABC Zigzag In Expanded Wave 4
Currency pair EUR/USD
The EUR/USD has made a bearish bounce away from the resistance trend line (orange) which therefore makes a bullish ABC (purple) zigzag within a wave X (pink) correction more likely in an ongoing and extended wave 4 (light purple).
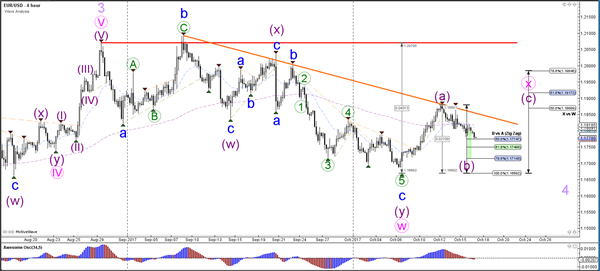
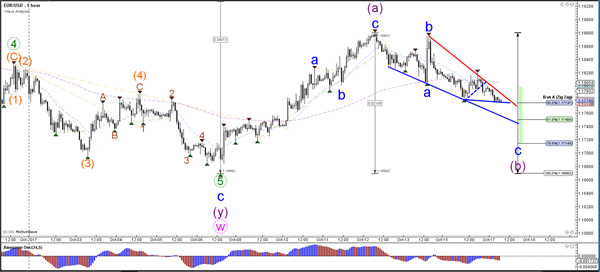
The EUR/USD is building an ABC (blue) correction within the larger wave B (purple). The Fibonacci levels could act as support levels for a bullish bounce but a break below the 100% Fib would invalidate that.
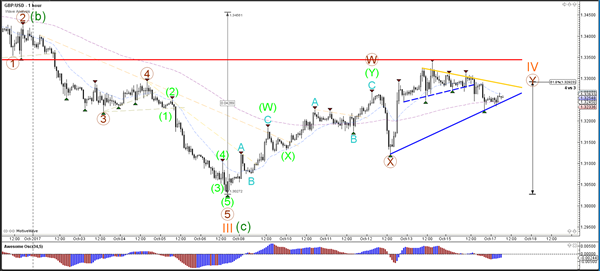
Currency pair GBP/USD
The GBP/USD offers two main scenarios where either a bearish ABC (green) or a wave 123 (green) is taking place. Price invalidates that wave 4 (orange) correction if price breaks above the bottom of wave 1 (red line).
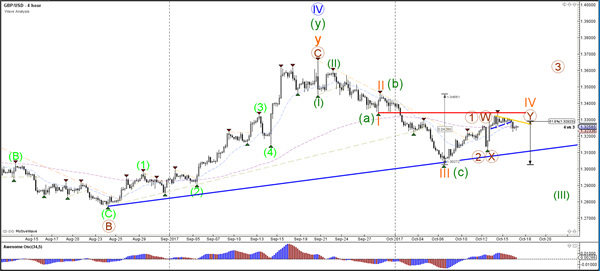
The GBP/USD is building a triangle pattern (orange/blue lines). A bearish break could confirm the completion of wave 4 (orange) whereas a bullish break could invalidate it.
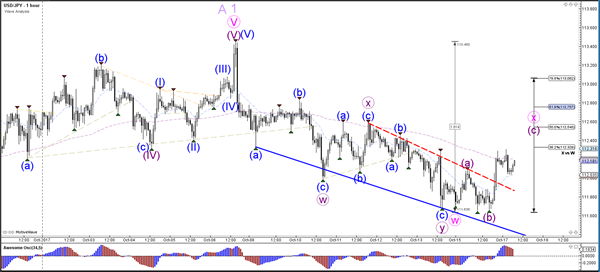
Currency pair USD/JPY
The USD/JPY could be building a larger WXY (pink) correction within wave 2 or B (purple).
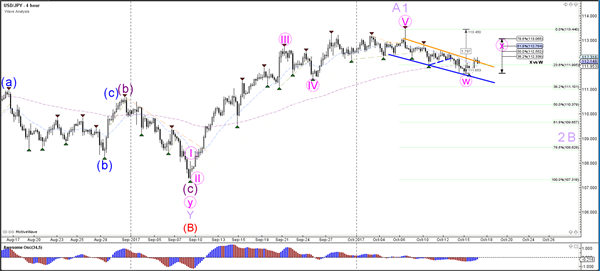
The USD/JPY bullish break above the bearish channel (dotted red line) could be part of a bullish wave X (pink) correction.
Bank Of England Governor Mark Carney
Market movers today
In the euro area, we are due to get the final HICP figures for September. We do not expect any changes from the preliminary release with regard to headline and core inflation, which reported a decline to 1.1% y/y. However, it will be interesting to see which components caused the fall in service price inflation and whether they point towards any sustained upwards or downwards trend in core inflation, which will be important for ECB policy normalisation going forward.
In the UK, we are due to get the CPI inflation print for September but the release should not alter the Bank of England's members' views on the economy significantly and hence we still expect a 25bp Bank Rate hike next month.
Bank of England Governor Mark Carney, Deputy Governor Sir David Ramsden and MPC member Silvana Tenreyro are due to testify before the UK's Treasury today. We will look for any hints on whether they have changed their mind on a November hike.
In the US, we expect that the relatively muted growth in industrial production continued in September although the recent hurricanes increase uncertainty around the release.
We will also have the ECB's Vitor Constancio speaking at a conference in Lisbon and German ZEW expectations for October are due to be released.
Selected market news
Yesterday, in US fixed income markets, yields climbed slightly higher after the Fed's Janet Yellen reiterated over the weekend that 'my best guess is that these soft (inflation) readings will not persist', which supports our view that the Fed will hike in December despite another lowerthan- expected US CPI inflation print published on Friday last week (see FOMC minutes, 11 October 2017). The main argument is still that strong growth will tighten the labour market further, which will eventually push wage growth higher and hence inflation. The bearish sentiments in US fixed income markets were also supported by a strong US Empire manufacturing PMI release, which rose to 30.2 in October from 24.4 in September. This is the highest level since 2014.
According to Bloomberg, John B. Taylor (professor at Stanford University), a candidate for Fed chairman, was said to have impressed President Trump in an interview last week.
In EUR fixed income markets, the week started where last week ended, with yields edging lower awaiting next week's ECB monetary policy meeting.
Yesterday, we saw a sharp rally in copper prices with three-month LME copper breaking firmly above the USD7,000/MT level. Brent oil traded close to this month's high, currently around USD57.8 per barrel. Tensions around the Kurdish region in Iraq have spurred concerns in the market that supplies from that region may be disrupted.
(RBA) Minutes of the Monetary Policy Meeting of the Reserve Bank Board
Sydney – 3 October 2017
Members Present
Philip Lowe (Governor and Chair), Guy Debelle (Deputy Governor), Kathryn Fagg, John Fraser (Secretary to the Treasury), Ian Harper, Allan Moss AO, Carol Schwartz AM, Catherine Tanna
Members granted leave of absence to Mark Barnaba AM in terms of section 18A of the Reserve Bank Act 1959.
Others Present
Michele Bullock (Assistant Governor, Financial System), Luci Ellis (Assistant Governor, Economic), Christopher Kent (Assistant Governor, Financial Markets), Alexandra Heath (Head, Economic Analysis Department), Jonathan Kearns (Head, Financial Stability Department)
Anthony Dickman (Secretary), Andrea Brischetto (Deputy Secretary)
Domestic Economic Conditions
Members commenced their discussion by noting that the Australian economy had grown by 0.8 per cent in the June quarter, in line with the Bank's forecast. Growth in consumption and the contribution from net exports had been higher than in the March quarter, partly reflecting the unwinding of temporary factors. Members noted that the effect of the decline in mining investment had mostly passed and, with resource exports increasing, recently the mining sector had been contributing to overall growth. Growth in public demand and non-mining business investment had picked up and private sector investment intentions for 2017/18, as recorded in the June quarter ABS capital expenditure survey, had been revised higher.
There had been a pick-up in household consumption growth in the June quarter despite ongoing weakness in household disposable income growth. Members noted that consumption growth had increased in most states, although it had remained noticeably weaker in Western Australia than in the eastern states, consistent with weaker income growth in that state. Recent strong growth in employment across all the states was expected to support income growth, and therefore consumption growth, in the period ahead.
Both full-time and part-time employment had recorded solid growth in August. Members noted that this growth had been well above that required to absorb increases in the labour force owing to population growth. Since early 2017, employment growth had been above trend, the unemployment rate and other measures of labour underutilisation had declined a little (although the unemployment rate had remained steady at 5.6 per cent in recent months) and labour force participation had increased, particularly for older workers and prime-aged (25–54 year old) females. By industry, employment growth over the preceding year had been strongest in the household services sector, particularly health care and education, and had picked up notably in the construction sector. Forward-looking indicators of labour demand, including data on job advertisements, vacancies and hiring intentions, continued to point to slightly above-average growth in employment over the remainder of 2017.
Members observed that residential construction appeared to have plateaued, with dwelling investment largely unchanged in the June quarter. The pipeline of work already approved or under way was expected to continue supporting dwelling investment around current levels over the subsequent year or so; the peak of apartment completions was expected to occur during this period. At the current level of dwelling investment, growth of the housing stock was expected to outstrip that of the population, as it had done in the preceding few years.
Established housing market conditions had continued to ease in Sydney and Melbourne, but had been broadly unchanged in other cities. This pattern was evident in revised housing price data released by CoreLogic in September, as well as in auction clearance rates. Housing prices had continued to decline gradually in Perth. Nationwide measures of housing prices had increased by around 9 per cent over the year to September.
Members noted that the national accounts indicated that private non-mining business investment had increased in the June quarter to be almost 10 per cent higher than at the start of 2016, following an upward revision to non-residential construction in the March quarter. Mining investment had declined a little in the June quarter. The outlook for non-mining business investment remained positive; firms' estimates of future capital spending had increased, non-mining sector profits had picked up over the preceding year and survey measures of capacity utilisation were well above average. Members noted that business conditions, as reported in surveys, had picked up in most states, although they remained subdued in Western Australia.
Public demand had picked up in the June quarter. Public consumption had increased solidly and new public investment had risen very strongly across most states. This recent strength had been supported by a number of large infrastructure projects, especially related to the construction of roads and railways. Given the large pipeline of public infrastructure work that had been announced or was under way, public investment was expected to continue supporting economic activity over the next couple of years. Members noted that some of this work would be undertaken by the private sector on behalf of the public sector. There had been liaison reports that this had led to some increase in private sector investment in machinery and equipment.
Export volumes had rebounded strongly in the June quarter. Members noted that the increase in resource export volumes had been pronounced, driven by the ongoing ramp-up in liquefied natural gas production. The terms of trade had declined in the June quarter, reflecting lower bulk commodity prices. The terms of trade were likely to have been relatively steady in the September quarter, as the recent falls in iron ore prices had occurred late in the quarter. These falls were largely related to weaker-than-expected data on Chinese industrial production and investment and expectations of cuts to Chinese steel production. Bulk commodity prices had been higher than expected over the preceding year. Members noted that some mining companies had used higher prices to pay down debt and that there had been reports of plans to increase capital investment to sustain the output of existing resource projects.
Recent data had pointed to subdued price pressures across the economy in the June quarter. Retail electricity prices were expected to increase significantly in the September quarter and liaison with businesses had suggested that a number of firms, particularly in the retail and manufacturing sectors, were largely absorbing increases in energy costs into margins rather than passing them through to final prices.
International Economic Conditions
Members noted that indicators of global economic conditions had remained consistent with growth continuing around recent rates. Indicators of industrial production had picked up in many of Australia's trading partners since 2016, which had contributed to a rise in investment growth and investment intentions in many of these economies. Members noted that growth in exports of electronics and conditions in the electronics-manufacturing sector had increased significantly. This had been particularly stimulatory for the high-income Asian economies. Labour markets had continued to tighten in the major advanced economies, but nominal wage growth had remained low. Headline inflation had increased modestly over the previous month, in line with an increase in oil prices, but core inflation had remained subdued and had even declined lately in the United States.
In China, growth in output appeared to have moderated a little in recent months following stronger-than-expected growth in the first half of 2017. Growth in industrial production and fixed asset investment had eased a little in recent months, while growth in consumption had been relatively resilient. Property price inflation in China had continued to moderate, but a range of other indicators of activity in the housing sector had been more resilient than expected.
GDP growth in the major advanced economies had increased over the preceding year, driven by continued strong growth in consumption and, in some cases, investment. Members noted that this had been accompanied by a further tightening in labour markets. In the United States and Japan, unemployment rates had been at multi-decade lows and were below most estimates of full employment. The euro area unemployment rate had declined to its lowest rate in eight years, although there was significant variation across member economies. Nominal wage growth and core inflation had remained low. Inflation in the major advanced economies was expected to increase towards central banks' targets over the next few years, as the lack of spare capacity started to put upward pressure on wages and prices.
Financial Markets
Members commenced their discussion of financial market developments by noting that long-term government bond yields had generally increased over the previous month. The increase has been partly in response to higher-than-expected, although still modest, headline inflation data and further announcements by central banks relating to the gradual reduction of monetary policy stimulus. Nevertheless, long-term government bond yields remained at low levels and overall conditions in financial markets remained accommodative, with volatility at a low level.
As had been widely expected, the US Federal Open Market Committee (FOMC) announced at its September meeting that in October it would begin to reduce the size of the Federal Reserve's balance sheet. The median of FOMC members' projections for the federal funds rate continued to point to another policy rate increase in 2017 and further increases in 2018. Market pricing continued to suggest that the federal funds rate was expected to increase more slowly than this.
The Bank of Canada increased its policy rate in September in response to stronger-than-expected economic growth. Market participants were now pricing in two further increases in the first half of 2018. At its September meeting, the Bank of England indicated that some tightening in the policy rate was likely to be appropriate in coming months. Market pricing suggested that two rate increases were expected to occur by mid 2018. The European Central Bank (ECB) said that a decision about the future of its asset purchase program was likely to be made in October. The ECB was widely thought to be considering extending the scheme into 2018, but reducing the pace of asset purchases.
Members observed that, over September, the actual and expected removal of monetary policy stimulus had contributed to the increase in long-term government bond yields across the major markets. One exception was Japan, where the Bank of Japan's policy of yield curve control remained in place, involving a 0 per cent target for 10-year Japanese government bonds.
Members noted that the yield on Australian 10-year government bonds had increased over September in response to both global financial market developments and stronger-than-expected domestic economic data, although the yield remained low. Yields on Australian 10-year government bonds had risen by more than yields on US Treasuries over preceding months, which was also the case for a number of other sovereign bonds.
Financial conditions remained highly favourable for companies in major markets. Global share prices had risen over 2017, supported by rising corporate earnings and the improved outlook for global growth. Major market corporate bond spreads to sovereign bonds had continued to narrow over 2017, to be at the lowest level in 10 years.
Financial conditions also remained accommodative in emerging markets, with increases in share prices and declines in government bond yields in 2017. Foreign capital had flowed into these markets seeking higher returns in the global environment of low yields.
Members noted that there had been relatively little movement in most exchange rates over September. The Australian dollar had been little changed over September after having appreciated since mid 2017, partly reflecting a lower US dollar. The Chinese renminbi had depreciated a little in September after having appreciated significantly over preceding months.
In Australia, financial conditions for companies remained accommodative, with price-to-earnings ratios above average and corporate bond spreads at a decade low. Members observed that, nevertheless, companies' demand for external finance had not increased. Net equity raisings had been subdued and corporate bonds outstanding had been little changed over 2017.
Australian housing credit growth had been relatively stable over 2017, with slowing growth in lending to investors offset by slightly higher growth in lending to owner-occupiers. Members noted, however, that growth in lending to investors had stabilised in July and August. There had been little change in Australian banks' variable lending rates over September, although some banks had lowered interest rates on fixed-rate loans, with the largest declines for fixed-rate interest-only loans to investors.
Financial market pricing continued to indicate that the cash rate was expected to remain unchanged during the remainder of 2017, although expectations of a rate rise in 2018 had increased and a 25 basis point rise was fully priced in for the second half of 2018.
Financial Stability
Members were briefed on the Bank's regular half-yearly assessment of the financial system.
The strengthening in global economic conditions had reduced some near-term risks to financial stability arising from rare or extreme events. However, low interest rates and low financial market volatility had promoted financial risk-taking, with high and rising asset prices and debt increasing the risk of a disruptive correction. In China, financial risks remained pronounced. The level of corporate debt in China was particularly high for the country's stage of economic development. The extent to which this borrowing had occurred through opaque and less regulated channels added to the risks. Members noted that Chinese banks' off-balance sheet activities complicated an assessment of the resilience of the financial system. Globally, banks' profitability and capital ratios had increased over the preceding year.
Domestically, household balance sheets remained a key area of attention for policymakers. Household indebtedness remained high and had edged higher in an environment of low interest rates and weak income growth. Despite this, members noted that, relative to income, households' borrowing from banks, net of offset balances, was only slightly higher than it had been a decade earlier. Interest payments relative to income had declined over the previous decade owing to the reduction in interest rates. However, the high level of debt also meant that households were sensitive to any increases in borrowing interest rates. Members also observed that household assets far exceeded debt, with non-housing assets alone being over two times larger than total household debt. The household savings rate was higher than in the early 2000s, although it had declined over the previous few years in the environment of low income growth.
Members discussed the effects of supervisory measures taken by regulators to curtail riskier borrowing for housing. Interest-only lending as a share of new lending had declined substantially following the introduction of a 30 per cent cap for this lending by the Australian Prudential Regulation Authority (APRA) early in 2017. The share of lending at loan-to-valuation ratios exceeding 90 per cent had also declined. Following the introduction of the supervisory measures, borrowing by investors had been growing more slowly, offset by slightly higher growth in borrowing by owner-occupiers.
Members discussed trends in housing demand, supply and prices given the high level of household debt and the importance of housing as collateral in the banking system. A large number of apartments were expected to be completed in 2018 and 2019 in the largest cities, following several years of increasing apartment construction. Members noted that strong population growth had seen demand for inner-city apartments in Melbourne absorb the city's large increase in supply. Generally, demand for smaller apartments targeted at foreign buyers in the major cities had eased. Prices and rents of inner-city apartments had fallen slightly in Brisbane and also in Perth, where economic conditions were weaker.
Australian banks had continued to tighten their commercial property lending standards and their overall commercial property exposures had declined a little over the preceding year. This had been offset by strong growth in the commercial property exposures of Asian banks in Australia. Unlike previous episodes of strong expansion in lending by foreign banks, this had not seemed to have led to an easing in lending standards by Australian banks. Members noted that banks' retail property exposures had continued to grow as retail developments were repurposed to be more flexible given the changing composition of retailing.
Members observed that the profits of Australian banks remained at a high level, which was enabling the banks to increase their capital through retained earnings and dividend reinvestment schemes. The banks had substantially increased their capital ratios since the onset of the financial crisis. Consequently, the major banks were already close to meeting APRA's new target for 'unquestionably strong' capital ratios to be applied from 2020 and the smaller banks generally already exceeded the higher capital requirements. The banks had also increased their liquid asset holdings and their Liquidity Coverage Ratios were well above the 100 per cent minimum requirement.
Australian banks' non-performing loans were a very low share of their assets compared with banks in other advanced economies. Overall, banks' non-performing loan share had declined over the preceding year, with a fall for business lending more than offsetting a small rise for household loans. Members noted that the increase in non-performing housing loans was most pronounced in Western Australia, where the labour market was weakest and housing prices had fallen. Nevertheless, the share of non-performing loans in Western Australia remained at a low level. Further, most non-performing loans remained well secured across all states.
Members noted that housing loans as a share of banks' domestic credit had increased markedly over the preceding two decades. APRA intended to publish a discussion paper later in 2017 addressing the concentration of banks' exposures to housing. Members also noted that APRA had intensified its focus on Australian banks strengthening their risk culture.
Considerations for Monetary Policy
In considering the stance of monetary policy, members noted that economic conditions internationally and domestically had been more positive since 2016. Growth in global trade and production had strengthened and the sources of growth had broadened. Unemployment rates in the advanced economies had declined, but the tighter conditions in labour markets had not flowed through to higher growth in wages or broader inflation pressures. Members also noted that asset valuations were generally quite high.
A number of major central banks had either started to reduce the degree of monetary stimulus or were considering doing so. Nevertheless, financial market pricing suggested that policy rates were expected to remain low for some time. Members observed that moves towards higher interest rates in other economies were a welcome development, but did not have mechanical implications for the setting of policy in Australia, where the timing of any changes in interest rates would be dependent, as always, on developments in domestic economic conditions. Members also noted that monetary conditions in other advanced economies had been eased significantly more than in Australia since the onset of the financial crisis.
Domestically, the increase in GDP growth in the June quarter confirmed that some of the weakness in the previous quarter had been temporary and was consistent with expectations that growth would increase gradually over the coming year, supported by the current stance of monetary policy. Members noted that the increase in spending on public infrastructure projects was supporting a brighter outlook for activity in the non-mining sector. At the same time, recent data continued to indicate that the drag on growth from the end of the mining investment boom was nearing completion.
The current and prospective strength in employment growth in Australia was expected to support household spending in the period ahead, although slow growth in real wages and high levels of household debt were likely to be constraining influences. Remaining spare capacity meant that wage and price increases had been subdued. Wage growth was expected to increase gradually as spare capacity in the labour market diminished, which was in turn expected to contribute to a gradual rise in inflation over time.
The appreciation of the Australian dollar since mid 2017, partly reflecting a lower US dollar, was expected to contribute to ongoing subdued price pressures. A material further appreciation of the exchange rate would be expected to result in a slower pick-up in economic activity and inflation than currently forecast.
The most recent information about conditions in the established housing market suggested that growth in housing prices had eased from the previously brisk pace in some cities, most notably Sydney, and had remained soft in some others. Housing debt had been outpacing the slow growth in household incomes for some time. Recently, growth in credit to investors in housing had eased a little, although overall growth in household credit had been little changed. Members discussed the importance of continuing to assess the various risks in household balance sheets.
Taking account of the available information, the Board judged that holding the stance of monetary policy unchanged at this meeting would be consistent with sustainable growth in the economy and achieving the inflation target over time.
The Decision
The Board decided to leave the cash rate unchanged at 1.5 per cent.
Officials In No Rush To Hike Interest Rates, Still Worried About Household Debt: RBA Minutes
For the 24 hours to 23:00 GMT, the AUD declined 0.3% against the USD and closed at 0.7848.
LME Copper prices rose 3.0% or $205.0/MT to $7063.0/MT. Aluminium prices rose 0.2% or $4.0/MT to $2144.0/MT.
In the Asian session, at GMT0300, the pair is trading at 0.7851, with the AUD trading slightly higher against the USD from yesterday's close.
According to minutes of the Reserve Bank of Australia's (RBA) October meeting, policymakers held the view that any change in monetary policy would be dependent on domestic economic conditions and not on moves by central banks elsewhere. The central bank reiterated that low interest rates would continue in order to support the Australian economy. Moreover, officials noted that household debt levels remain elevated and need careful monitoring.
The pair is expected to find support at 0.7828, and a fall through could take it to the next support level of 0.7804. The pair is expected to find its first resistance at 0.7882, and a rise through could take it to the next resistance level of 0.7912.
The currency pair is trading below its 20 Hr and 50 Hr moving averages.

Euro Trading A Tad Lower, Ahead Of The ZEW Survey Data Across The Euro-Zone
For the 24 hours to 23:00 GMT, the EUR declined 0.1% against the USD and closed at 1.1790.
In economic news, the Euro-zone’s seasonally adjusted trade surplus widened more-than-expected to €21.6 billion in August, amid a rise in exports, thus easing fears about a strong Euro impacting trade. Meanwhile, markets had expected for a surplus of €20.2 billion. The region had reported a revised trade surplus of €17.9 billion in the prior month.
The greenback gained ground against its key peers, after the US President, Donald Trump, expressed confidence in his tax-reform plan and reiterated that it would be completed by the year-end. Moreover, reports that the US President would interview Janet Yellen for a potential second term as the Federal Reserve Chairwoman boosted investor sentiment.
Gains in the US Dollar were extended further, after data indicated that the US New York Empire State manufacturing index recorded an unexpected rise to a level of 30.2 in October, accelerating to a three-year high level and defying market consensus for a fall to a level of 20.4.
In the Asian session, at GMT0300, the pair is trading at 1.1784, with the EUR trading slightly lower against the USD from yesterday’s close.
The pair is expected to find support at 1.1766, and a fall through could take it to the next support level of 1.1749. The pair is expected to find its first resistance at 1.1810, and a rise through could take it to the next resistance level of 1.1837.
Trading trend in the Euro today is expected to be determined by the ZEW economic sentiment survey for October slated to release across the Euro-zone in a few hours. Further, the US industrial and manufacturing production for September followed by the NAHB housing market index for October, all set to release later in the day, will keep investors on their toes.
The currency pair is trading below its 20 Hr and 50 Hr moving averages.

Theresa May And The European Commission Chief Call For Faster Brexit Talks
For the 24 hours to 23:00 GMT, the GBP declined 0.27% against the USD and closed at 1.3249.
Yesterday, the British Prime Minister, Theresa May and the President of the European Commission, Jean-Claude Juncker, agreed that the pace of negotiations over Britain’s exit from the European Union should be accelerated.
In the Asian session, at GMT0300, the pair is trading at 1.3263, with the GBP trading 0.11% higher from yesterday’s close.
The pair is expected to find support at 1.3221, and a fall through could take it to the next support level of 1.318. The pair is expected to find its first resistance at 1.3308, and a rise through could take it to the next resistance level of 1.3354.
Going ahead, traders would eye a speech by the Bank of England (BoE) Governor, Mark Carney as well as the release of UK’s crucial inflation data for September, due to in a few hours.
The currency pair is trading below its 20 Hr and 50 Hr moving averages.

Japanese Yen Reverses Its Losses In The Asian Session
For the 24 hours to 23:00 GMT, the USD rose 0.12% against the JPY and closed at 112.19.
In the Asian session, at GMT0300, the pair is trading at 112.06, with the USD trading 0.12% lower against the JPY from yesterday’s close.
The pair is expected to find support at 111.70, and a fall through could take it to the next support level of 111.35. The pair is expected to find its first resistance at 112.36, and a rise through could take it to the next resistance level of 112.67.
Amid a lack of macroeconomic releases in Japan today, investor sentiment would be determined by global macroeconomic factors.
The currency pair is trading above its 20 Hr and 50 Hr moving averages.

Swiss Franc Trading Marginally Lower This Morning
For the 24 hours to 23:00 GMT, the USD declined 0.06% against the CHF and closed at 0.9757.
In economic news, Switzerland’s total sight deposits remained steady at a level of CHF578.5 billion in the week ended 13 October.
In the Asian session, at GMT0300, the pair is trading at 0.9762, with the USD trading a tad higher against the CHF from yesterday’s close.
The pair is expected to find support at 0.9738, and a fall through could take it to the next support level of 0.9714. The pair is expected to find its first resistance at 0.9778, and a rise through could take it to the next resistance level of 0.9794.
The currency pair is trading above its 20 Hr and 50 Hr moving averages.

Canadian Businesses Still Bullish: BoC’s Autumn Business Outlook Survey
For the 24 hours to 23:00 GMT, the USD rose 0.28% against the CAD and closed at 1.2520.
Yesterday, the Bank of Canada (BoC), in its autumn business outlook survey, revealed continued positive business sentiment across the country, while noting that business activity is becoming more entrenched. Further, the survey highlighted rising expectations for sustained sales growth across regions. However, it also showed several survey indicators moderated from strong summer results.
In the Asian session, at GMT0300, the pair is trading at 1.2525, with the USD trading slightly higher against the CAD from yesterday's close.
The pair is expected to find support at 1.2477, and a fall through could take it to the next support level of 1.243. The pair is expected to find its first resistance at 1.2565, and a rise through could take it to the next resistance level of 1.2606.
With no economic releases in Canada today, traders would focus on global macroeconomic events for further direction.
The currency pair is showing convergence with its 20 Hr moving average and trading above its 50 Hr moving average.
