Sample Category Title
GBP/JPY Pressuring A Support Level
The rate has dropped today's and resumed the Friday's minor drop. Price is pressuring the 148.46 static support (resistance turned into support), but only a valid breakdown will signal a drop towards the first warning line (WL1) of the ascending pitchfork. However, a consolidation above the 148.46 will lead the rate towards the 151.66 level.
EUR/CHF Erased The Morning Losses
The EUR/CHF opened with a gap down and dropped as much as 1.1487 level. The bulls have stepped in again and have forced the rate to climb above the 1.1510 yesterday's low, but this could be only temporary and could drop again. The next downside target will be at the upper median line (uml) of the descending pitchfork.
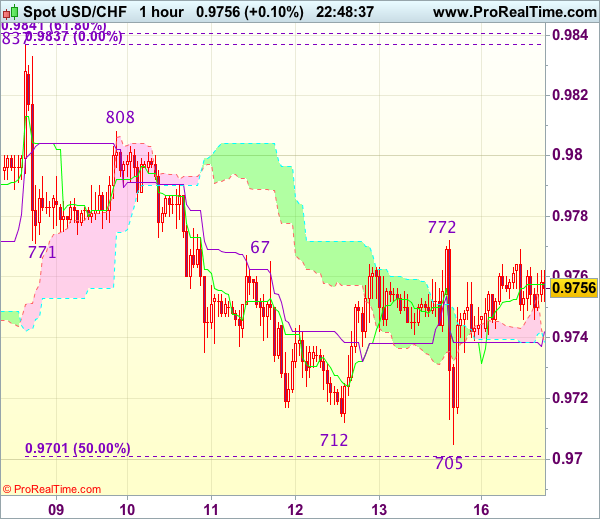
Trade Idea Wrap-up: USD/CHF – Hold short entered at 0.9755
USD/CHF - 0.9734
Most recent candlesticks pattern : N/A
Trend : Near term down
Tenkan-Sen level : 0.9750
Kijun-Sen level : 0.9750
Ichimoku cloud top : 0.9739
Ichimoku cloud bottom : 0.9739
Original strategy :
Sold at 0.9755, Target: 0.9655, Stop: 0.9775
Position : - Short at 0.9755
Target : - 0.9655
Stop : - 0.9775
New strategy :
Hold short entered at 0.9755, Target: 0.9655, Stop: 0.9775
Position : - Short at 0.9755
Target : - 0.9655
Stop : - 0.9775
Although the greenback fell briefly to 0.9705 late last week, lack of follow through selling on break of previous support at 0.9710-12 and the subsequent strong rebound suggest consolidation above said support would be seen, however, as long as resistance at 0.9772 (Friday’s high) holds, bearishness remains for recent decline to resume after consolidation, below said support at 0.9705 would signal the decline from 0.9837 top has resumed and extend weakness to 0.9669-70 (61.8% Fibonacci retracement of 0.9565-0.9837 and previous support) but previous support at 0.9642 should remain intact.
In view of this, we are holding on to our short position entered at 0.9755. Above said resistance at 0.9772 would defer but only break of resistance at 0.9808 would signal low is formed and indicate the pullback from 0.9837 has ended, bring retest of this level later.
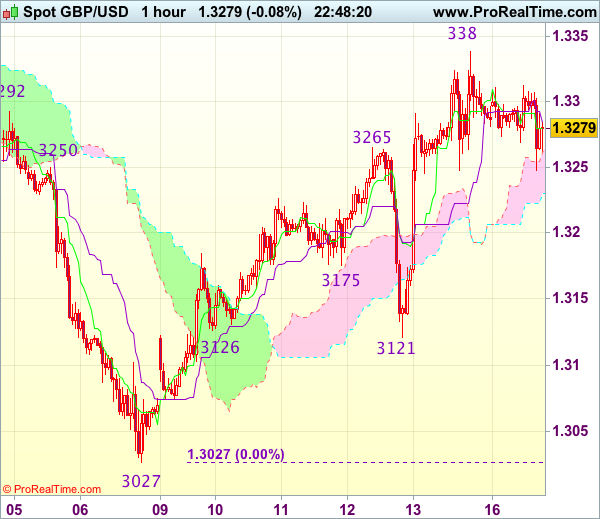
Trade Idea Wrap-up: GBP/USD – Hold long entered at 1.3250
GBP/USD - 1.3277
Most recent candlesticks pattern : N/A
Trend : Near term up
Tenkan-Sen level : 1.3280
Kijun-Sen level : 1.3284
Ichimoku cloud top : 1.3261
Ichimoku cloud bottom : 1.3230
Original strategy :
Bought at 1.3250, Target: 1.3350, Stop: 1.3245
Position : - Long at 1.3250
Target : - 1.3350
Stop : - 1.3245
New strategy :
Hold long entered at 1.3250, Target: 1.3350, Stop: 1.3245
Position : - Long at 1.3250
Target : - 1.3350
Stop : - 1.3245
As the British pound has eased after Friday’s brief rise to 1.3338, suggesting minor consolidation below this level would be seen, however, as long as 1.3245-50 holds, bullishness remains for the rise from 1.3027 low to bring a stronger retracement of recent decline, hence gain to 1.3345-50 and then 1.3375-80 (61.8% Fibonacci retracement of 1.3596-1.3027), however, overbought condition should limit upside to 1.3400-10, bring another retreat later.
In view of this, we are holding on to our long position entered at 1.3250. Below 1.3245 would defer and risk test of the Kijun-Sen (now at 1.3223), break there would defer and suggest top is formed, bring weakness to 1.3200, then towards 1.3175 but said support at 1.3121 should remain intact.
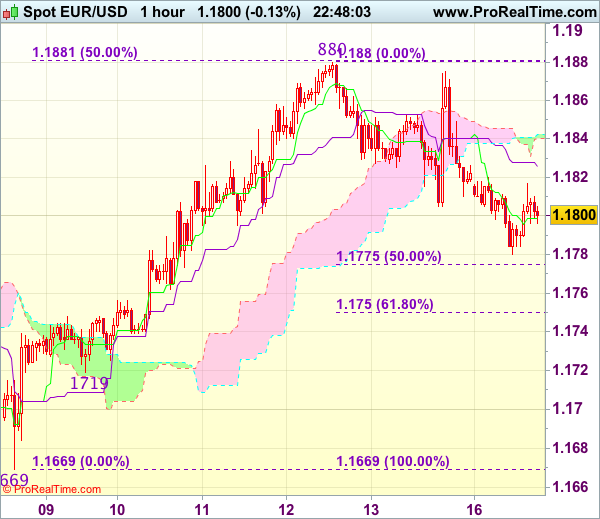
Trade Idea Wrap-up: EUR/USD – Stand aside
EUR/USD - 1.1798
Most recent candlesticks pattern : N/A
Trend : Near term up
Tenkan-Sen level : 1.1799
Kijun-Sen level : 1.1826
Ichimoku cloud top : 1.1843
Ichimoku cloud bottom : 1.1840
New strategy :
Stand aside
Position : -
Target : -
Stop : -
Despite Friday’s rebound to 1.1875, as the single currency has retreated after faltering below resistance at 1.1880, suggesting further consolidation below this last week’s high would be seen and pullback to 1.1775 (50% Fibonacci retracement of 1.1669-1.1880) cannot be rued out, however, reckon 1.1745-50 (61.8% Fibonacci retracement) would limit downside and bring rebound later.
On the upside, expect recovery to be limited to 1.1820-25 and 1.1850 should hold, bring another retreat later. Above 1.1850 would suggest the pullback from 1.1880 has ended and revive bullishness for retest of 1.1880, break there would confirm recent upmove from 1.1669 low has resumed for headway to 1.1895-00 (61.8% Fibonacci retracement of 1.2035-1.1669) first. As near term outlook is mixed, would be prudent to stand aside in the meantime.
Yen Unchanged, BoJ Says Easing to Continue
The Japanese yen has started the week unchanged. In Monday's North American session, USD/JPY is trading at 1.1182, unchanged from the Friday close. On the release front, Japanese Revised Industrial Production rebounded sharply in August, with a gain of 2.0%. This was just shy of the forecast of 2.1%. In the US, the Empire State Manufacturing Index jumped to 30.2, crushing the forecast of 20.3 points. This marked its highest level since 2009.
On Sunday Bank of Japan Governor Haruhiko Kuroda reiterated that the BoJ remains firmly committed to its ultra-easing monetary policy. Kuroda spoke at a Group of 30 meeting in Washington, and said that the policy would remain in place until inflation levels moved higher. Kuroda acknowledged that the BOJ's inflation target of 2 percent was unlikely to be reached anytime soon, but he expected rising labor costs to push inflation levels higher. BoJ policymakers have echoed Kuroda's sentiment that inflation levels will move higher, but the data does not appear to support this optimism, and the BoJ has been forced to lower its inflation forecast a number of times in 2017. With the BoJ forecasting that inflation will not reach 2 percent until fiscal year 2020, it's a safe bet that the bank's accommodative policy won't be tightened any time soon.
The US economy continues to perform well in 2017 and the labor market remains close to capacity. However, this hasn't translated into stronger inflation, and there was some disappointment in the markets as September CPI and Core CPI missed their estimates. On the release front, CPI gained 0.5%, short of the estimate of 0.6%. Core CPI posted a small gain of 0.1%, shy of the forecast of 0.2%. With inflation an important consideration in future rate decisions by the Federal Reserve, investors will be anxiously monitoring how Fed policymakers respond to September's soft inflation numbers. According to CME FedWatch, the soft inflation numbers have not affected the odds of a December rate hike, as fed futures have currently priced a December hike at 91 percent.
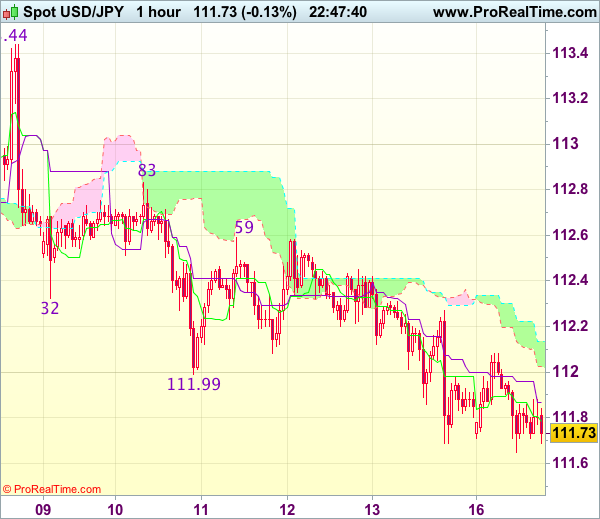
Trade Idea : USD/JPY – Hold short entered at 112.25
USD/JPY - 111.74
Most recent candlesticks pattern : N/A
Trend : Near term down
Tenkan-Sen level : 111.79
Kijun-Sen level : 111.87
Ichimoku cloud top : 112.14
Ichimoku cloud bottom : 112.03
Original strategy :
Sold at 112.25, Target: 111.25, Stop: 112.25
Position : - Short at 112.25
Target : - 111.25
Stop : - 112.25
New strategy :
Hold short entered at 112.25, Target: 111.25, Stop: 112.25
Position : - Short at 112.25
Target : - 111.25
Stop : - 112.25
As dollar has remained under pressure after breaking below last week’s low at 111.99, adding credence to our bearishness and signaling the fall from 113.44 top is still in progress, hence downside bias remains for this move to extend weakness to 111.70 (100% projection of 113.44-112.32 measuring from 112.83), below there would bring subsequent decline to 111.47 support but oversold condition would limit downside and reckon 111.11 support would remain intact.
In view of this, we are holding on to our short position entered at 112.25. Only above resistance at 112.59 would abort and signal low is formed instead, risk a stronger rebound to indicated resistance level at 112.83.
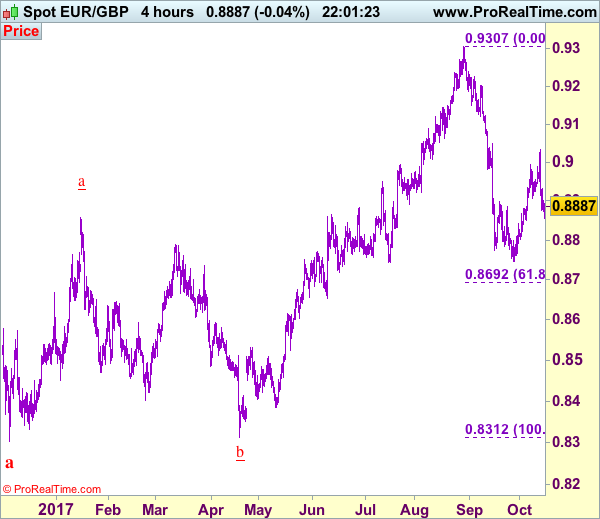
Trade Idea: EUR/GBP – Sell at 0.8930
EUR/GBP - 0.8886
New strategy :
Sell at 0.8930, Target: 0.8800, Stop: 0.8970
Position : -
Target : -
Stop : -
Euro ran into heavy offers at 0.9033 late last week and has retreated sharply from there, suggesting top has been formed there and consolidation with mild downside bias is seen for weakness to support at 0.8850, break there would add credence to this view and suggest the rebound from 0.8746 low has ended, bring further fall to 0.8800-10 later.
In view of this, would not chase this fall here and would be prudent to sell euro on recovery as 0.8935-40 should limit upside. Above 0.8955-60 would bring recovery to 0.8955-60 but upside should be limited to 0.8985-90, price should falter well below said resistance at 0.9033, bring another selloff.
Our preferred count is that, after forming a major top at 0.9805 (wave V), (A)-(B)-(C) correction is unfolding with (A) leg ended at 0.8400 (A: 0.8637, B: 0.9491 and 5-waver C ended at 0.8400. Wave (B) has ended at 0.9413 and impulsive wave (C) has either ended at 0.8067 or may extend one more fall to 0.8000 before prospect of another rally. Current breach of indicated resistance at 0.9043 confirms our view that the (C) leg has ended and bring stronger rebound towards 0.9150/54, then towards 0.9240/50.
Brent Oil – Bull May Extend to Key $59.48 Barrier after Consolidation
Brent oil rallies strongly for the second consecutive day and hit nearly three-week high at $58.46 on Monday. This also marks Fibo 76.4% of $59.48/$55.04 pullback, with daily close above broken Fibo 61.8% at $57.78 seen as strong bullish signal for final push towards key barrier at $59.48 (26 Sep high). North-heading daily Tenkan-sen underpins the action after forming bull-cross with Kijun-sen line. Near-term bulls are also supported by strong fundamentals. On the other side, weak reading of 14d momentum on daily chart warns of stall and consolidation before bulls resume. We expect shallow downside action which should be ideally contained by broken Fibo support at $57.78, ahead of final push towards $59.48 target. Stronger bearish action could be expected on violation of rising Tenkan-sen ($56.74).
Res: 58.46; 58.87; 59.23; 59.48
Sup: 57.26; 57.13; 56.74; 56.25
Elliott Wave Analysis: S&P500 Update
S&P500 made a breach higher, out of a triangle pattern last week, which is a sign of a bullish continuation. We so see wave 4 completed near the 2547 region and recent recovery as sub-wave i and ii of 5. From current levels, we expect price to continue higher, towards the Fibonacci ratio of 200.0. However, if price drops lower and breaks below the former wave 4 swing low, then we can say that bigger wave 5 was completed at recent high and now a change in trend is in progress.
S&P500, 1H