Sample Category Title
Euro Dips Lower Despite Positive Eurozone Data
The euro has started the week with slight losses. In the Monday session, EUR/USD is trading at 1.1791, down 0.22% on the day. On the release front, eurozone data was positive. German Wholesale Price Index gained 0.6%, above the forecast of 0.4%. The eurozone trade surplus jumped to EUR 21.6 billion, above the estimate of EUR 20.3 billion. The US will release the Empire State Manufacturing Index, which is expected to slow to 20.3 points. On Tuesday, Germany releases ZEW Economic Sentiment and the eurozone will publish Final CPI.
The game of brinkmanship between the leaders of Spain and Catalonia continues this week, with no resolution in sight. The Spanish government set a Monday deadline for Catalan President Carles Puigdemont to expressly state whether he had declared independence, and if so, Puigemont was given three more days to retract his proclamation. However, the Catalan President shirked away from a clear answer and let the first deadline pass, calling for more dialogue with Madrid. Prime Minister Mariano Rajoy has threatened to suspend the Catalan parliament and impose direct rule from Madrid, which could trigger a violent response. The crisis has led 500 companies to start leaving Catalonia, and the Standard and Poor’s rating agency has said that the region could face a recession if the crisis continues.
ECB President Mario Draghi said on Thursday that he plans to maintain ultra-low rates “well past” the end of its bond-buying program in December. The ECB has been under pressure to tighten monetary policy, primarily from Germany, where the central bank has called for tighter policy, given the stronger eurozone economy. The ECB is expected to taper its monthly bond purchases of 60 billion euros at its policy meeting on October 26, but Draghi has sent out a clear message that rate hikes will have to wait until 2018. With inflation levels will below the ECB target of around 2 percent, Draghi has been reluctant to raise interest rates until inflation shows clear signs of moving upwards.
A strong US economy hasn’t led to higher inflation, and there was some disappointment in the markets as CPI and Core CPI narrowly missed their estimates. On the release front, CPI gained 0.5%, short of the estimate of 0.6%. Core CPI posted a small gain of 0.1%, shy of the forecast of 0.2%. With inflation an important consideration in future rate decisions by the Federal Reserve, investors will be anxiously monitoring how Fed policymakers respond to September’s soft inflation numbers. Retail sales data was a mix, as Core Retail Sales gained 1.0%, above the estimate of 0.9%. However, retail sales were up 1.6%, short of the forecast of 1.7%.
Market Update – European Session: Spain Central Govt Says Catalan Did Not Properly Reply To Request On Independence
Notes/Observations
Catalonia's leader failed to say whether he declared the region independent from Spain; raising the possibility of a reprisal in the coming days by the central government
Austrian parliamentary election has conservative People's Party keeping populism alive; led by 31-year-Kurz; wants tougher rules on immigration; Austria's new government stands against Macron/Merkel EMU reforms
Overnight
Asia:
China Sept CPI M/M: 0.5% v 0.3%e; Y/Y: 1.6% v 1.6%e; PPI Y/Y: 6.9% v 6.4%e
China Sept New Yuan Loans (CNY): 1.27T v 1.23Te
PBOC Gov Zhou saw H2 GDP growth reaching 7% driven by rapid growth in household consumption (**Note: China's economy grew by 6.9% y/y in each of the first two quarters of 2017. Q3 data is expected on Thursday, Oct 19th)
BoJ Gov Kuroda: Reiterates that BoJ will continue to pursue aggressive monetary policy easing. Current monetary policy can and should continue to achieve inflation target
Europe:
Some ECB members said to identify €2.5T limit for QE based on current rules. some officials believe there are enough bonds in the market to cut monthly purchases to €30B starting in Jan 2018 and lasting until Sept. General Council said to be deeply divided on whether to name an end date for program
ECB President Draghi reiterated have to be patient and persistent with our monetary policy; confident that wages and inflation will gradually rise in self-sustaining manner
Bank of England (BOE) Gov Carney reiterated view that might be appropriate to raise rates in the coming months
UK PM May's Office confirmed she will meet with EU officials Barnier and Juncker on Brexit on Monday
Austria national election results: People's Party (OVP) headed by Sebastain Kurz received 31.4% of the votes; results show that populism is not dead
Americas:
Fed Chair Yellen: New normal will be lower interest rates than we've seen historically; biggest surprise in the US economy this year has been inflation. Ongoing strength of the economy will warrant gradual increases in short-term interest rates (didn't specify when the next rate increase would come)
Fed's Rosengren (moderate, non-voter): 3-4 rate hikes next year will probably be appropriate; may need to overshoot on rates if unemployment is below 4% while inflation reaches target
White House econ advisor Cohn: strong, consistent economic growth is best insulator against financial crisis
Energy:
OPEC Sec Gen Barkindo: Have seen progressive improvement in compliance levels
Kuwaiti Oil Min: Too early to talk about extending supply cut agreement but we are at the right direction
Economic Data
(DE) Germany Sept Wholesale Price Index M/M: 0.6%e v 0.3% prior; Y/Y: 3.4% v 3.2% prior
(NO) Norway Sept Trade Balance (NOK): 9.2B v 12.4B prior
(IN) India Sept Wholesale Prices (WPI) Y/Y: 2.6% v 3.3%e
(EU) Euro Zone Aug Trade Balance (Seasonally Adj): €21.6B v €20.2Be; Trade Balance NSA (unadj): €16.1B v €23.3Be
Fixed Income Issuance:
None seen
SPEAKERS/FIXED INCOME/FX/COMMODITIES/ERRATUM
Equities
Indices [Stoxx600 +0.20% at 392.2, FTSE +0.2% at 7546, DAX +0.20% at 13018, CAC-40 +0.3% at 5366, IBEX-35 -0.5% at 10203, FTSE MIB +0.1% at 22436, SMI -0.1% at 9305, S&P 500 Futures flat]
Market Focal Points/Key Themes:
European Indices trade mostly higher this morning with the exception of the the Spanish IBEX continued to be weighed down on uncertainty over Catalonia independence.
Leading advancers include TopDanmark after raising outlook and Shire which outperforms in the UK on reports activist fund urging sale or spin off. To the downside, Siemens Gamesa falls sharply after cutting its outlook while Convatec trades over 20% lower after cutting outlook and Q3 update.
Today in the US notable earnings include Netflix after the close as earnings are due to pick up during the week.
Equities
Consumer discretionary [ Teleperformance [RCF.FR] -1.3% (Q3 results, strategy update)]
Industrials: [Kuehne & Nagal -4% (9M Results), Husqvarna [HUSQB.SE] -5% (Cuts outlook) ]
Financials: [TopDanmark [TOP.DK] +2.7% (Raised outlook)]
Technology: [SLM Solution [AM3D.DE] +4.1% (Awarded major order)]
Healthcare: [ Shire PLC [SHP.UK] +2% (Said that activist fund Sachem Head Capital Management is urging Shire to explore a sale or spin-off some of its assets), ConvaTec Grp [CTEC.UK] -21% (Trading update, cuts outlook)]
Energy: [ Siemens Gamesa [SGRE.UK] -7.7% (Cuts outlook)]
Speakers
Catalan President Puigdemont response via letter to PM Rajoy said to suspend independence mandate and seek dialogue. Defended claim to independence; called for Spain to end its repression dialogue. Would not respond with a yes or no on independence request as required by Spanish PM Rajoy
Central Spanish Govt said not to see the Catalan response as appropriate
Spain Deputy PM Saenz: Catalonia President Puigdemont did not reply to request; 2nd deadline has been activated (as speculated). Region has until Thursday, Oct 19th
Italy could hold parliamentary elections on March 4th 2018 (**Insight: Elections in Italy are due by May 2018)
France Fin Min Le Maire reiterated French gov't would stick to EU's 3% budget deficit limits
Sweden Central Bank (Riksbank) Dep Gov Ohlsson reiterates view that inflation target was important. Expansionary policy was a prerequisite for inflation to be close to target
Iraq Military Commander: Kurds agree to hand over control of all north oil company facilities to Iraqi forces
Iraqi forces claim to have recaptured refinery in Kirkuk (Kurds deny claim)
Currencies
EUR/USD was softer as the Catalan situation has yet to be resolved. Also the recent vote out of Austria showed that populism was not dead. Pair holding below the 1.18 level for the early part of today's session. Focus looking ahead to next week ECB decision see the central bank seen announcing the bulk of its decisions on QE tapering
GBP/USD was higher on reports that UK PM May planned to meet with European Union officials in Brussels in the hope of ending the Brexit stalemate. GBP/USD higher by 0.1% at 1.3296 area with e EUR/GBP cross at 0.8867
Fixed Income
Bund futures trade at 162.08 up 1 tick as some analysts lower their range for the yield on the 10-year German government bond to range from 0.40-0.45%, down from 0.45-0.50%. Continued downside targets 161.53 while upside resistance stands initially at 162.50, followed by 163.27.
Gilt futures trade at 123.75 down 17 as as PM May heads to Brussels to personally intervene in deadlocked Brexit negotiations and BOE Gov Carney reiterates intentions to raise rates. Continued downside eyeing 123.26. Upside targets 124.90 then 125.24.
Monday's liquidity report showed Friday's excess liquidity rose to €1.820T from €1.807T and use of the marginal lending facility fell to €118M from €89M.
Corporate issuance saw EM sovereign issuance climb to a record and soared above $200 Billion
Looking Ahead
UK PM May to meet EU's Barnier and Juncker in Brussels
05:30 (NL) Netherlands Debt Agency (DSTA) to sell €2.0B in 6-month bills
06:00 (IE) Ireland Aug Trade Balance: No est v €4.2B prior
06:00 (IT) Italy Cabinet meets on 2018 Budget law
06:25 (BR) Brazil Central Bank Weekly Economists Survey
06:45 (US) Daily Libor Fixing
07:00 (IN) India announces details of upcoming bond sale (held on Fridays)
07:30 (TR) Turkey TCMB Survey of Expectations
08:00 (PL) Poland Aug Current Account: -€0.7Be v -€0.9B prior; Trade Balance: -€0.5Be v -€0.6B prior
08:00 (ES) Spain Debt Agency (Tesoro) announces size of upcoming actions in week
08:05 (UK) Baltic Dry Bulk Index
08:30 (US) Oct Empire Manufacturing: 20.5e v 24.4 prior
08:30 (CA) Canada Aug Int'l Securities Transactions(CAD): No est v 24.0B prior
08:50 (FR) France Debt Agency (AFT) to sell combined €4.3-5.5B in 3-month, 6-month and 12-month Bills
09:00 (BE) Belgium Aug Trade Balance: No est v -€0.3B prior
09:30 (EU) ECB announces Covered-Bond Purchases
09:35 (EU) ECB calls for bids in 7-Day Main Refinancing Tender
10:30 (CA) Bank of Canada (BOC) Q3 Loan Officer Survey: No est v 2.1 prior
11:30 (US) Treasuries to sell 3-Month and 6-Month Bills
14:00 ECB's Lautenschlaeger (Germany)
16:00 (US) Weekly Crop Progress Report
Technical Outlook: GBPUSD In Tight Range Ahead Of Tomorrow’s UK CPI Data
The pair remains directionless on Monday with price action holding in tight Doji. Rumors of big name suggesting longs just under 1.3300 for fresh upside extension towards 1.3500 zone, keeps the pair afloat and preventing stronger pullback, signaled by overbought slow stochastic on daily chart.
Consolidative phase may extend while falling 20SMA caps, with extended dips allowed towards 10 SMA (1.3207).
The pair is looking for tomorrow's release of UK CPI data which could generate fresh direction signal.
Inflation in the UK is expected to rise to 3% in September after 2.9% in August. Release above 3% would be supportive for sterling and spark fresh upside, in extension of past five-day's rally.
Downbeat CPI data (below 2.9%) would put pound under pressure and risk deeper pullback.
Res: 1.3311, 1.3326, 1.3341, 1.3415
Sup: 1.3253, 1.3222, 1.3207, 1.3182
EURCHF Gathers Momentum To The Downside, Bias Turns Bearish
EURCHF has stalled its uptrend recorded between October 2-12, stretching below the 1.15 key level and the 50-period exponential moving average. The short-term bias has turned bearish in the 4-hour chart according to technical indicators.
Both the RSI and the MACD give bearish signals as the former has dropped below its neutral zone, while the latter has slowed down, approaching zero and deviating below its signal line. Moreover, the Kijun-sen and the Tenkan-sen posted a bearish cross today, hinting that the pair might follow a downward path in the near-term.
Should the pair head down, support is likely to emerge at the 50% Fibonacci of 1.1475 of the uptrend from 1.1387 to 1.1561 (October 2-12). A drop below that level would see a re-test of the 61.8% Fibonacci of 1.1455 before the 78.6% of 1.1425 come into view.
On the flip side, the 23.6% Fibonacci at 1.1522 could also act as a barrier to upside movements. From here, the focus would shift towards the previous top at 1.1561. Any close above this point would confirm the continuation of the longer-term uptrend and therefore would restore the bullish status.
Technical Outlook: EURGBP – Bears May Pause Above 20SMA Before Resuming, Hourly Cloud To Cap Upticks
The cross remains in red for the third consecutive day and fell further on Monday, extending weakness after last week’s strong upside rejection at daily cloud base (0.9024).
Bears met target at 0.8855 on Monday (Fibo 61.8% of 0.8745/0.9032 upleg) which marks pivotal support (reinforced by 20SMA), break of which would generate fresh bearish signal.
Bearish setup of daily studies supports further weakness, as bearish weekly candle with long upper shadow, left last week, also weighing on market.
Oversold slow stochastic suggests bears could enter consolidation above 20SMA.
Converged 10/100 SMA’s (0.8917/21) offers solid resistance, reinforced by falling hourly cloud (spanned between 0.8928 and 0.8954) which should limit upside attempts.
Res: 0.8895, 0.8920, 0.8954, 0.9000
Sup: 0.8855, 0.8813, 0.8800, 0.8745
UK Data Eyed As BoE Ponders Rate Hike
- Earnings could support equity market rally;
- UK data eyed as BOE ponders rate hike;
- IBEX underperforms as Puigdemont side-steps independence request.
US equity markets are poised to start on a positive note once again, looking to build on the numerous record highs recorded in recent weeks on the prospect of a brighter global economic outlook.
With corporate earnings season now underway and the number of companies reporting on the third quarter picking up quickly – 56 S&P 500 companies to release numbers this week – investors will be looking to the figures to add further support to the rally. This is particularly the case given the quieter week we have on economic data side, with predominantly tier two figures scheduled for release.
On the data side, it’s the UK that will be in focus this week, as we get numbers on the labour market, inflation and consumer spending. This comes as the Bank of England continues to weigh up raising interest rates before the year is out, a controversial move considering the gloomy economic outlook at mostly temporary nature of above target inflation. Should inflation ease off tomorrow as it did a few months ago, it will be interesting to see whether traders adjust rate hike expectations accordingly or stick with the line coming from the central bank.
Spanish shares are once again underperforming their European counterparts after Catalan leader Carles Puigdemont opted not to clarify whether or not independence had been declared, having been given a deadline of 10am local time to do so. Instead Puigdemont once again called for dialogue with Madrid over the next two months, which once again suggests independence is possibly not the aim of the government, at least not against the will of the Spanish authorities.
We’ll have to wait and see whether Prime Minister Mariano Rajoy is open to talks or if the current stand-off will be maintained. Rajoy may see the latest response as a sign of weakness and instead look to test Puigdemont’s resolve, creating further market uncertainty. The preferred outcome would be to find a diplomatic solution which would probably include more autonomy being granted to the region, something Rajoy is against.
Highly Distorted US CPI Casts Doubts, Austria Shifts Right
USD stabilises despite faltering confidence
The US dollar experienced another broad-based sell-off last Friday amid disappointing inflation and retail sales data. Commodities currencies benefited the most of this renewed USD weakness as investors discounted an aggressive Fed rate path. The single currency rose 0.58% to 1.1875 before eroding gains and returning towards 1.1820 as market participants appeared reluctant to load long EUR position against the backdrop of political uncertainties across the European Union - mostly Catalan and Austrian situation.
Regarding the inflation in the US, the headline measure came in at 2.2%y/y versus 2.3% expected and 1.9% in August, while the core measure, which excludes the most volatile components, held stable at 1.7% versus an expected increase of 1.8%. The solid pick-up in the headline measure is mostly due to a surge in energy prices as motor fuel prices and fuel oil rose 13%m/m and 8.2%m/m, respectively. Food prices, on the other hand, remained roughly stable, increasing only 0.1%m/m. The increase in energy prices stemmed from the combination of two main factors. Firstly, oil prices have strengthened over the summer months amid shrinking oil inventories in US and efforts of OPEC producers to trim production in an attempt to boost oil prices. Secondly, the series of hurricanes that hit the Gulf Coast disrupted significantly oil production and also triggered widespread gas hoarding.
On Monday morning, however, the greenback got some colour back as fears eased. The US dollar erased almost completely Friday’s losses against the euro and the pounds, while the Aussie and the Kiwi consolidated previous gains. Investors don’t know where to stand against the backdrop of an uncertainty outlook on both side of the Atlantic. Indeed, the single currency has benefited extensively of the weakness in US inflation together with mounting speculations of the upcoming reduction of the ECB’s QE. Now that the EU is facing another political crisis, investors are reconsidering other alternatives.
Eurozone: Political worries increase
The single currency decreased after the market opening against the dollar. The Austrian Legislative Election brought new uncertainties. The young conservative leader Sebastian Kurz, an anti-immigration millennial, is about to become the new Austrian Chancellor next Sunday after his victory in the General Election. Yet he will likely open up to the far right in order to build its government. This reminds us of 2000 when Far-right entered the government. Yet it does not seem that the new government will be against the euro.
In Spain, tensions continue and Catalonia still has to declare unilaterally its independence. There are tensions within the independentists. Some believe that Catalonia is not ready yet for its independence. Madrid is now giving an ultimatum to Catalonians leaders. For the time being, companies are moving away from Catalonia, other entrepreneurs are opening account in bordering areas.
As a result, political tensions are strong in Europe. The Eurodollar pair lies below 1.18 and any news can trigger further political fears. We continue to believe that strongest uncertainties are not in centre stage at the moment but the Greek debt issue has definitely the potential to weigh on the single currency. The next ECB monetary policy is not at the moment the main driver even though markets have strong tightening expectations
Daily Technical Analysis: EURUSD, GBPUSD, USDJPY, USDCHF
EURUSD
The EURUSD had a bullish momentum last week topped at 1.1879 but closed a little bit lower at 1.1820. The bias is neutral in nearest term probably with a little bearish bias testing 1.1750 support area. A clear break and daily close below that area would expose 1.1670 support area which is the “neckline” of a “head and shoulders” formation as you can see on my daily chart below, which is a bearish reversal pattern. The major bullish trend remains valid but need a clear break and daily close above 1.1900 to potentially end the current bearish correction phase and resume the major bullish trend testing 1.2000 – 1.2090 area.
GBPUSD
The GBPUSD had a bullish momentum last week topped at 1.3337 after three consecutive bearish candle on weekly chart. The bias is neutral in nearest term probably with a little bearish bias as we have a bearish pin bar after rejection above 1.3330 key resistance as you can see on my daily chart below testing 1.3225 region. Overall I remain bullish but need a clear break above 1.3330 to reactivate my bullish mode retesting 1.3615 region.
USDJPY
The USDJPY had a bearish momentum last week bottomed at 111.68 following a false break above 113.20 key resistance and the appearance of a bearish pin bar as you can see on my daily chart below. The bias is bearish in nearest term testing 111.65. A clear break below that area would expose 111.00 – 110.65 support area. Immediate resistance is seen around 112.35. A clear break above that area could lead price to neutral zone in nearest term but only a clear break above 113.20 would stop the current short-term bearish bias. Overall I remain neutral.
USDCHF
The USDCHF was indecisive last week. The bias is neutral in nearest term. The bearish pin bar scenario remains valid but need a clear break below 0.9700 to continue the bearish scenario testing 0.9650 – 0.9590 region. Immediate resistance is seen around 0.9765. A clear break above that area could trigger further bullish pressure testing 0.9807/36 key resistance. Overall I remain neutral.
Technical Outlook: Copper Surged To Three-Year High Following Strong Chinese Data
Copper future contract for December surged to three-year high at $3.2300 on Monday, boosted by strong Chinese data which signal robust growth of metal's world top user.
Copper price was up 2.3% from Monday's opening and strong bullish acceleration broke above previous high of 05 Sep at $3.1770. Today's close above here will be strong bullish signal for extension towards Fibonacci projections at $2.440 (123.6%) and $3.2855 (138.2%) en-route towards $3.2930 (July 2014 peak).
Meanwhile, bulls may take a breather on overbought daily RSI / slow stochastic. Corrective dips should be ideally contained above previous high at $3.1770, however, deeper dips cannot be ruled out.
Next support lies at $3.1505 (Fibo 23.6% of $2.8930/$3.2300 upleg) ahead of last Friday / today's lows at $3.1111 and Fibo 38.2% at $3.1013, which are expected to contain deeper dips.
Res: 3.2300, 3.2440, 3.2855, 3.2930
Sup: 3.2000, 3.1770, 3.1505, 3.1111
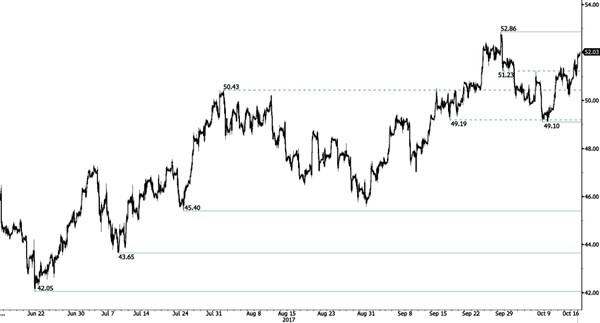
CRUDE OIL Riding The Range
Crude oil is pushing higher within a range defined by the support at 50.43 and the strong resistance lies at 52.86 (28/09/2017). Expected to show continued increase within this range.
In the long-term, crude oil has recovered after its sharp decline last year. However, we consider that further weakness are very likely. For the time being the pair lies in an upside momentum. Strong support lies at 35.24 (05/04/2016) while resistance can now be found at 55.24 (03/01/2017 high).