Sample Category Title
EUR/USD Increasing Selling Pressures
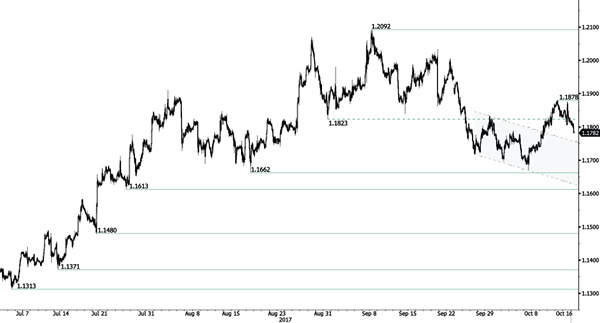
EUR/USD momentum is reversing since the pair has set up an hourly resistance at 1.1878 (12/10/2017 high). Strong support is given at a distance at 1.1662 (17/08/2017 low). Expected to show some short-term consolidation.
In the longer term, the momentum is now turning largely positive. We favour a continued bullish bias. Key resistance is holding at 1.2252 (25/12/2014 high) while strong support lies at 1.0341 (03/01/2017 low).
Catalonian Defends Independence | May Needs To Break Dead Lock
- Catalonian President is open to meet Spanish Prime Minister
- Important event for this week would be the Brexit negotiation
- Sterling has seen a lacklustre performance
- The precious metal is battling with the psychological level of $1300
Investors are keeping a close eye towards the final verdict by the Catalonian President, Charles Puigdemont, on his illegal referendum. Madrid gave a Catalonian strict timeline to clarify their position and the president was asked a very simple question which had only two answers in terms of independence; Yes or No. In his letter to Spanish Prime Minister Rajoy today, he declared that he is open to meet Spanish Prime Minister in order to discuss the situation. This hasn’t helped the situation given what the mandate was given to him by Madrid. Mr. Rajoy asked for clarity and clearly stated any ambiguous answer would be equal to declaring independence. The letter pretty much gives the message that he is defending the independence situation and he is still not open to provide a clear answer.
The president first declared independence (on the back of the illegal referendum) but then deferred its implementation only a few seconds after. The Catalonian President, Charles Puigdemont, has an arduous decision to make. On one hand, he needs to respect the decision and efforts made by thousands who came out to vote for this referendum. By declaring independence he is likely going to be arrested and Madrid would have to impose the article 155 of the Spanish constitution.
Under this article, Madrid would directly rule and it would also trigger mammoth unrest in the country. On the other hand, if he backs down, the Catalan government isn’t going to accept his leadership anymore and the government would spilt. This entire situation opens the Euro currency to a significant risk and uncertainty. Unless we could see a clear path out of this Catalonian situation, we expect the upside to remain capped.
Another important event for this week would be the Brexit negotiation which is in a deadlock position as the EU chief negotiator, Michael Barnier, confirmed. The British currency, Sterling, has seen a lacklustre performance due to this. However, Central bank’s governor’s testimony this week would be far more important. The governor would have to look at the economic data and Brexit negotiations carefully before he reveals his position.
The precious metal is battling with the psychological level of $1300. There are a number of factors supporting the price. For instance, the US inflation data released last week was pretty much weak and this keeps the Fed in check and they cannot adopt an overly aggressive stance towards the interest rate hike path. Secondly, the geopolitical tensions are keeping investors on their toes as South Korea focuses on its drills. Finally, Iraq’s Kurdish region and Iran's nuclear deal could easily move in any direction.
Technical Outlook: Spot Gold Establishes Above $1300 On Fresh Safe-Haven Buying
Gold posted new high at $1305 on Monday, extending last week's strong rally, when yellow metal was up 2.12% in the strongest weekly performance since last week of August.
Gold price is establishing above $1300 level, boosted by fresh safe-haven buying on rising tensions over Kurdish referendum which resulted in clashes between Iraqi and Kurdish forces.
Bullish techs are underpinned by fundamentals and could boost metal's price for test of next barrier at $1309 (weekly Tenkan-sen / 50% of $1357/$1260 descend), break of which would expose top of daily cloud at $1316.
Overbought slow stochastic on daily chart warns of pullback. Broken psychological $1300 level now marks immediate support, followed by rising 55SMA at $1295, which should contain dips and guard lower pivot at $1288 (20SMA).
Res: 1305, 1309, 1313, 1316
Sup: 1300, 1295, 1288, 1285
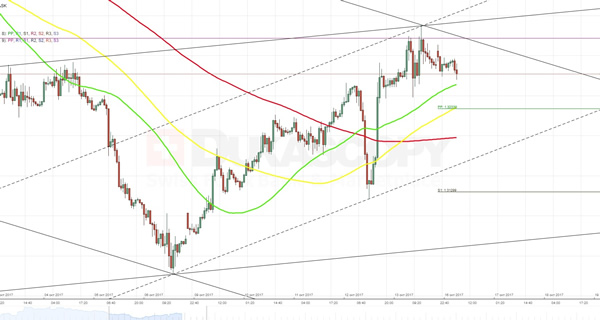
EURUSD Analysis: Starts Trading Near Weekly PP At 1.1810
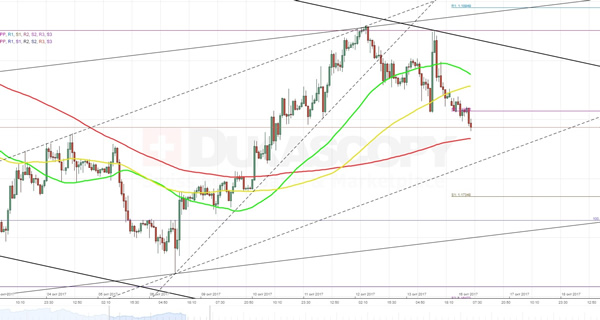
In line with expectations, the currency pair continued to move horizontally in anticipation of release of information about the US CPI. Although the data appeared to be worse than expected, the rate failed to surge above the monthly PP at 1.1875. As a result, new trading week it started at the updated weekly PP at 1.1810, being squeezed between the 55- and 100-hour SMAs from the top and the 200-hour SMA from the bottom. This fact suggests that despite that the average market sentiment is predominantly bearish, the pair is likely to fail to pass through the 1.1783 mark in one go. However, since the pair has recently made a breakout from the rising wedge, in general, it is expected to stick with the southern direction.
GBPUSD Analysis: Fails To Surge Above 1.3320
Although the US data release, in general, appeared to be worse than expected, the upside momentum was not strong enough to push the pair above the monthly PP at 1.3322. The presence of a recently formed ascending channel whose bottom boundary is backed up by the rising 55-, 100-, 200-hour SMAs suggests that the currency rate most probably is going to break through that resistance and continue to move to the north. On the other hand, there are two large unconfirmed channels who boundaries are located near the 1.3330 mark and that might turnaround the pair. Finally, there is a need to take into account that this week will be full of the UK data releases, including inflation and retail sales, that are expected to have a notable impact on further direction of the pair.
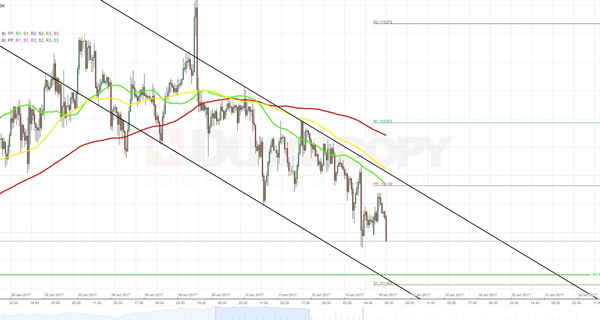
USDJPY Analysis: Trades Near 111.88
In accordance with expectations, the currency exchange rate continued to move to the south within one-week long descending channel. The further deprecation of the buck was supported not only by the pressure of 55-, 100- and 200-hour SMAs that were moving along the pattern’s upper boundary, but also by the increased US CPI and ongoing war of words between the US, North Korea and Iran. At the moment, the northern side is additionally protected by the updated weekly PP at 112.13, while the southern side lacks of any notable technical barriers up until the weekly S1 at 111.43. These facts as well as the 56% bearish market sentiment suggests that in the nearest future the currency rate most probably is going to continue to move to the bottom.
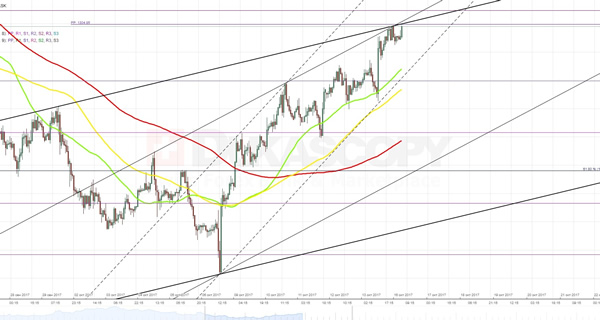
XAUUSD Analysis: Surges In Two Channels
Due to increase of the US Consumer Price Index, the yellow metal continued to advance against the buck simultaneously in two ascending channels. On the one hand, the pair is experiencing pressure from the 55- and 100-hour SMAs, which are continuously pushing it to the top. On the other hand, the pair faces a notable resistance level formed by the monthly PP at 1,304.85, which it has already failed to bypass once. There is a need to notice that intersection between the above two channels reminds another pattern, i.e. rising wedge. If this assumption is true, the pair has to make a breakout to the bottom somewhere between the 1,305 and 1,310 marks. However, if macroeconomic background will remain unfavourable, the rate most likely is going to surge to the 1,314 level.
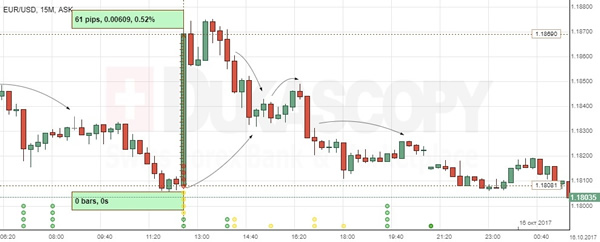
EUR/USD: US Consumer Prices Index
The Greenback depreciated significantly against the Euro on the US economic reports on Friday. The EUR/USD exchange rate jumped 61 base points or 0.52% to enter the 1.1870 area close to the weekly high. Though, the pair gradually returned to pre-data levels, as EUR/USD remained under the bearish sentiment, putting an exchange rate lower.
The Labour Department showed that the US Consumer Price Index edged 0.5% higher in September, the strongest gain since January, which put the yearly rate of consumer inflation to 2.2% in the reported period. Separate report showed a 1.6% increase in the country's retail sales, where its sustainable firmness could cause a cease of low inflation trend and confirm the Fed's stance to raise interest rates anytime soon.
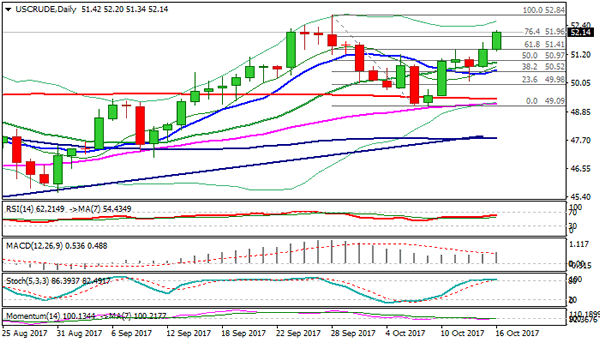
Technical Outlook: WTI Oil – Bulls Look For Full Retracement Of $52.84/$49.09 Pullback
WTI oil holds firm on Monday and probed above $52.00, hitting new 2 1/2 week high at $52.20. Signs of oil market rebalancing keep the price supported with fresh boost coming on concerns over potential output disruption after Iraqi troops clashed with Kurdish forces in Kirkuk area which is home to Iraq's main oilfields. Technical studies remain in firm bullish setup and supportive for further advance, but bulls may take a breather before final push towards key short-term barrier at 52.84 (29 Sep peak), as slow stochastic is overbought on daily chart. Broken Fibo 61.8% barrier at $51.41 now acts as support, with extended dips expected to hold above rising 20SMA (currently at $50.89). Bullish scenario on firm break above $52.84 sees extension towards $53.74 (12 Apr high), regain of which would unmask key med-term barrier at $55.01 (21 Feb peak).
Res: 52.20, 52.41, 52.84, 53.18
Sup: 51.81, 51.40, 50.87, 50.65
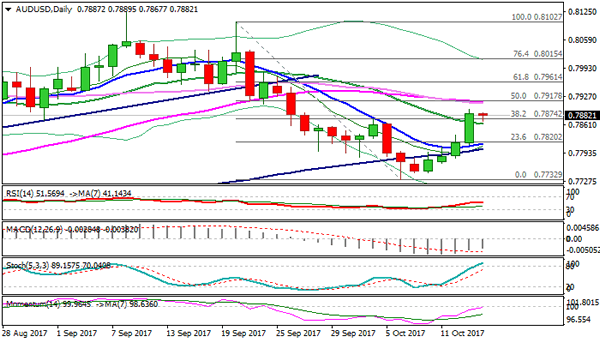
Technical Outlook: AUDUSD Weaker After Solid Chinese Data But No Clear Reversal Signal For Now
Bulls are pausing on Monday after last week's strong rally which extended for fourth straight days. The rally peaked at 0.7897 on Friday, with Monday's easing being triggered by stronger than expected China's inflation numbers.
The Aussie dipped to 0.7867 in Asia, where 20 SMA offered footstep, with fresh recovery under way.
However, bulls may show stronger signs of stall as studies on daily chart are in mixed mode and slow stochastic entered overbought territory. In addition, converged 30/55SMA's (0.7911), which formed bear-cross, weigh on near-term action.
Failure to clearly break above 0.7900/11 zone would keep the downside vulnerable.
Loss of 20SMA support would risk test of another strong support at 0.7849 (daily cloud base) and generate stronger bearish signal on break. Bulls require lift above 0.7911 (30/55SMA) and 0.7917 (daily Kijun-sen) to signal bullish continuation and expose daily cloud top at 0.7944. Bullish scenario is supported by Friday's close above 0.7874 (Fibo 38.2% of 0.8102/0.7732 descend) which now acts as support.
Res: 0.7897, 0.7911, 0.7917, 0.7944
Sup: 0.7874, 0.7863, 0.7849, 0.7817