
Sample Category Title
Trade Idea: GBP/USD – Hold short entered at 1.3315
GBP/USD – 1.3284
Original strategy :
Sold at 1.3315, Target:1.3115, Stop: 1.3375
Position: - Short at 1.3315
Target: - 1.3115
Stop: - 1.3375
New strategy :
Hold short entered at 1.3315, Target:1.3115, Stop: 1.3375
Position: - Short at 1.3315
Target: - 1.3115
Stop:- 1.3375
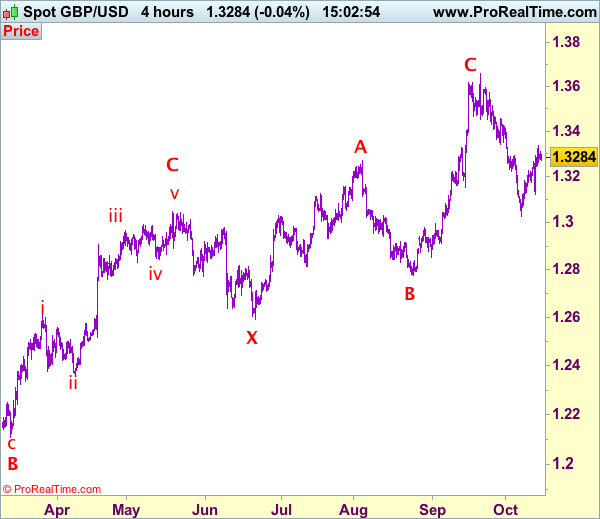
Although cable rose to as high as 1.3338 on Friday, the subsequent retreat has retained our near term bearishness and as long as resistance at 1.3338-43 holds, mild downside bias remains for another retreat, below 1.3245 would bring weakness to 1.3195-00 but only break of said support at 1.3121 would signal the rebound from 1.3027 has ended, bring weakness to 1.3065-75, then retest of said support at 1.3027.
In view of this, we are holding on to our short position entered at 1.3315. Above previous support at 1.3343 would abort and signal low has been formed instead, bring at least a correction of the fall from 1.3658 top to 1.3390-00 later. Our preferred count is that (pls see the attached chart) the wave IV is unfolding as a complex double three (ABC-X-ABC) correction with 2nd wave B ended at 1.2774, hence 2nd wave C could have ended at 1.3658.
Our preferred count on the daily chart is that cable's rebound from 1.3500 (wave (A) trough) is unfolding as a wave (B) with A ended at 1.7043, followed by triangle wave B and wave C as well as wave (B) has ended at 1.7192, the subsequent selloff is the larger degree wave (C) which is still unfolding with minor wave (III) of larger degree wave 3 ended at 1.1986, hence wave (IV) correction is in progress which could either be a triangle wave (IV) of a complex formation but upside should be limited to 1.3500 and price should falter well below 1.4000, bring another decline in wave (V) of 3 for weakness to 1.1500, then 1.1200.
Trade Idea: GBP/JPY – Stand aside
GBP/JPY - 148.55
New strategy :
Stand aside
Position: -
Target: -
Stop:-
As sterling found good support at 147.30 and rebounded late last week, suggesting further consolidation above 146.95 support would be seen and upside risk remains for the rebound from 146.95 to bring retracement of the fall from 152.85 to 149.90-00 and possibly test of resistance at 150.25 but still reckon upside would be limited to 150.90-00 and bring another decline next week.
On the downside, expect pullback to be limited to 148.00 and bring another rebound. Below 147.95-00 would suggest top is possibly formed, bring weakness towards said support at 147.30 but break there is needed to revive bearishness and bring retest of 146.95. Looking ahead, once this level is penetrated, this would confirm the fall from 152.85 top has resumed for retracement of recent upmove to 146.60-65 and then 146.00, having said that, loss of momentum should limit downside and previous support at 145.25 should remain intact.
Our preferred count is that larger degree wave V with circle is unfolding from 251.12 with wave (I) 219.34, (II): 241.38 and wave (III) is subdivided into 1: 192.60, 2: 215.89 (23 Jul 2008) and wave 3 ended at 118.87 earlier in 2009. The correction from there to 162.60 is wave 4 which itself is a double three and is labeled as first a-b-c ended at 151.53, followed by wave x at 139.03, 2nd a ended at 162.60, 2nd b at 146.75 and 2nd c leg of wave 4 ended at 163.00. Therefore, the decline from 163.00 to 116.85 is now treated as wave 5 which also marked the end of larger degree wave (III), hence wave (IV) major correction has commenced for retracement of the wave (III) from 241.38 and upside target at 183.95-00 (50% Fibonacci retracement of the wave (II) from 241.38) had been met, a drop below 160.00 would suggest wave (IV) has ended at 195.85, bring decline in wave (V) for initial weakness to 130 (already met) and 120.

Trade Idea: EUR/JPY – Sell at 132.70
EUR/JPY - 132.55
Original strategy:
Sell at 132.95, Target: 130.95, Stop: 133.55
Position: -
Target: -
Stop: -
New strategy :
Sell at 132.70, Target: 130.95, Stop: 133.30
Position: -
Target: -
Stop:-
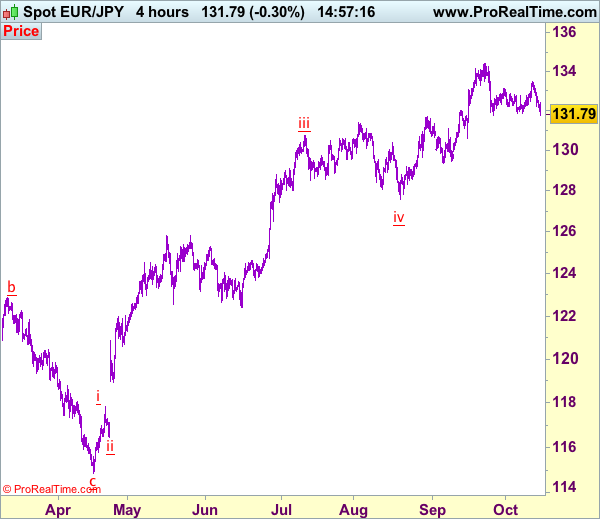
As the single currency has dropped again after brief recovery, suggesting the decline from 134.41 top is still in progress and bearishness remains for this move to bring retracement of recent upmove, hence further fall to 131.35-40, then 130.95-00 would be seen, however, near term oversold condition should limit downside to support at 130.62 and reckon psychological support at 130.00 would remain intact.
In view of this, we are looking to reinstate short on recovery as 132.70-75 should limit upside. Only above indicated resistance at 133.50 would abort and risk further gain towards 134.00 but only break there would signal the correction from 134.41 has ended at 131.75, bring retest of this recent high. Once this level is penetrated, this would confirm recent uptrend has resumed and extend headway to 135.00-10 and later 135.50-60.
Our latest preferred count is that wave (ii) is ABC-X-ABC which ended at 123.33 and wave (iii) is unfolding with wave iii ended at 100.77, followed by wave iv at 111.57 and wave v as well as the wave (iii) has ended at 97.04, followed by wave (iv) at 111.43 and wave (v) has ended at 94.12 which is also the end of the larger degree v, this also implied the major wave (C) has also ended there, hence major correction has commenced from there with (A) leg unfolding in its lower degree wave c which has possibly ended at 145.69. Under this count, A-B-C wave (B) has commenced with A leg ended at 136.23, wave B at 143.79 and wave C has possibly ended at 149.79.
Our larger degree count is that the decline from 139.26 is wave (C) and is sub-divided into a diagonal triangle i-ii-iii-iv-v with wave i - 105.44, wave ii- 123.33, wave iii - 97.03, wave iv - 111.43, followed by the final wave v as well as the end of wave (C) at 94.12, this also mark the bottom of larger degree wave B. Under this count, major rise in wave C has commenced as an impulsive wave with minor wave III ended at 145.69, wave V is still in progress for further gain to 150.00. Having said that, this so-called wave V could well be the first leg of larger degree 5-waver wave C and this wave C should bring at least a retest of wave A top at 169.97 (July 2008).
Trade Idea: AUD/USD – Hold short entered at 0.7875
AUD/USD – 0.7878
Original strategy:
Sold at 0.7875, Target: 0.7700, Stop: 0.7935
Position: - Short at 0.7875
Target: - 0.7700
Stop:- 0.7935
New strategy :
Hold short entered at 0.7875, Target: 0.7700, Stop: 0.7935
Position: - Short at 0.7875
Target: - 0.7700
Stop:- 0.7935
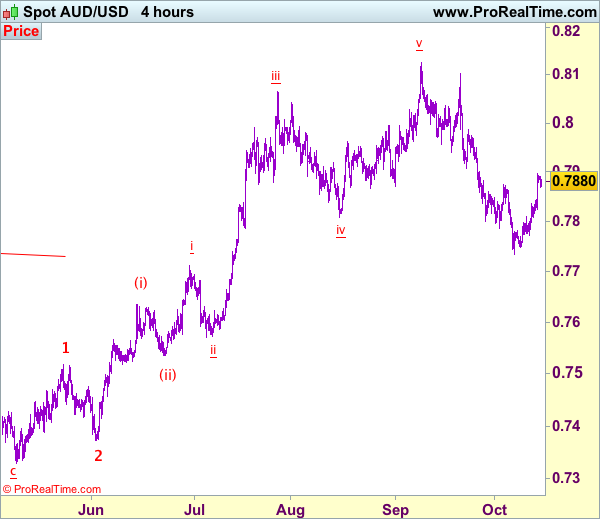
Friday’s late rise suggests the rebound from last week’s low of 0.7733 is still in progress and near term upside risk remains for marginal gain, however, as this move is viewed as retracement of recent decline, reckon upside would be limited and bring retreat later, below 0.7800 would bring test of 0.7770-75, break there would signal top is formed, then retest of said support at 0.7733 would follow, below there would confirm recent fall from 0.8125 top has resumed for weakness to 0.7700-10 and later towards 0.7660-65.
In view of this, we are holding on to our short position entered at 0.7875. Above previous support at 0.7908 (now resistance) would defer and risk a stronger rebound to 0.7950 but resistance at 0.7986 should remain intact and bring another decline later.
On the 4-hour chart, recent upmove from 0.7329 is unfolding as an impulsive rise with wave 3 as well as smaller degree wave (iii) extending, only minor wave v of (iii) has ended at 0.8125, hence bullishness remains for this move to extend headway to 0.8200, then towards 0.8300, however, reckon upside would be limited to 0.8400 and the final wave 5 should falter below 0.8500, bring correction later.
EUR/USD Candlesticks and Ichimoku Analysis
Weekly
• Last Candlesticks pattern: Shooting star
• Time of formation: 31 Jul 2017
• Trend bias: Near term up
Daily
• Last Candlesticks pattern: Shooting star
• Time of formation: 2 Aug 2017
• Trend bias: Up
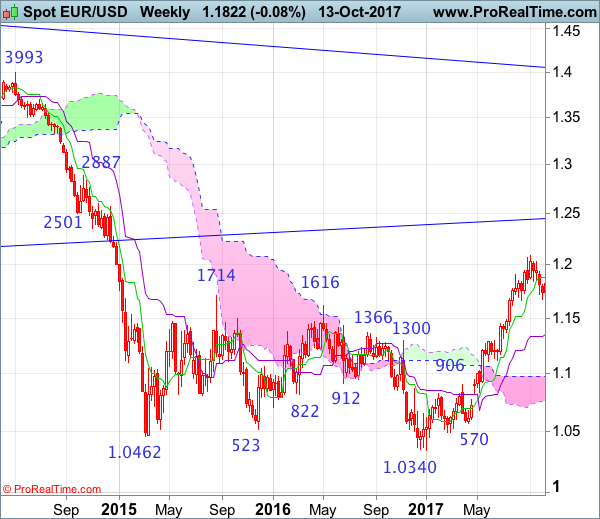
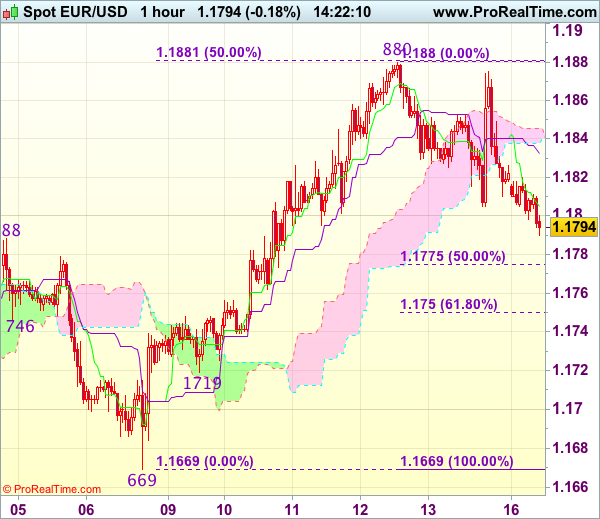
EUR/USD – 1.1800
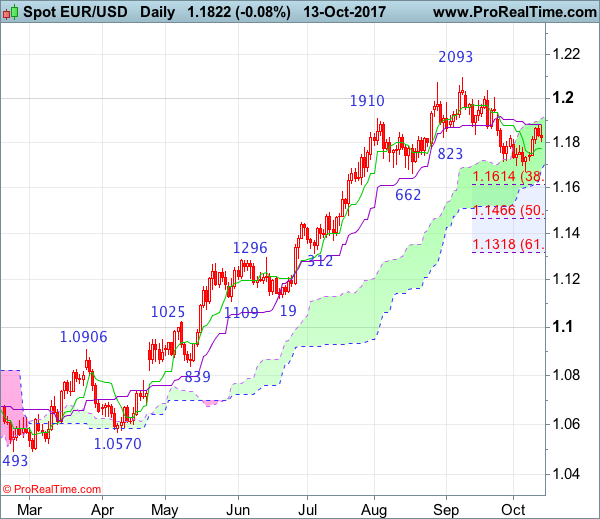
The single currency found good support at 1.1659 earlier this month and has staged a strong rebound, adding credence to our view that the fall from 1.2093 has formed a temporary low there and consolidation with mild upside bias is seen for test of 1.1875-80 (current level of the Kijun-Sen and last week’s high), however, break there is needed to retain bullishness and extend the rise from 1.1669 low to 1.1935-40, having said that, as broad outlook remains consolidative, reckon indicated resistance at 1.2005 would limit upside and price should falter below 1.2035, bring another retreat later.
On the downside, although initial pullback to the Tenkan-Sen (now at 1.1775) cannot be ruled out, reckon 1.1755-60 would hold and bring another rebound later. Only a drop below indicated support at 1.1662-69 would abort and signal the corrective decline from 1.2093 top is still in progress for retracement of early upmove to 1.1595-00, break there would bring subsequent fall to 1.1550, then towards 1.1500, having said that, previous support at 1.1479 should limit downside and 1.1466 (50% Fibonacci retracement of 1.0839-1.2093) should hold on first testing.
Recommendation: Buy at 1.1775 for 1.1975 with stop below 1.1675.
On the weekly chart, as euro has rebounded last week after finding support at 1.1669 and a white candlestick was formed, suggesting consolidation above this level would be seen with mild upside bias for gain to 1.1935-40, however, break of 1.2037 resistance is needed to retain bullishness and signal the pullback from 1.2093 has ended, bring retest of this level later. A break above there would extend recent rise from 1.0340 low to 1.2160-70 (50% Fibonacci retracement of 1.3993-1.0340) but loss of upward momentum should limit upside to 1.2220-30 and reckon 1.2300-10 would hold from here, price should falter well below 1.2390-00, bring another retreat later
On the downside, expect pullback to be limited to 1.1770-75 and last week’s ow at 1.1719 should remain intact, bring another rebound later. Only a drop below said support at 1.1669 would signal a temporary top has been formed at 1.2093, bring retracement of recent rise to 1.1610-15 (38.2% Fibonacci retracement of 1.0839-1.2093) and possibly towards 1.1550, having said that, downside should be limited to 1.1510-20 and 1.1460-70 (50% Fibonacci retracement) should remain intact, price should stay well above the Kijun-Sen (now at 1.1348, bring another rise.
USD/JPY Candlesticks and Ichimoku Analysis
Weekly
• Last Candlesticks pattern: Dark cloud cover
• Time of formation: 10 Jul 2017
• Trend bias: Down
Daily
• Last Candlesticks pattern: Evening doji
• Time of formation: 7 Aug 2017
• Trend bias: Down
USD/JPY – 111.85
The greenback only recovered to 112.83 before retreating again (missed our short entry at 113.10), adding credence to our view that a temporary top has possibly been formed at 113.44 earlier this month and consolidation with mild downside bias remains for test of support at 111.47, however, break there is needed to provide confirmation, bring retracement of recent rise to 111.10-15, having said that, reckon downside would be limited to the Kijun-Sen (now at 110.38) and 110.00 should hold, price should stay well above previous support at 109.55, bring rebound later.
On the upside, whilst recovery to 112.25-30 is likely, reckon the Tenkan-Sen (now at 112.57) would limit upside and resistance at 112.83 should hold, bring another retreat later. A daily close above 112.83 would bring retest of 113.44 but break there is needed to signal the rise from 107.32 low has resumed for correction of recent entire decline from 118.66, then gain to 114.00 and possibly towards 114.30-35 (61.8% Fibonacci retracement of 118.66-107.32) would follow, however, loss of upward momentum should prevent sharp move beyond resistance at 114.50 and price should falter well below 115.00.
Recommendation : Sell at 112.70 for 110.70 with stop above 113.70
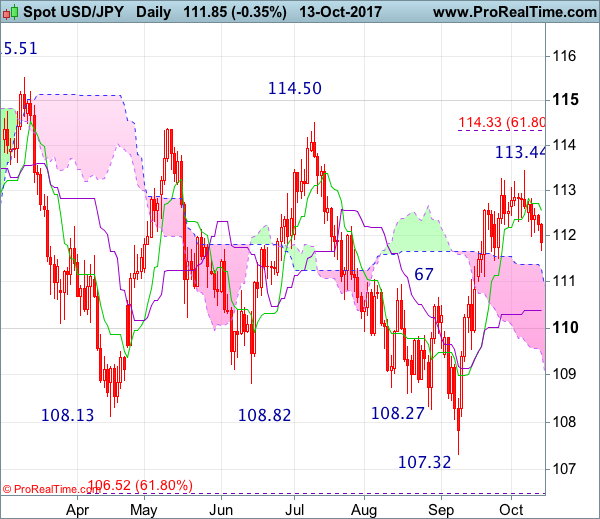
On the weekly chart, after forming a doji star at 113.44, last week black candlestick adds credence to our view that a minor top is possibly formed there and consolidation with mild downside bias remains for weakness to support at 111.47, then test of the Kijun-Sen (now at 110.91), however, only a weekly close below there would confirm and bring retracement of the rise from 107.32 to the Tenkan-Sen (now at 110.38) and then 109.90-95 but still reckon support at 109.55 would contain downside and bring another rise later.
On the upside, expect recovery to be limited to 112.80-85 and bring another retreat. Above said resistance at 113.44 would extend the aforesaid rise from 107.32 to 114.00, then 114.30-35 (61.8% Fibonacci retracement) but resistance at 114.50 should limit upside and psychological level at 115.00 should hold from here, bring retreat later.
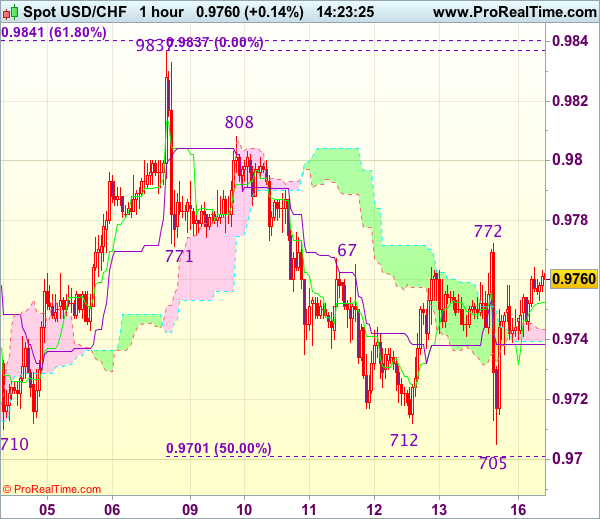
Trade Idea : USD/CHF – Hold short entered at 0.9755
USD/CHF - 0.9761
Most recent candlesticks pattern : N/A
Trend : Near term down
Tenkan-Sen level : 0.9753
Kijun-Sen level : 0.9739
Ichimoku cloud top : 0.9743
Ichimoku cloud bottom : 0.9740
Original strategy :
Sold at 0.9755, Target: 0.9655, Stop: 0.9775
Position : - Short at 0.9755
Target : - 0.9655
Stop : - 0.9775
New strategy :
Hold short entered at 0.9755, Target: 0.9655, Stop: 0.9775
Position : - Short at 0.9755
Target : - 0.9655
Stop : - 0.9775
Although the greenback fell briefly to 0.9705 late last week, lack of follow through selling on break of previous support at 0.9710-12 and the subsequent strong rebound suggest consolidation above said support would be seen, however, as long as resistance at 0.9772 (Friday’s high) holds, bearishness remains for recent decline to resume after consolidation, below said support at 0.9705 would signal the decline from 0.9837 top has resumed and extend weakness to 0.9669-70 (61.8% Fibonacci retracement of 0.9565-0.9837 and previous support) but previous support at 0.9642 should remain intact.
In view of this, we are holding on to our short position entered at 0.9755. Above said resistance at 0.9772 would defer but only break of resistance at 0.9808 would signal low is formed and indicate the pullback from 0.9837 has ended, bring retest of this level later.
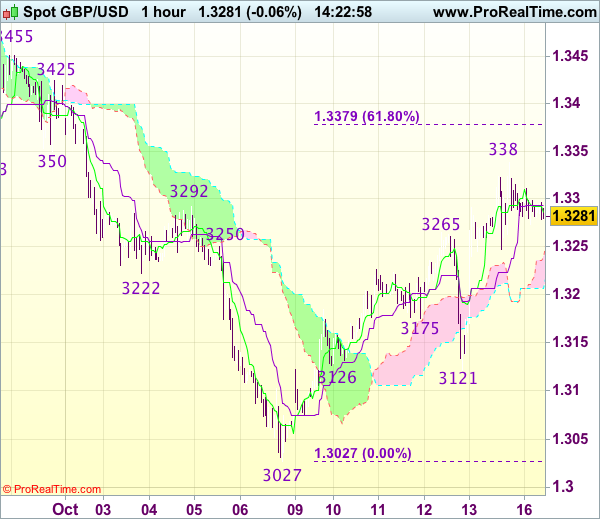
Trade Idea : GBP/USD – Hold long entered at 1.3250
GBP/USD - 1.3280
Most recent candlesticks pattern : N/A
Trend : Near term up
Tenkan-Sen level : 1.3284
Kijun-Sen level : 1.3293
Ichimoku cloud top : 1.3239
Ichimoku cloud bottom : 1.3206
Original strategy :
Bought at 1.3250, Target: 1.3350, Stop: 1.3245
Position : - Long at 1.3250
Target : - 1.3350
Stop : - 1.3245
New strategy :
Hold long entered at 1.3250, Target: 1.3350, Stop: 1.3245
Position : - Long at 1.3250
Target : - 1.3350
Stop : - 1.3245
As the British pound has eased after Friday’s brief rise to 1.3338, suggesting minor consolidation below this level would be seen, however, as long as 1.3245-50 holds, bullishness remains for the rise from 1.3027 low to bring a stronger retracement of recent decline, hence gain to 1.3345-50 and then 1.3375-80 (61.8% Fibonacci retracement of 1.3596-1.3027), however, overbought condition should limit upside to 1.3400-10, bring another retreat later.
In view of this, we are holding on to our long position entered at 1.3250. Below 1.3245 would defer and risk test of the Kijun-Sen (now at 1.3223), break there would defer and suggest top is formed, bring weakness to 1.3200, then towards 1.3175 but said support at 1.3121 should remain intact.
Trade Idea : EUR/USD – Stand aside
EUR/USD - 1.1793
Most recent candlesticks pattern : N/A
Trend : Near term up
Tenkan-Sen level : 1.1805
Kijun-Sen level : 1.1833
Ichimoku cloud top : 1.1846
Ichimoku cloud bottom : 1.1838
New strategy :
Stand aside
Position : -
Target : -
Stop : -
Despite Friday’s rebound to 1.1875, as the single currency has retreated after faltering below resistance at 1.1880, suggesting further consolidation below this last week’s high would be seen and pullback to 1.1775 (50% Fibonacci retracement of 1.1669-1.1880) cannot be rued out, however, reckon 1.1745-50 (61.8% Fibonacci retracement) would limit downside and bring rebound later.
On the upside, expect recovery to be limited to 1.1820-25 and 1.1850 should hold, bring another retreat later. Above 1.1850 would suggest the pullback from 1.1880 has ended and revive bullishness for retest of 1.1880, break there would confirm recent upmove from 1.1669 low has resumed for headway to 1.1895-00 (61.8% Fibonacci retracement of 1.2035-1.1669) first. As near term outlook is mixed, would be prudent to stand aside in the meantime.
Euro Failed Near Important Resistance Vs US Dollar
Key Highlights
- The Euro after an upside move faced sellers near 1.1880 against the US Dollar.
- A crucial bearish trend line with resistance at 1.1870 on the 4-hours chart of EUR/USD prevented gains.
- China’s Consumer Price Index in Sep 2017 increased 0.5% (MoM), more than the +0.4% forecast.
- The yearly change in the Chinese CPI was +1.6%, just as the market forecast.
EURUSD Technical Analysis
The Euro recovered well from the 1.1660 against the US Dollar and above 1.1800. The EUR/USD pair failed near 1.1880 and is currently correcting lower.
The recent failure near 1.1880 was important since a crucial bearish trend line with resistance at 1.1870 on the 4-hours chart acted as a barrier for buyers. Moreover, the pair failed to break the 200 simple moving average around 1.1885 (4-hour, green) and started a downside move.
The pair has already moved below the 23.6% Fib retracement level of the last wave from the 1.1669 low to 1.1879 high. On the downside, the 100 simple moving average around 1.1885 (4-hour, red) is at 1.1800 to act as a support.
However, the most important support is near the 50% Fib retracement level of the last wave from the 1.1669 low to 1.1879 high at 1.1770. The pair is likely to find bids near 1.1770 in the short term. To the topside, the 200 SMA might continue to prevent gains above 1.1880 in the near term.
China’s Consumer Price Index
Today, the Chinese Consumer Price Index for Sep 2017 was released by the National Bureau of Statistics of China. The forecast was slated for a rise of 0.4% in the CPI compared with the previous month.
The actual result was better than the forecast, as there was an increase of 0.5% in the CPI in Sep 2017. Looking at the yearly change, the forecast was an increase of 1.6% and the actual was similar. Considering the Producer Price Index, the market was looking for an increase of 6.3% in Sep 2017 compared with the same month a year ago.
Once again, the actual was better, as the PPI rose 6.9% in Sep 2017. The market sentiment improved after the release, but the EUR/USD pair is likely to correct further towards 1.1770.