Sample Category Title
Gold Facing A Tough Resistance
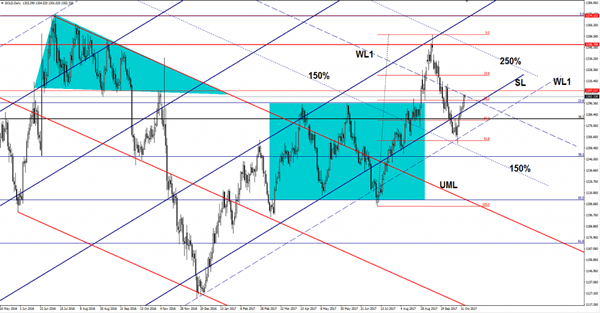
Price decreased a little today after the Friday's impressive rally, but the bias remains bullish on the short term. It could climb much higher on the short term if will have enough energy to close above the WL1 of the descending pitchfork. Gold has climbed much above the $1300 per ounce, signaling that the bulls are still very strong on the short term.
USD/CAD Buying Opportunity?
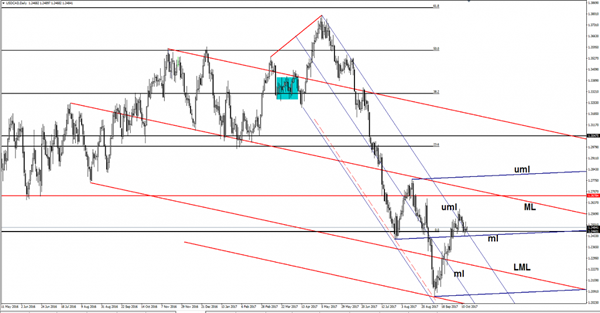
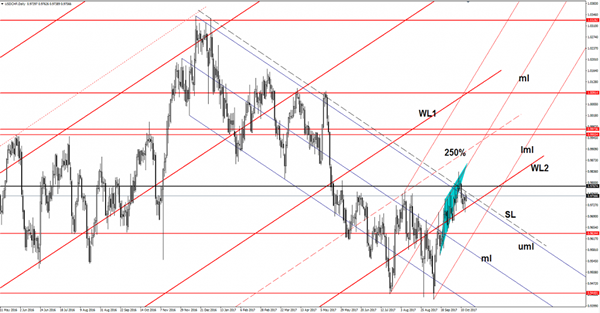
The USD/CAD increased and looks poised to start another upside momentum. Technically, it should climb much higher after the false breakdown below the upper median line (uml) of the minor descending pitchfork and after the retest of the median line (ml) of the minor blue ascending pitchfork. The bulls could take the lead again after the failure to close on the median line (ml).
USD/CHF Trading In The Green
The USD/CHF increased in the early morning and tries to take out an important resistance level. Price surged as the USDX has managed to increase a little as well. The dollar index maintains a bullish perspective on the short term despite the minor drop.
USDX was expected to drop after the false breakout above the 93.81 static resistance, but failed to approach and reach the 92.49 static support, signaling that the bulls could take the lead again very soon.
The dollar index failed to retest a dynamic support as well, showing a minor oversold on the Daily chart. The greenback decreased a little on Friday as the US data have disappointed, but a USDX’s increase will force the USD to pick up again. Technically, the USDX is expected to increase and to jump above the 93.81 major static resistance.
Price increased as is very close to erase the Friday’s losses. Right now is pressuring the upper median line (uml) of the descending pitchfork and could hit the outside sliding line again. Technically, it could breakout above the sliding line (SL) after the false breakdown below the WL2 and after the failure to close on this major dynamic support.
Resistance can be found at the 0.9787 level as well, so only a valid breakout above this level will confirm a further increase in the upcoming period. On the other hand, a drop will be validated after the valid breakdown below the WL2 of the ascending pitchfork.
GBP/USD Daily Outlook
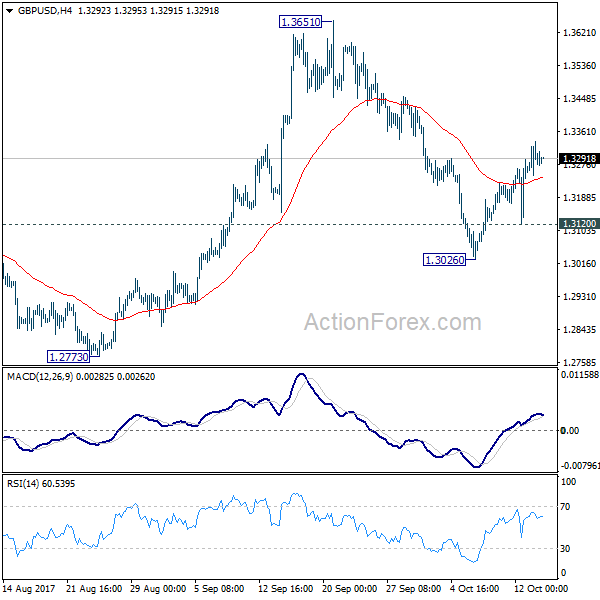
Daily Pivots: (S1) 1.3239; (P) 1.3288; (R1) 1.3331; More....
Intraday bias in GBP/USD remains mildly on the upside. Rebound from 1.3026 would target 1.3651 resistance. Break there will resume medium term rise from 1.1946 and target 1.3835 key resistance next. On the downside, below 1.3120 minor support will resume the fall from 1.3651 through 1.3026 instead.
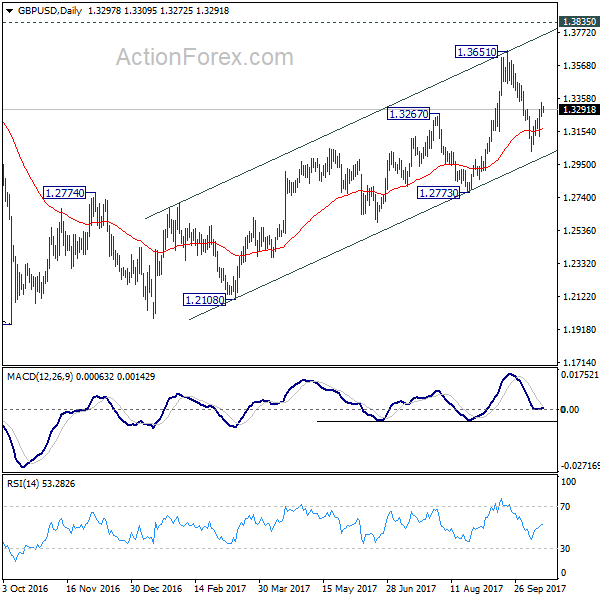
In the bigger picture, while the medium term rebound from 1.1946 was strong, GBP/USD hit strong resistance from the long term falling trend line. Outlook is turned a bit mixed and we'll turn neutral first. On the downside, decisive break of 1.2773 key support will argue that rebound from 1.1946 has completed. The corrective structure of rise from 1.1946 to 1.3651 will in turn suggest that long term down trend is now completed. Break of 1.1946 low should then be seen. On the upside, break of 1.3835 support turned resistance will revive the case of trend reversal and target 38.2% retracement of 2.1161 (2007 high) to 1.1946 (2016 low) at 1.5466.
EUR/USD Daily Outlook
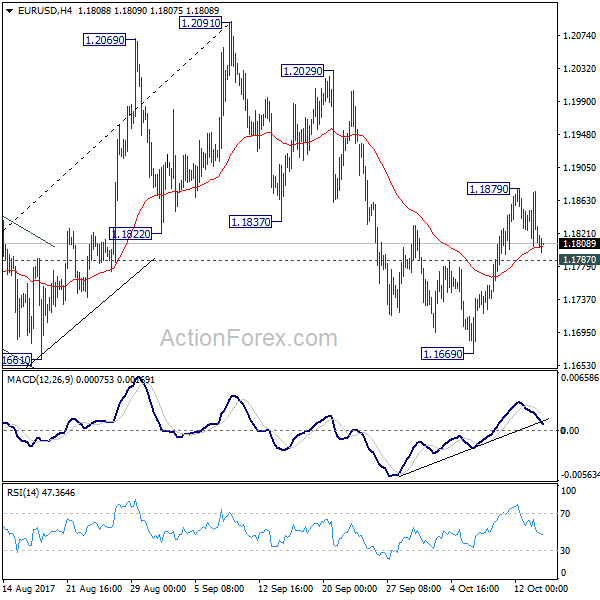
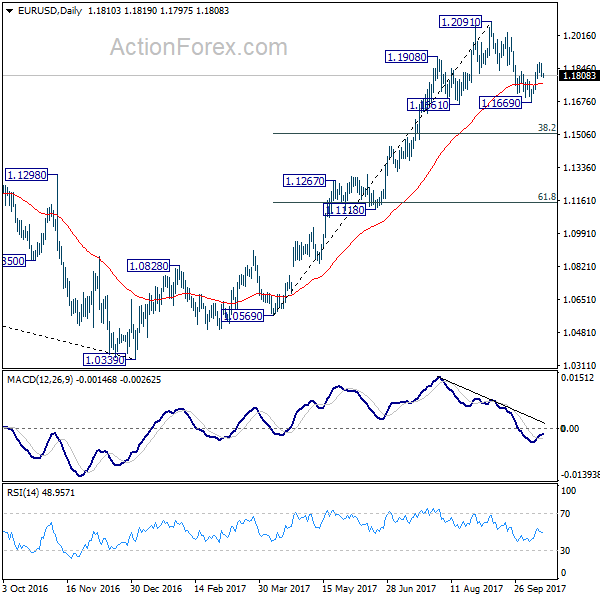
Daily Pivots: (S1) 1.1789; (P) 1.1832 (R1) 1.1860; More...
Intraday bias in EUR/USD remains neutral for the moment. At this point, we're slightly favoring the case that pull back from 1.2091 has completed at 1.1669, ahead of 1.1661 support. Above 1.1879 will turn bias back to the upside for retesting 1.2091 high. However, break of 1.1787 will dampen this view. Intraday bias will be turned back to the downside through 1.1669 low. Correction from 1.2091 would then extend to 38.2% retracement of 1.0569 to 1.2091 at 1.1510 and completes there.
In the bigger picture, rise from medium term bottom at 1.0339 is not finished yet. It's expected to continue after pull back from 1.2091 completes. And, next target will be 38.2% retracement of 1.6039 (2008 high) to 1.0339 (2017 low) at 1.2516. However, it should be noted that there is no confirmation of trend reversal yet. That is, such rebound from 1.0399 could be a correction. And the long term fall from 1.6039 (2008 high) could resume. Hence, we'd be cautious on strong resistance from 1.2516 to limit upside.
USD/CHF Daily Outlook
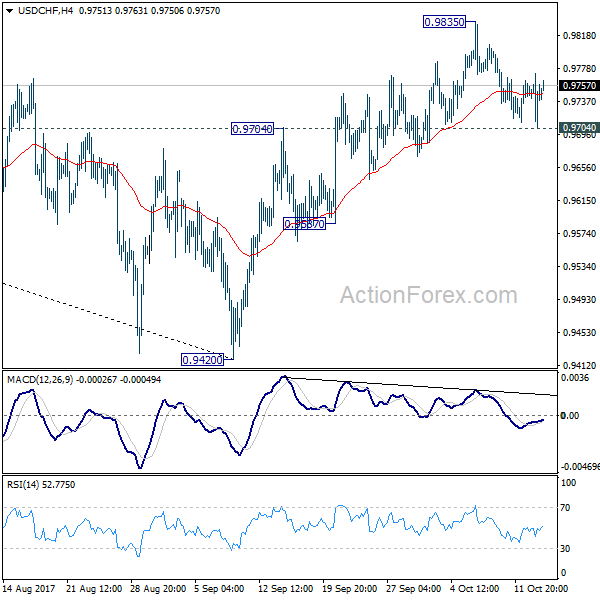
Daily Pivots: (S1) 0.9707; (P) 0.9739; (R1) 0.9774; More....
Intraday bias in USD/CHF remains neutral with focus on 0.9704 resistance turned support. Considering bearish divergence condition in 4 hour MACD, break of 0.9704 will argue that rebound from 0.9420 has completed. This will also mixed up the near term outlook and turn bias back to the downside for 0.9587 support. On the upside, break of 0.9835 will extend the rebound to 61.8% retracement of 1.0342 to 0.9420 at 0.9990.
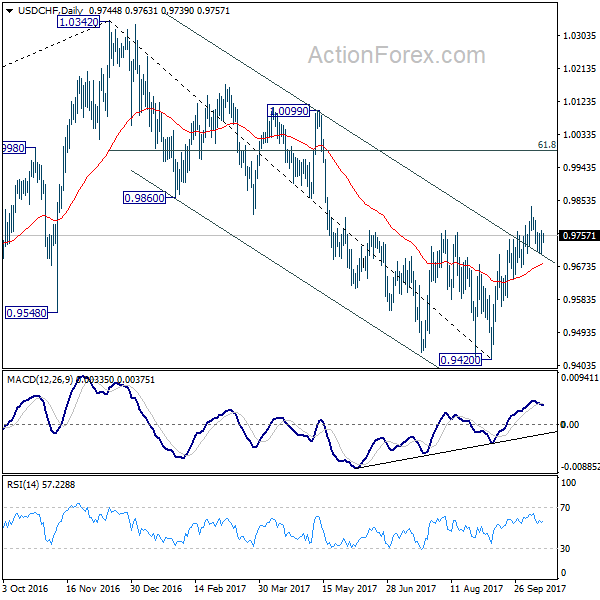
In the bigger picture, current development suggests that USD/CHF has defended 0.9443 (2016 low) key support level again. Rise from 0.9420 could develop into a medium term move and target a test on 1.0342 high. This represents the upper end of a long term range that started back in 2015. On the downside, break of 0.9587 support is now needed to indicate completion of the rise from 0.9420. Otherwise, further rally will remain in favor in medium term.
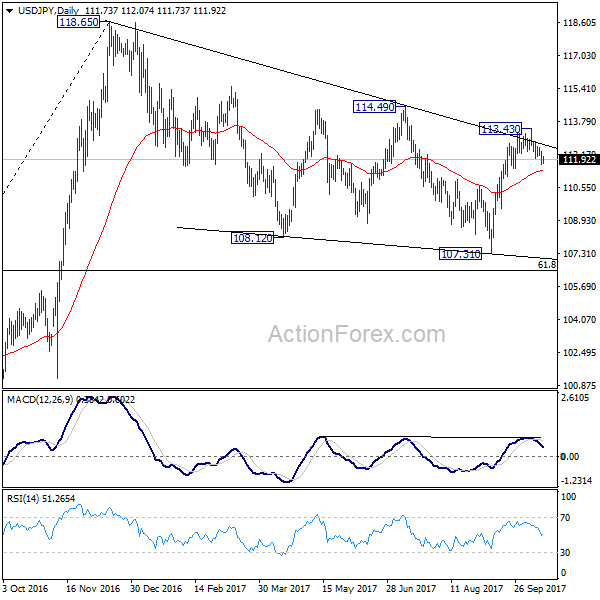
USD/JPY Daily Outlook
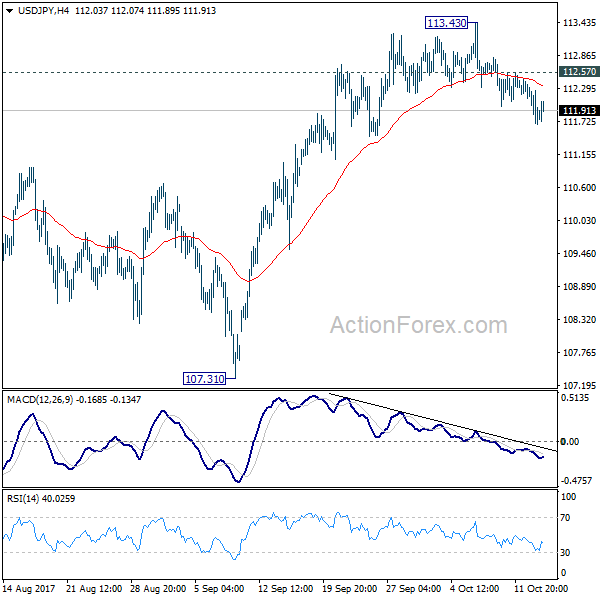
Daily Pivots: (S1) 111.57; (P) 111.94; (R1) 112.19; More...
Intraday bias in USD/JPY remains on the downside with 112.57 minor resistance intact. Fall from 113.43 short term top would target EMA (now at 111.37) first. As whole rebound from 107.31 is likely completed, sustained trading below 55 day EMA will target 107.31 low and below. In that case, we'd expect strong support from 61.8% retracement of 98.97 to 118.65 at 106.48 to contain downside and bring rebound. On the upside, above 112.57 minor resistance will turn intraday bias neutral first. But risk will stays on the downside as long as 113.43 resistance holds.
In the bigger picture, rise from 98.97 (2016 low) is seen as the second leg of the corrective pattern from 125.85 (2015 high). It's unclear whether this second leg has completed at 118.65 or not. But medium term outlook will be mildly bearish as long as 114.49 resistance holds. And, there is prospect of breaking 98.97 ahead. Meanwhile, break of 114.49 will bring retest of 125.85 high. But even in that case, we don't expect a break there on first attempt.
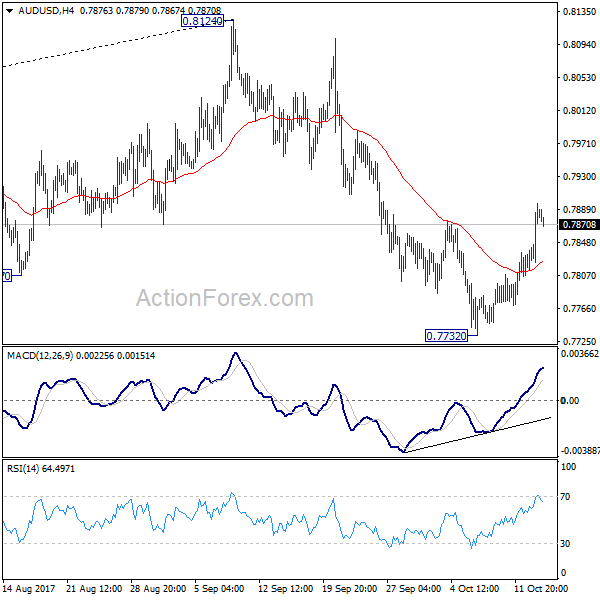
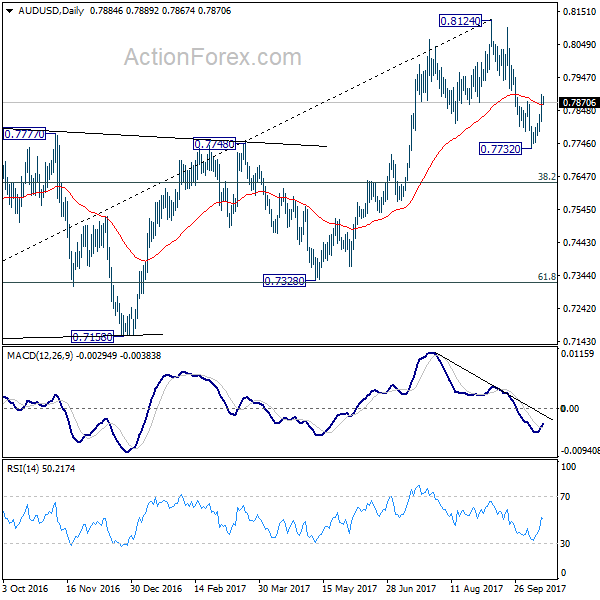
AUD/USD Daily Outlook
Daily Pivots: (S1) 0.7834; (P) 0.7866; (R1) 0.7918; More...
Intraday bias in AUD/USD remains mildly on the upside for the moment. Rebound from 0.7732 short term bottom could extend to retest 0.9124 high. But we'd be cautious on strong resistance from there to limit upside and bring another fall to extend the corrective pattern. On the downside, break of 0.7732 will target medium term fibonacci level at 0.7628 first.
In the bigger picture, rise from 0.6826 medium term bottom is seen as corrective pattern. Current development suggests that it might be completed with three waves up to 0.8124 already. Break of 38.2% retracement of 0.6826 to 0.8124 at 0.7628 will firm this bearish case. And, decisive break of 0.7328 key cluster support (61.8% retracement at 0.7322) will confirm and bring retest of 0.6826 low. In case rise from 0.6826 resumes and extends, strong resistance should be seen at 38.2% retracement of 1.1079 to 0.6826 at 0.8451 to limit upside.
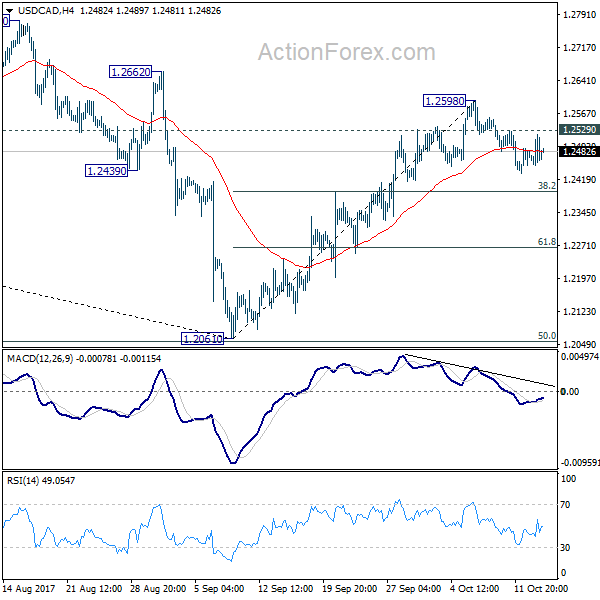
USD/CAD Daily Outlook
Daily Pivots: (S1) 1.2439; (P) 1.2479; (R1) 1.2507; More....
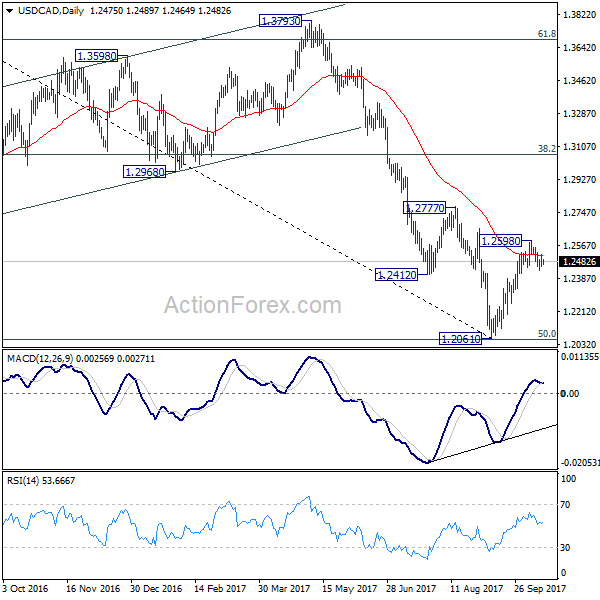
No change in USD/CAD's outlook. With 1.2529 minor resistance intact, pull back from 1.2598 could extend lower to 38.2% retracement of 1.2061 to 1.2598 at 1.2393, or even further to 61.8% retracement at 1.2266. But we'll look for bottoming sign below 1.2266. Break of 1.2061 low is not anticipated for now. On the upside, break of 1.2529 minor resistance will resume the rise from 1.2061 for 1.2777 resistance.
In the bigger picture, USD/CAD should have defended 50% retracement of 0.9406 (2011 low) to 1.4869 (2016 high) at 1.2048. And with 1.2048 intact, we'd favor the case that fall from 1.4689 is a correction. Break of 1.2777 will further affirm this bullish case. That is, larger up trend from 0.9406 is not completed. And in that case, USD/CAD should target 1.3793 resistance next. However, on the other hand, firm break of 1.2048 will indicate that fall from 1.4689 is at least a medium term down trend and should target 61.8% retracement at 1.1424 and below.
EUR/JPY Daily Outlook
Daily Pivots: (S1) 131.90; (P) 132.42; (R1) 132.70; More...
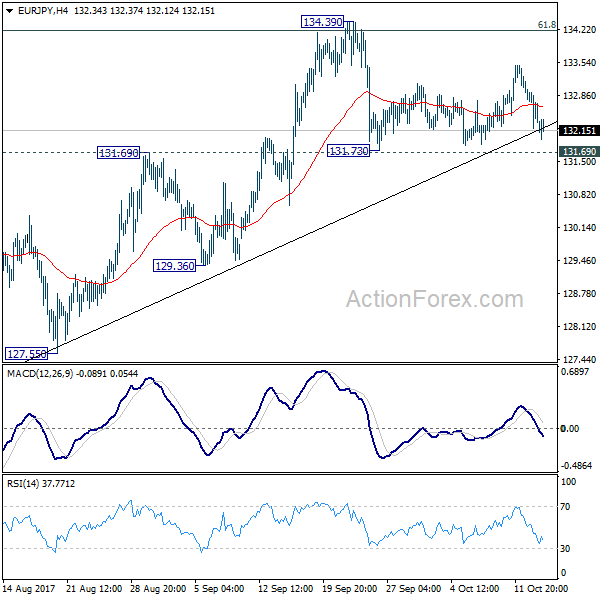
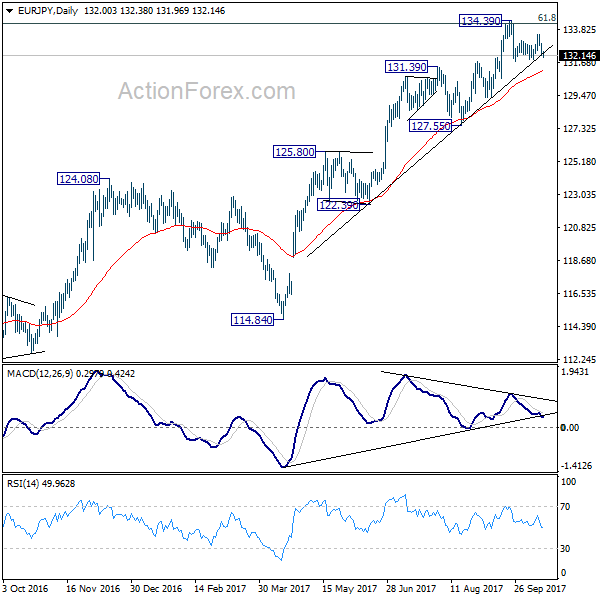
Intraday bias in EUR/JPY remains neutral at this point. But again, it's getting more likely that 134.39 is a medium term top and a downside breakout could be seen soon. Focus is on 131.69 support. Decisive break there will be an early sign of medium term reversal and will target 127.55 key support level. On the upside, firm break of 134.39 is needed to confirm up trend resumption. Otherwise, more corrective trading would be seen.
In the bigger picture, medium term rise from 109.03 (2016 low) is seen as at the same degree as the down trend from 149.76 (2014 high) to 109.03 (2016 low). 61.8% retracement of 149.76 to 109.03 at 134.20 is already met. Sustained break there will pave the way to key long term resistance zone at 141.04/149.76. However, break of 127.55 support will argue that the medium term trend has reversal and will turn outlook bearish for deeper fall.