Sample Category Title
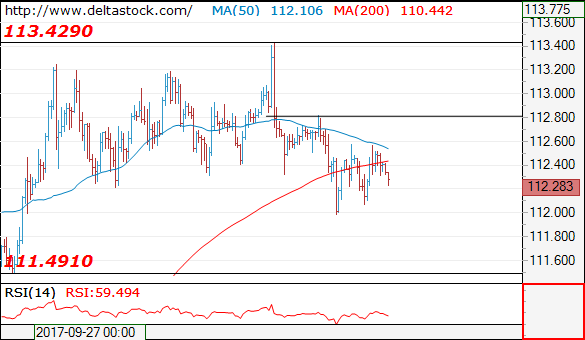
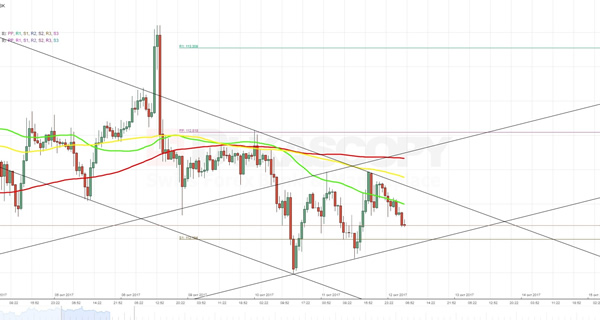
Technical Outlook: USDJPY Looks Another Attack At Key 112.00/111.83 Supports
The pair stands at the back foot on Thursday and on track for renewed attack at 112.00 support, following strong rejections here in past two days.
Fresh easing is probing below 20SMA (112.19) after past two days bearish attempts failed to close below and generate initial bearish signal. Additional pressure comes from softer US dollar following dovish tone from Fed's minutes which may result in final break below triggers at 112.00 and 200SMA (111.83).
Close below the latter will be seen as strong bearish signal and could trigger acceleration towards 111.47 trough and 100 SMA/Fibo 38.2% of 107.31/113.43 at 111.09.
The upside remains capped by 10 SMA (currently at 112.61) and only sustained break above here would sideline persisting downside risk.
Res: 112.61, 112.82, 113.25, 113.43
Sup: 112.19, 112.00, 111.83, 111.47
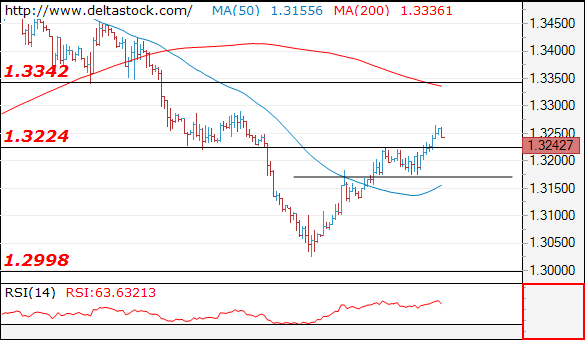
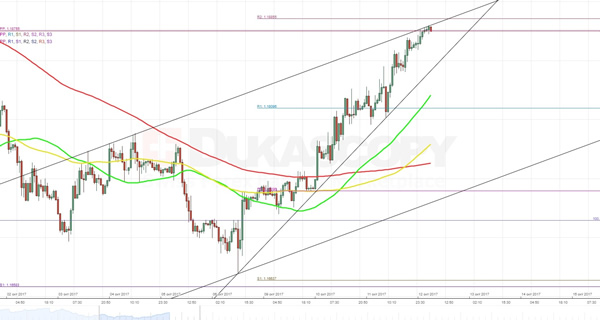
Technical Outlook: GBPUSD – Extended Bulls May Take A Breather Under Strong Fibo Barrier At 1.3266
Cable met its target and strong barrier at 1.3266 (Fibo 38.2% of 1.3655/1.3026 descend) on Thursday as recovery rally from 1.3026 low extends into fourth straight day. Softer dollar on Fed's divided view on inflation helped pound but bulls face headwinds at 1.3266 pivot and the pair may stay some time in consolidation before fresh attempts higher. Broken 10SMA which now acts as initial support at 1.3214 and top of thick daily cloud at 1.3200 are expected to contain dips. Otherwise, stronger bearish signals could be expected on sustained break below 1.3200/1.3175 supports.
Res: 1.3266, 1.3318, 1.3341, 1.3400
Sup: 1.3225, 1.3214, 1.3200, 1.3175
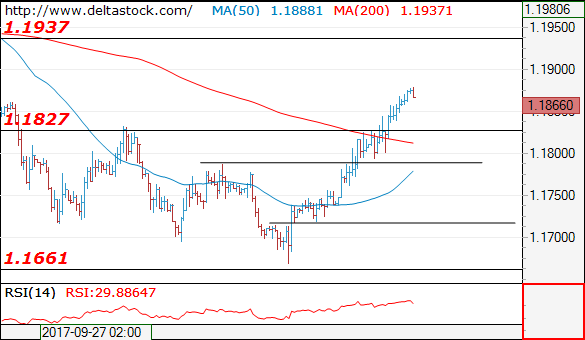
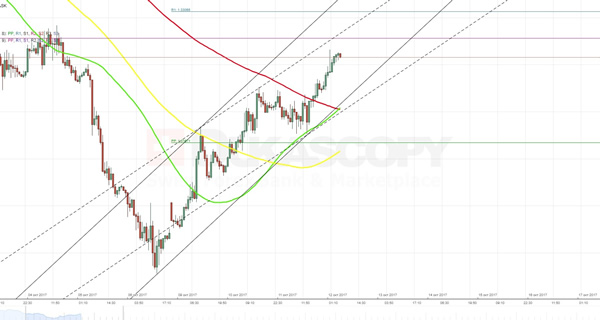
Technical Outlook: EURUSD Approaches Daily Cloud Top As Bulls Were Further Boosted By Slightly Dovish Fed Minutes
The Euro remains well supported and met target at1.1880 (daily Kijun-sen), approaching key barrier at 1.1893 (daily Ichimoku cloud top).
The single currency extended strong rally on Wednesday, after the minutes of Fed's latest policy meeting showed a number of policymakers is concerned about stubbornly low inflation, looking for upcoming US CPI data to get more evidence about possible changes.
Divided views of board members regarding further tightening in light of persistently low inflation was seen by markets as slightly dovish that kept the dollar at the back foot and offered further support to the Euro.
Technical outlook has further improved on Wednesday's fresh extension of recovery leg from 1.1669 which closed above 20 / 55 SMA's and threatening daily cloud top which marks key near-term barrier.
Sustained lift above the cloud will be seen as strong bullish signal and shift near-term bias higher.
However, bulls may how hesitation as slow stochastic is overbought on daily chart.
Dips will be seen as buying opportunity while broken 20SMA (1.1830) holds.
From the fundamental side, release of EU Industrial Production for Aug (0.5% f/c vs 0.1% prev) and speech of ECB president Mario Draghi will be the key events for the Euro today.
Res: 1.1880, 1.1893, 1.1930, 1.1992
Sup: 1.1842, 1.1830, 1.1795, 1.1781
Trade Idea: GBP/USD – Sell at 1.3315
GBP/USD – 1.3240
Original strategy :
Sell at 1.3280, Target:1.3080, Stop: 1.3340
Position: -
Target: -
Stop: -
New strategy :
Sell at 1.3315, Target:1.3115, Stop: 1.3375
Position: -
Target: -
Stop:-
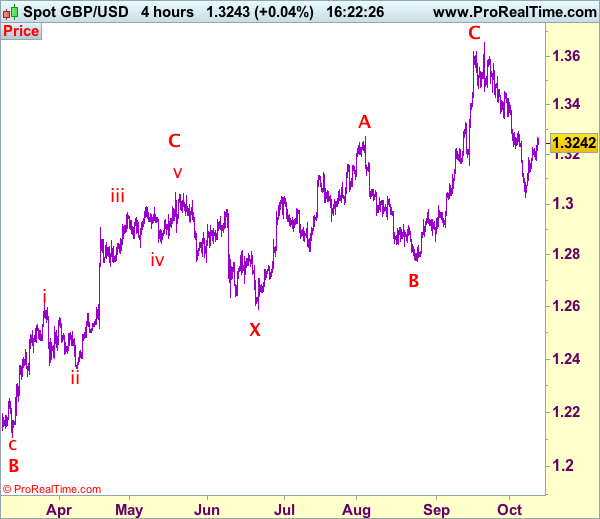
Although cable has eased again after rising to 1.3265, reckon pullback would be limited to 1.3200 and near term upside risk remains for the rebound from 1.3027 (last week’s low) to bring retracement of recent decline, hence gain to resistance at 1.3292 cannot be ruled out, however, reckon upside would be limited to 1.3315-20 and bring retreat later, below support at 1.3175 would signal topic formed, bring weakness to 1.3125-30, break there would suggest the rebound from 1.3027 has ended and bring further fall to 1.3075, then retest of said support at 1.3027, break there would confirm the fall from 1.3658 top has resumed, bring test of psychological support at 1.3000, then towards 1.2970.
In view of this, we are still looking to sell cable on further subsequent recovery as 1.3315-20 should limit upside, bring another decline later. Above previous support at 1.3343 would abort and signal low has been formed instead, bring at least a correction of the fall from 1.3658 top to 1.3390-00 later. Our preferred count is that (pls see the attached chart) the wave IV is unfolding as a complex double three (ABC-X-ABC) correction with 2nd wave B ended at 1.2774, hence 2nd wave C could have ended at 1.3658.
Our preferred count on the daily chart is that cable's rebound from 1.3500 (wave (A) trough) is unfolding as a wave (B) with A ended at 1.7043, followed by triangle wave B and wave C as well as wave (B) has ended at 1.7192, the subsequent selloff is the larger degree wave (C) which is still unfolding with minor wave (III) of larger degree wave 3 ended at 1.1986, hence wave (IV) correction is in progress which could either be a triangle wave (IV) of a complex formation but upside should be limited to 1.3500 and price should falter well below 1.4000, bring another decline in wave (V) of 3 for weakness to 1.1500, then 1.1200.
Forex Technical Analysis: EUR/USD, USD/JPY, GBP/USD
EUR/USD
Current level - 1.1866
The intraday bias here is positive, for a break through 1.1785 hurdle, for a tight test of 1.1830 major resistance. Crucial on the downside is 1.1720.
| Resistance | Support | ||
| intraday | intraweek | intraday | intraweek |
| 1.1785 | 1.1830 | 1.1720 | 1.1660 |
| 1.1830 | 1.2070 | 1.1660 | 1.1480 |
USD/JPY
Current level - 112.28
The outlook remains bearish, for a slide towards 111.50 zone. Crucial on the upside is 112.80.
| Resistance | Support | ||
| intraday | intraweek | intraday | intraweek |
|
112.80 |
113.80 |
112.00 |
111.50 |
|
113.80 |
114.50 |
111.50 |
107.30 |
GBP/USD
Current level - 1.3242
The violation of 1.3220 resistance signals a further appreciation towards 1.3340 area. Crucial on the downside is 1.3170.
| Resistance | Support | ||
| intraday | intraweek | intraday | intraweek |
|
1.3340 |
1.3340 |
1.3170 |
1.2910 |
|
1.3340 |
1.3650 |
1.3020 |
1.2760 |
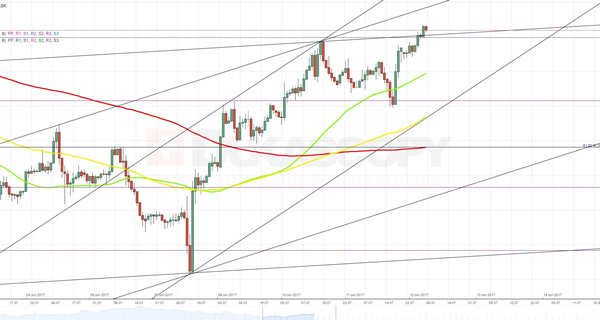
EURUSD Analysis: Soars To Monthly PP At 1.1875
The common European currency continues to advance against the US Dollar four days in a row, fluctuating in a junior ascending channel. As some of the FOMC members were still uncertain about necessity of interest rate hike in December, the pair gained an impulse to reach the monthly PP at 1.1875. The fact that an average market sentiment became 69% bearish points out on an upcoming turnaround. Similar signal show certain technical indicators suggesting that the rate is overbought. On the other hand, there is a need to take into account that the pair is also moving and tends to reach the upper boundary of a large descending channel. In other words, whether the rate makes a rebound on continues the surge will greatly depend on the US PPI release and reaction on Mario Draghi speech.
GBPUSD Analysis: Bypasses 200-Hour SMA
In accordance with expectations, the currency exchange rate was consolidating before a release of the Fed meeting minutes. But as soon as this document was released, the pair expectedly sneaked through the 200-hour SMA and started to surge.
The fact that road to the south is obstructed not only by a combination of the 55- and 200-hour SMAs but also by the 100-hour SMA and the weekly PP suggests that the Greenback is unlikely to restore lost positions against the Pound even in case of better than expected US PPI data release. Accordingly, traders with bullish outlook most probably are going to try to push the pair to the area between the 1.3300 mark and the monthly PP at the 1.3320 by the end of the week.
USDJPY Analysis: Fails To Break Above 112.60
As it was expected, after reaching the weekly S1 at 112.19 traders tried to push the rate to the top. However, a combined resistance formed by the 55-, 100- and 200-hour SMAs in conjunction with the weekly PP at 112.81 expectedly neutralized this attempt. Moreover, the released FOMC meeting minutes showed some uncertainty regarding the need on another interest rate hike this year, which additionally devaluated the buck against all other major currencies. These facts suggest that the pair is unlikely to break in the northern direction today as well even if the US PPI will appear to be better than analysts expected. In support of this scenario speaks the fact that the average market sentiment remains 63% bearish. Plus the pair has formed a new descending channel.
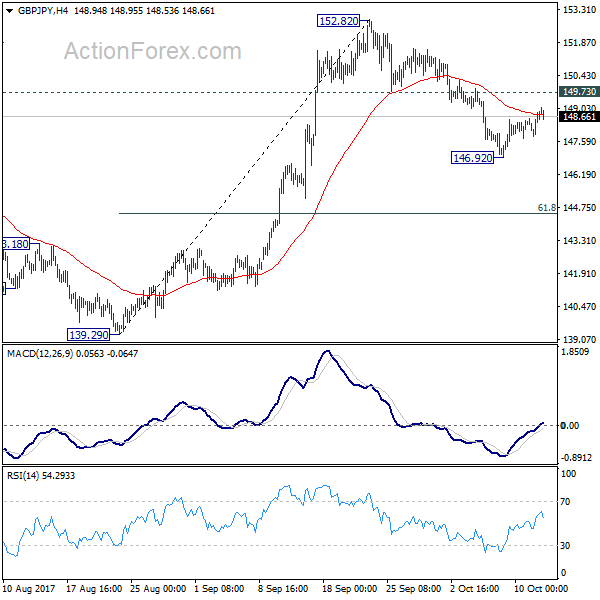
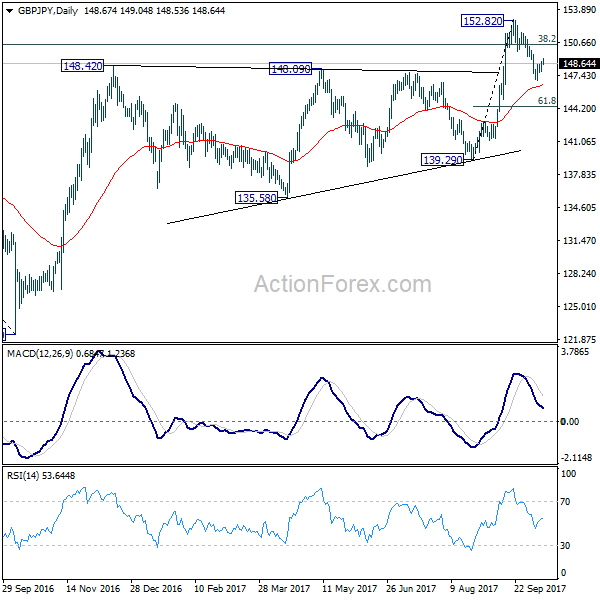
GBP/JPY Daily Outlook
Daily Pivots: (S1) 148.11; (P) 148.48; (R1) 149.12; More
Intraday bias in GBP/JPY remains neutral for consolidation above 146.92 temporary low. Another decline is expected with 149.73 intact. Below 146.92 will target 61.8% retracement of 139.29 to 152.82 at 144.45. Such decline is seen as a correction and we'd look for strong support from 144.45 to bring rebound. On the upside, break of 149.73 support turned resistance will argue that the pull back is completed and turn bias back to the upside for retesting 152.82 high. However, sustained break of 144.45 will put 139.29 key support in focus.
In the bigger picture, medium term rebound from 122.36 is still expected to resume after corrective pull back from 152.82 completes. Firm break of 38.2% retracement of 196.85 to 122.36 at 150.43 will carry long term bullish implications. In that case, GBP/JPY could target 61.8% retracement at 167.78. However, break of 139.29 will indicate rejection from 150.43 key fibonacci level. And the three wave corrective structure of rebound from 122.36 will argue that larger down trend is resuming for a new low below 122.26.
XAUUSD Analysis: Trades At 1,294.86
In line with expectations, the pair continued to move in a limbo between the weekly R1 and R2 in anticipation of release of the FOMC meeting minutes. As soon as it became clear that there remains some uncertainty about the upcoming interest rate hike, the buck started to lose value against the gold. As a result, the rate reached and even slightly overstepped the 1,294.86 mark. Accordingly, the pair is likely to continue the surge at least in the first half of the day before the US PPI data release. This assumption is partially based on the 55-hour SMA, which is rising together with the pair, and partially on two recently formed ascending channels. However, the fact that an area near 1,295.50 is blocked by the 55-day SMA suggests that the rate might be actually forced to turnaround.