Sample Category Title
Market Update – European Session: Plenty Of Central Bank Speak Later In Session In Washington
Notes/Observations
Plethora of central bank speak at Institute of International Finance (IIF) conference in Washington today (includes ECB's Draghi (along with members Praet, Coeure and Lautenschlaeger, Fed's Brainard, Fed's Powell, BOE's Haldane and Bank of Canada (BOC) Wilkins, Riksbank Gov Ingves (along with member Skingsley)
Overnight
Asia:
China Foreign Ministry: Have lodged representations with US over destroyer's trespass on territorial waters
Europe:
Spain central govt said to have given Catalan leader Puigdemont 5 days (until Monday, Oct 16) to clarify independence stance. If Catalan President Puigdemont confirmed by Monday that he has declared independence, he will be given a further 3 days to withdraw the declaration
Americas:
FOMC Minutes (from Sept 19-20th): Many Fed officials saw another rate hike warranted this year. Many officials concerned low inflation might not only reflect transitory factors. Several members wanted to be more data dependent into December
Treasury Sec Mnuchin reportedly strongly advocating for Jerome Powell as Fed chair
US President Trump: Looking at ~10% repatriation tax rate (vs current 35% corporate tax rate)
Energy:
Weekly API Oil Inventories: Crude: +3.1M v -4.1M prior
Economic data
(NL) Netherlands Aug Trade Balance: €4.1B v €4.7B prior
(FR) France Sept Final CPI M/M: -0.2% v -0.1%e, Y/Y: 1.0% v 1.0%e, CPI Ex-Tobacco Index: 101.30 v 101.31e
(FR) France Sept Final CPI EU Harmonized M/M: -0.2% v -0.1%e, Y/Y: 1.1% v 1.1%e
(SE) Sweden Sept CPI M/M: 0.1% v 0.4%e, Y/Y: 2.1% v 2.4%e, CPI Level: 323.62 v 324.31e
(SE) Sweden Sept CPI CPIF M/M: 0.2% v 0.4%e, Y/Y: 2.3% v 2.5%e
(EU) Euro Zone Aug Industrial Production M/M: 1.4% v 0.6%e, Y/Y: 3.8% v 2.6%e
Fixed Income Issuance:
(SE) Sweden sold SEK750M vs. SEK750M indicated in I/L 2022 and 2026 Bonds
SPEAKERS/FIXED INCOME/FX/COMMODITIES/ERRATUM
Equities
Indices [Stoxx600 flat at 390, FTSE +0.1% at 7540, DAX -0.2% at 12950, CAC-40 -0.3% at 5348, IBEX-35 flat at 10280, FTSE MIB -0.4% at 22466, SMI flat at 9264, S&P 500 Futures -0.2%]
Market Focal Points/Key Themes:
European Indices trade mixed in range bound trade, ahead of key earnings reports out of the US. Banking giants JP Morgan and Citigroup set to report as we enter into earnings season.
On the corporate front Suedzucker trades lower after Q2 results and Sanofi weighs on the CAC after noting unfavorable currency will impact Q3 results. JustEat trades sharply higher after receiving provisional clearance from the CMA on its merger with hungryhouse. Elsewhere in the UK, Sky, GVC, Hays and Booker were some of the names that reported whilst in Germany Lufthansa trades higher after
Equities
Consumer discretionary [Lufthansa [LHA.DE] +2.9%, Air Berlin [AB1.DE] +40% (Lufthansa to acquire Air Berlin Assets), Kappahl [HAHL.SE] +16% (Earnings), Brown (N) Group [BWNG.UK] -3.1% (Earnings), Just Eat [JE.UK] +5.1% (CMA provisionally clears merger with Hungryhouse), GVC [GVC.UK] +2.7% (Earnings)]
Consumer Staples [Suedzucker [SZU.DE] -3.6% (Earnings)]
Materials: [Acacia Mining [ACA.UK] -3.1% (Q3 update)]
Industrials: [Renold [RNO.UK] -12% (Trading update)]
Healthcare: [ Sanofi [SAN.FR] -1% (Q3 currency impact),Fagron [FAGR.BE] - 8% (Q3 Rev)]
Speakers
Bank of England (BOE) Credit Conditions & Bank Liabilities Surveys: Lenders tightened criteria on unsecured borrowing (Motivations for this included concerns about customer indebtedness and the squeeze on real incomes), Defaults on Non-credit card unsecured lending up sharply
ECB spokesperson: Has legal basis for NPL provision guidance (**Note: refers to recent proposal on new guidance for banks' bad-loan provisioning starting in 2018)
Turkey Presidential advisor Ertem: Central bank tight monetary policy stance is important, seen as adequate and positive
Turkey Presidential spokesperson: Received an American request to resolve visa crisis, will evaluate proposal
Russia Central Bank (CBR) Gov Nabiullina: 2017 CPI forecast seen around 3.2%
Romania President Iohannis: Support bid for Cabinet reshuffle as economy is impacted by political turmoil
Norway 2018 fiscal budget set structural non-oil deficit at NOK231.1B vs. NOK219.6B y/y
IEA Monthly Oil Report: Maintains 2017 Global oil demand growth forecast at 1.6M bpd, Sets 2018 Global oil demand forecast at 1.4M bpd
Currencies
USD consolidated its post FOMC minutes loses in which some central bankers were still concerned about persistently low inflation. Many policymakers still felt that another rate increase this year "was likely to be warranted" but several noted that additional tightening was dependent on upcoming inflation data
EUR/USD holding steady at 1.1860 area while USD/JPY was at 112.25 just ahead of the NY morning.
SEK currency was softer after Sweden Sept CPI missed expectations Analyst noted that Swedish inflation has probably passed its peak as the strong SEK currency was taking a bite out of the upward momentum. EUR/SEK higher by over 0.5% approaching 9.60 area
Fixed Income
Bund futures trade at 161.42 up 24 ticks little change as the Fed Minutes showed central bankers are still concerned about persistently low inflation. Continued downside targets 161.03 while upside resistance stands initially at 162.07, followed by 163.27.
Gilt futures trade at 123.87 up 18 ticks with no major UK releases due for today. Continued downside eyeing 123.26. Upside targets 124.90 then 125.24.
Thursday's liquidity report showed Wednesday's excess liquidity rose to €1.809T from €1.790T and use of the marginal lending facility fell to €161M from €221M.
Corporate issuance saw $12.8B come to market via 6 Issuance was headlined by Wal-Mart's $6B 7-part senior unsecured offering and Sumitomo Mitsui Financial $2.5B 3-part issuance
Looking Ahead
(IT) Italy Debt Agency (Tesoro) to sell €6.0-7.5B indicated range in 2020, 20245 and 2048 BTP bonds
EU and UK official hold 5th round of Brexit monthly negotiation press conference
05:30 (ZA) South Africa Aug Total Mining Production M/M: +0.2%e v -0.4% prior, Y/Y: 0.5%e v 0.9% prior, Gold Production Y/Y: No est v 3.9% prior, Platinum Production Y/Y: No est v -5.0% prior
05:30 (SE) Sweden Central Bank (Riksbank) Dep Gov Ohlsson
05:30 (HU) Hungary Debt Agency (AKK) to sell Bonds
06:00 (IE) Ireland Sept Property Prices M/M: No est v 3.0% prior, Y/Y: No est v 12.3% prior
06:00 (IE) Ireland Sept CPI M/M: No est v 0.4% prior, Y/Y: No est v 0.4% prior
06:00 (IE) Ireland Sept CPI EU Harmonized M/M: No est v 0.4% prior, Y/Y: No est v 0.4% prior
06:00 (PT) Portugal Sept CPI M/M: No est v 0.0% prior, Y/Y: No est v 1.4% prior
06:00 (PT) Portugal Sept CPI EU Harmonized M/M: No est v 0.2% prior, Y/Y: No est v 1.3% prior
06:30 (IS) Iceland to sell Bills
08:00 (PL) Poland Sept Final CPI M/M: No est v 0.4% prelim, Y/Y: No est v 2.2% prelim
08:00 (IN) India Sept CPI Y/Y: 3.5%e v 3.4% prior
08:00 (IN) India Aug Industrial Production Y/Y: 3.0%e v 1.2% prior
08:00 (UK) Baltic Dry Bulk Index
08:30 (US) Sept PPI Final Demand M/M: 0.4%e v 0.2% prior, Y/Y: 2.6%e v 2.4% prior
08:30 (US) Sept PPI Ex Food and Energy M/M: 0.2%e v 0.1% prior, Y/Y: 2.0%e v 2.0% prior
08:30 (US) Sept PPI Ex Food, Energy, Trade M/M: 0.2%e v 0.2% prior, Y/Y: No est v 1.9% prior
08:30 (US) Initial Jobless Claims: 250Ke v 260K prior, Continuing Claims: 1.93Me v 1.938M prior
08:30 (CA) Canada Aug New Housing Price Index M/M: No est v 0.4% prior, Y/Y: No est v 3.8% prior
08:30 (CA) Canada Sept Teranet/National Bank HPI M/M: No est v 0.6% prior, Y/Y: No est v 13.1% prior, House Price Index: No est v 222.03 prior
09:00 (MX) Mexico Aug Industrial Production M/M: +0.4%e v -1.0% prior, Y/Y: -0.7%e v -1.6% prior, Manufacturing Production Y/Y: 3.4%e v 2.2% prior
09:00 (RU) Russia Aug Trade Balance: $5.0Be v $ 4.0B prior, Exports: $27.3Be v $24.7B prior, Imports: $21.8Be v $20.8B prior
09:00 (RU) Russia Gold and Forex Reserve w/e Oct 6th: No est v $424.0B prior
09:00 (DE) German Chancellor Merkel at conference
10:00 (MX) Mexico Central Bank (Banxico) Sept Minutes
10:15 (EU) ECB's Draghi, Fed's Brainard speak on Monetary Policy Panel
10:30 (US) Weekly EIA Natural Gas Inventories
10:30 (US) Fed's Powell (voter, neutral) speaks at IIF Conference in Washington
10:30 (BE) ECB's Praet (Belgium, chief economist) in Washington
11:00 (US) Weekly DOE Crude Oil Inventories
12:00 (US) USDA World Agricultural Supply and Demand Estimate (WASDE) Crop Report
13:00 (US) Treasury to sell $12B in 30-Year Bonds Reopening
13:30 (SE) Sweden Central Bank (Riksbank) Dep Gov Skingsley in Washington
15:00 (AR) Argentina Sept National CPI M/M: No est v 1.4% prior
15:15 (CA) Bank of Canada (BOC) Wilkins in Washinton
15:30 (SE) Sweden Central Bank (Riksbank) Gov Ingves in Washington
15:45 (UK) BOE's Haldane in Washington
16:00 (FR) ECB's Coeure (France) in Washington
16:10 (DE) ECB's Lautenschlaeger on panel in Washington
Central Bankers Take The Spotlight On Thursday
- Attention turns to Fed speakers after minutes shed no further light on interest rates;
- Draghi joins a host of ECB speakers today ahead of key meeting in two weeks;
- Rajoy offers ultimatum to Catalan government.
The US trading day is shaping up to be far more interesting than the Asian and European sessions that preceded it on Thursday, with central bankers making appearances in large numbers, while earnings and economic reports will also attract some attention.
The FOMC meeting minutes, released on Wednesday, had the potential to be the week's most notable economic event but as many expected, there was very little in them that we were not aware of. We saw some softness in the dollar shortly after but this had been building prior to the release and I'm not convinced that many officials being concerned that inflation may not be transitory is the revelation it was made out to be.
The dollar may have weakened a little in the aftermath but yields on US Treasuries were broadly unfazed by the release. The dollar continues to look very oversold and a key test of this will likely come in the weeks ahead, with 92.50 being notable support in the dollar index and 94 resistance to the upside. A break above here could trigger a decent rally in the greenback, something that wouldn't entirely surprise me into the end of the year.
We'll hear from two permanent voters on the FOMC today, Lael Brainard and Jerome Powell, the latter being one of the final candidates rumoured to be being considered to replace Chair Janet Yellen in February. Both have been among the moderately hawkish members of the central bank but appear to fall very much in the unconvinced category, when it comes to the debate on inflation. It will therefore be very interesting to see what they have to say today, should they address it of course.
Other central bankers due to speak today include Mario Draghi and his colleagues at the ECB Peter Praet, Benoit Coeure and Sabine Lautenschlager, among many others. On the economic data side, we'll get PPI inflation data from the US for September, alongside weekly jobless claims and oil inventory data from EIA. This follows a report from API on Wednesday which indicated a build of just over three million barrels last week, which if replicated would comfortably exceed expectations of a small decline. Earnings season also got underway this week and while we're still in the quieter early stages, we will get reports on the third quarter from JP Morgan and Citigroup.
It's been a relatively quiet morning in Europe so far, with focus there still very much being on the constitutional crisis in Spain as Catalonia prepares to declare independence following its questionable and illegal referendum and Madrid prepares countermeasures. Spanish Prime Minister Mariano Rajoy has given the Catalan government eight days to drop its independence bid or risk losing its political autonomy, a move that would likely spur further unrest. So far the negative impact of this has been limited to Spanish assets, although the IBEX has recovered quite well over the last week.
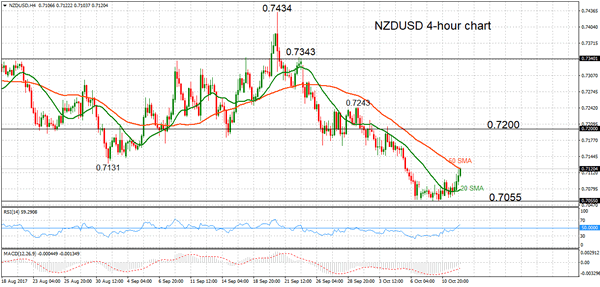
NZDUSD Shifts Out Of Consolidation Phase To Break Higher
NZDUSD is shifting out of a neutral phase and the bias is tilted to the upside. The 4-hour chart analysis shows that the market was consolidating near 0.7055 and then rallied towards the 50-period moving average where momentum stalled. But there is room for more upside since the RSI indicator is in bullish territory.
A valid breakout above 0.7120 could propel prices towards the key 0.7200 psychological level. Further strength in the market would change the September 20 to October 10 bearish trend and shift the focus back to the upside towards important highs at 0.7243 and 0.7343 ahead of the September 20 peak at 0.7434. Rising above this would open the way for an extension to the July peak at 0.7557.
Alternatively, prices could remain capped below the 50-period MA to target the low at 0.7055. A move below this would see a resumption of the recent downtrend with scope to target the major low at 0.6817.
Near-term risk remains to the upside and the recent downtrend is expected to take a pause above 0.7055. But only a move above 0.7200 would indicate the end to the September-October downtrend. The negative alignment of the 20 and 50-period moving averages are keeping the bearish picture in play.
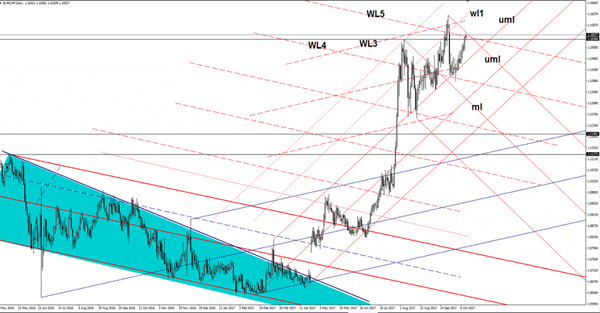
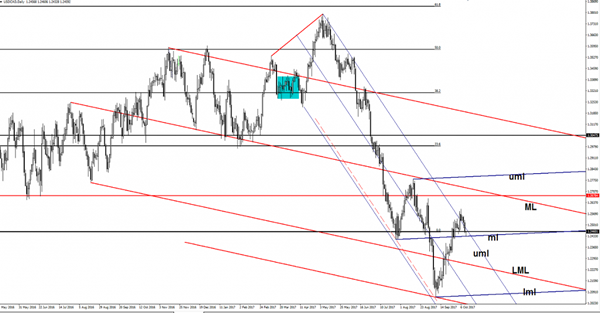
EUR/CHF Breakout?
Price extends the latest gains and looks determined to breakout from the minor descending pitchfork. I've said in the previous reports that price should reach the upper median line (uml) of the descending pitchfork after the failure to reach the median line (ml). A valid breakout above the WL5 and above the upper median line (uml) will validate an increase at least till will reach the 1.1621 previous high.
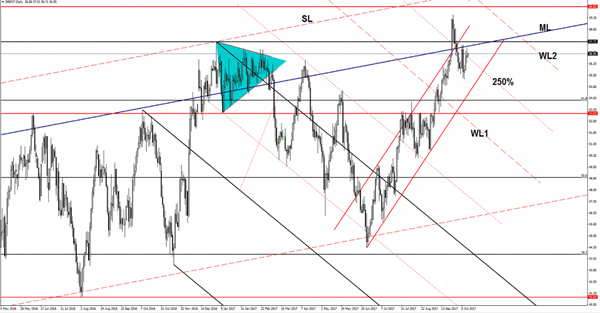
Brent Oil Losing Momentum
Brent Oil increased little today and tries to stay above the broken 250% Fibonacci line (descending dotted line). I’ve said in the previous reports that the price could come to retest the median line (ML) of the major ascending pitchfork before will drop again. We’ll see what will happen when will hit the ML and also the 57.72, a rejection will send the rate at least till the 61.85 retracement level and towards the 53.03 horizontal support.
USD/CAD Stands On Crucial Support Area
The currency pair has decreased today and has resumed the bearish movement as the USDX has touched fresh new lows. The Loonie has dragged the rate down, but remains to see what will happen and how will react after the Canadian and the US data will be sent to the public. We may have some volatility in the afternoon, so you should be careful not to ruin your account.
USD/CAD has squeezed a little in the last hours and waits for the US data to shake the markets again. The US PPI is expected to increase by 0.4% in September, beating the 0.2% growth in the former reading period, while the Unemployment Claims could decrease again, from 260K to 251K in the previous week. The Core PPI may increase as well by 0.2%, more versus the 0.1% in the former reading period.
The price had reached and retested the median line (ml) of the minor ascending pitchfork and now is pressuring the 1.2460 broken static support. I’ve said in the previous reports that the rate could come down to retest the median line (ml) and the 1.2460 static support, now we’ll have to see what will happen because a rejection will send the rate towards the median line (ML) of the major descending pitchfork and towards the 1.2678 static resistance.
However, we have to wait to escape again from the minor descending pitchfork’s body to be sure that will start a larger increase.
Bitcoin Broke 5k | FOMC Minutes Stirred Confidence | Bank Earnings Due
Bitcoin Back above 5K
FOMC Minutes restore confidence
Madrid Issues Ultimatum to Barcelona
Bitcoin made another record high and broke its previous record high of $5000. It is up nearly 74% from its previous low of $2975 and up today nearly 5.57% (at the time of writing this article). There are many things which are behind the move such as Amazon thinking of adding Bitcoin as a form of payment, Goldman Sachs exploring the idea of adding bitcoin desk and geopolitical tensions.
Traders are optimistic on the back of the FOMC minutes as it was confirmed that the Fed is committed to its current stance towards its monetary policy. As long as the economic outlook doesn't deteriorate, the Fed is confident that another rate is likely by the end of this year. The minutes stirred confidence for investors. The reason is that the Fed isn't concerned about the harmful effects of all the hurricanes and classified them as transitory. For the equity investors, an increase in the interest rate on the back of the stable economic outlook warrants them to continue to invest in riskier assets.
In simple terms, the recent economic outlook hasn't changed the Fed's stance towards the monetary policy and the FOMC minutes did provide the same message that the market was expecting. However, this isn't to say that there is a perfect harmony amid the Fed members, because some of them are little concerned about the inflation equation. Charles Evan, the Chicago Fed, and Minneapolis Fed, Neil Khaskari's, both think that inflation is too soft and hold a contrasting view to the other members. This confirms that the pace of the interest rate hike going into 2018 may not be the same. This has taken the wind out of the dollar index. Basically, the Fed's inflation target still appears to be out of reach. Moreover, the ongoing sparring between President Trump and Senate Republican Bob Corker about the tax overhaul is maintaining the resistance on the dollar index.
The Spanish government's response to Catalonian President's action was a little tougher than anticipated. Perhaps his agenda is to make sure that Catalonians understands very well that Madrid has the ultimate power and they aren't going to leave the country. The Spanish Prime Minister Mr. Rajoy demands a clear answer from the Catalonian leader on declaring a deferred independence. Catalonians have five days to respond and if they do confirm that the independence has been declared and it is implemented, then we should prepare for a dire situation in the market. Triggering the article 155 of the Spanish constitution would bring nuclear waves in the Spanish political system. This would be a no-win position for both parties.
Investors would be focused on the US banks mainly as Wall Street giants report their earnings. JP Morgan and Citigroup will report their earnings before the New York open and the consensus in the market is for a soft number from them. The main focus would be on the trading volume and their loan growth. Any deterioration in their credit quality would be unwelcomed by investors and their stock price could come under pressure.
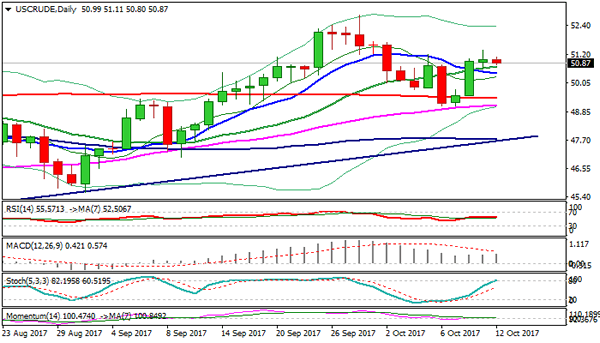
Technical Outlook: WTI OIL Stands At The Back Foot, Awaiting EIA Report For Fresh Direction Signal
WTI Oil trades lower on Thursday as strong rally in past three days showed signs of stall after hitting high at $51.40 (Fibo 61.8% of $52.84/$49.09 downleg).
The price came under pressure after release of API report which showed unexpected rise in crude stocks which rose by 3.1 million barrels and disappointed expectations for 0.4 million barrels draw.
Focus turns towards today's EIA crude stocks report which shows forecast for 1.9 million barrels draw.
Today's release in negative numbers could be supportive for oil price and prevent further fall.
Oil rallied strongly in past few days when WTI contract rose by 3.6% in three days on strong signals that oil market is rebalancing after being depressed by global oversupply.
Oil faces initial support at $50.72 (20 SMA) which contained yesterday's dips and now acting as first pivot.
Daily Tenkan-sen ($50.39) marks next important support, close below which would generate stronger bearish signal on completion of reversal pattern on daily chart for retest of next pivot at psychological $50.00 support.
Alternatively, fresh strength and close above $51.40 would signal continuation of bull-leg from $49.09 towards $51.96 (Fibo 76.4%) and expose recent peak at $52.74.
Res: 51.11, 51.40, 51.96, 52.41
Sup: 50.72, 50.52, 50.39, 50.00
OPEC Reports See Oil Below $55 Next Year
Oil-exporters' cartel OPEC has released its outlook for crude to trade at US$55 per barrel in 2018, about 4% higher than its current ‘reference basket' price. We are not so sure. While bullish on petroleum production, we think that prices might be held in check by OPEC itself, which will not want to risk raising prices too far or too fast.
OPEC foresees the world economy growing at 3.6% next year, up from a previous estimate of 3.5%. Demand for crude, now at 32.8 million barrels a day, is expected to climb to 33.1 million barrels. Still, current prices are below the cost curve of most US shale-oil producers, and OPEC has every interest in keeping them there to keep their competing supplies in the ground.
Will EUR/CHF finally break the 1.20 threshold?
There is scant chance that the Euro will breach CHF 1.20 before the European Central Bank meeting on monetary policy of 14 December, but after that? A crawl-back to 1.20 – which the Swiss National Bank held as a floor until in early 2015 it let the franc float – could be on the cards. But it will take time.
Latest data are disappointing. Core inflation in the Eurozone eased to 1.1% annually in September, and broader inflation contracted during the summer, which will make the ECB wary of tightening money. We believe that the ECB will stay very cautious, taking only limited measures to boost the Euro. Economic growth has returned to the Eurozone, but further rises in the Euro's value are still on the horizon.
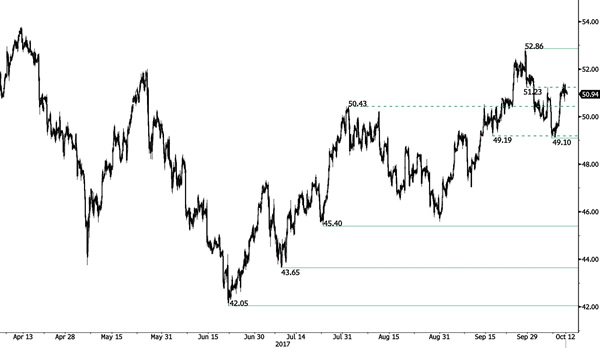
CRUDE OIL Stalled
Crude oil is consolidating within a range defined by the support at 50.43 and the hourly resistance at 51.23. Key support is given at 45.40 (17/08/2017 high). Strong resistance lies at 52.86 (28/09/2017). Expected to show continued weakness.
In the long-term, crude oil has recovered after its sharp decline last year. However, we consider that further weakness are very likely. For the time being the pair lies in an upside momentum. Strong support lies at 35.24 (05/04/2016) while resistance can now be found at 55.24 (03/01/2017 high).