Sample Category Title
SILVER Higher
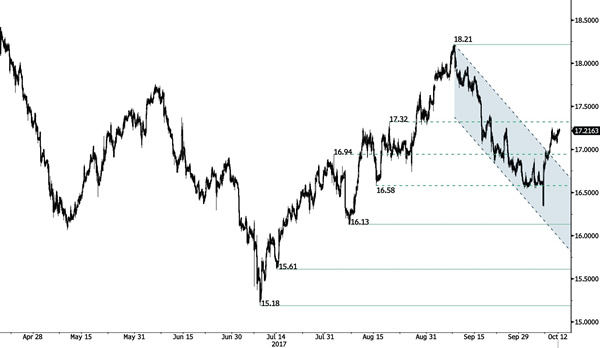
Silver has further improved as can be seen by the move above the resistance at $17.25. The precious metal is now trading above $17. Hourly support can be found at 16.13 (06/10/2017 low). Expected to show further increase.
In the long-term, the trend is rater negative. Further downsides are very likely. Resistance is located at 25.11 (28/08/2013 high). Strong support can be found at 11.75 (20/04/2009).
GOLD Eyeing $1300
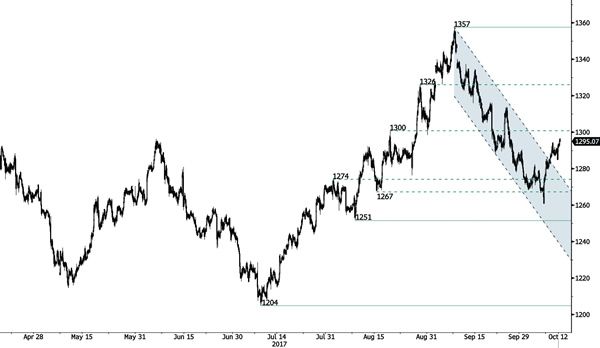
Gold has broken downtrend channel precious metal that drove the precious metal from 1357 to hourly support given at 1267 (15/08/2017 low). Strong support lies at a distance at 1204 (10/07/2017 high). Expected to show further upside move.
In the long-term, the technical structure suggests that there is a growing upside momentum. A break of 1392 (17/03/2014) is necessary ton confirm it, A major support can be found at 1045 (05/02/2010 low).
BITCOIN Retest Of Key Resistance
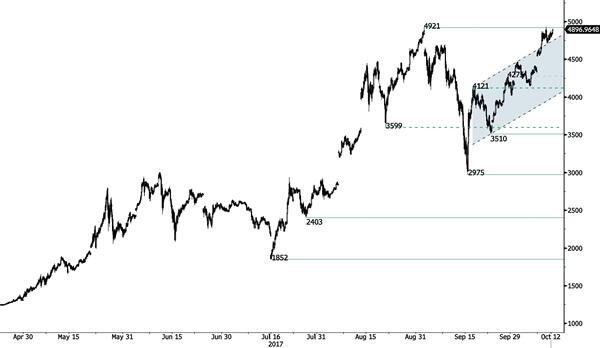
Bitcoin is definitely on a strong momentum. Strong support is given at 2975 (22/08/2017 low). Sell walls around $4000 have been broken. Key resistance can be located at 4921 (01/09/2017 high - All-Time High). The road is wide open for further increase.
In the long-term, the digital currency has had an exponential growth. There are decent likelihood that the asset will reach $10'000.
EUR/CHF Breaking Out
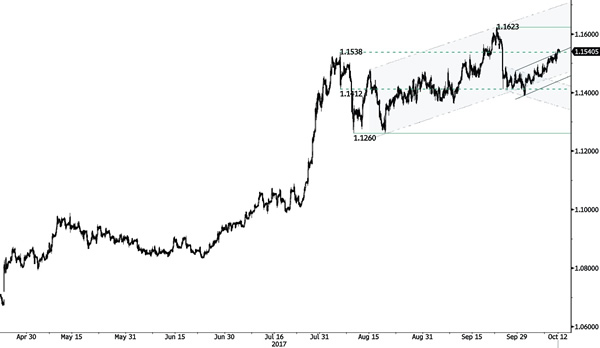
EUR/CHF has broken to the upside of its channel range. Strong resistance lies at a distance at now at 1.1623 (22/09/2017 high). Support is given at 1.1388 (02/09/2017 low). Downside risk is very likely.
In the longer term, the technical structure has reversed. Strong resistance is given at 1.20 (level before the unpeg). Yet, the ECB's QE programme is likely to cause persistent selling pressures on the euro, which should weigh on EUR/CHF. Supports can be found at 1.0184 (28/01/2015 low) and 1.0082 (27/01/2015 low).
EUR/GBP Consoidation
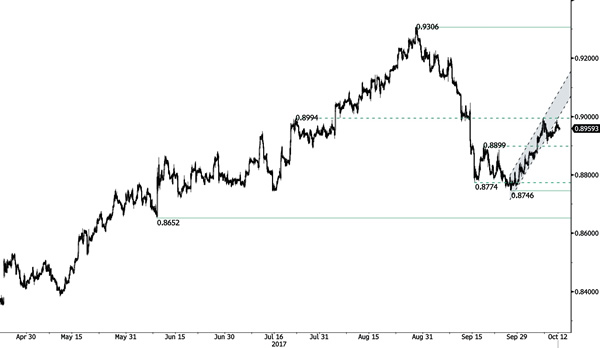
EUR/GBP drifting high but well within recent ranges. The pair has broken the resistance at 0.8899 (19/09/2017 low). The very short-term technical structure is biased to the upside. Hourly support is given at 0.8906 (09/10/2017).
In the long-term, the pair has largely recovered from recent lows in 2015. The technical structure suggests a growing upside momentum. The pair is trading above from its 200 DMA. Strong resistance can be found at 0.9500 (psychological level).
AUD/USD Strong Bullish Momentum
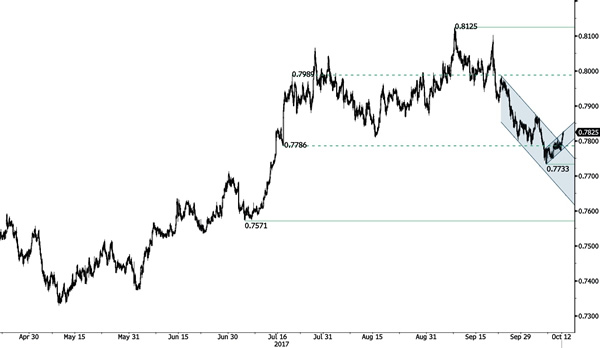
AUD/USD is strengthening breaking above rising channel top. Next resistance is given at 0.7875 (04/10/2017 high). Support lies at at 0.7733 (06/10/2017 low). Expected to show continued increase.
In the long-term, the trend is turning positive. Key supports stands at 0.6009 (31/10/2008 low) . A break of the key resistance at 0.8164 (14/05/2015 high) is needed to invalidate our long-term bearish view.
USD/CAD Middle Of Rising Channel
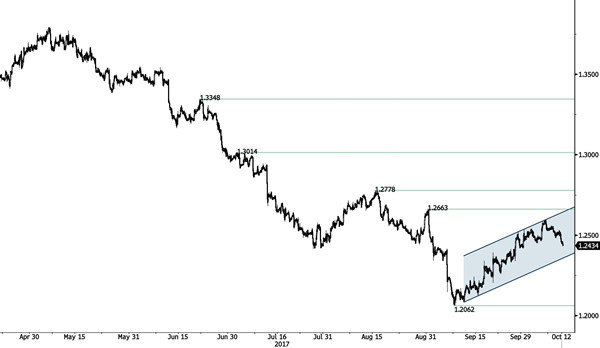
USD/CAD continues to bounce within uptrend channel. Strong support is located at a distance at 1.2062 (08/09/2017 low). Hourly support lies at 1.2331 (26/09/2017 high). Resistance is given at 1.2663 (31/08/2017 high). Expected to show continued short-term bullish pressures within uptrend channel.
In the longer term, the pair has broken longterm support that can be found at 1.2461 (16/03/2015 low). Strong resistance is given at 1.4690 (22/01/2016 high). The pair is likely to head further lower.
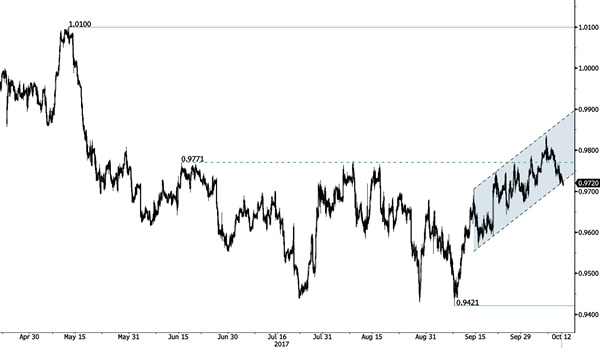
USD/CHF Slight Break Of Rising Channel
USD/CHF has breached the channel support at 0.9724 However, prices have thus failed to hold below that level and a key support stands at 0.9712. The break of the hourly resistance at 10.9741 (11/10/2017 high) suggests an improving short-term buying interest. Expected to show continued bullish pressures within uptrend channel.
In the long-term, the pair is still trading in range since 2011 despite some turmoil when the SNB unpegged the CHF. Key support can be found 0.8986 (30/01/2015 low). The technical structure favours nonetheless a long term bullish bias since the unpeg in January 2015.
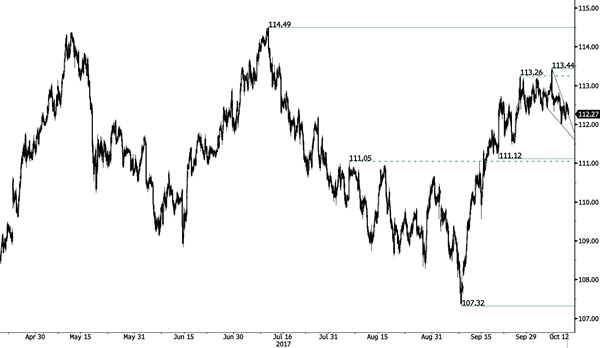
USD/JPY Stable
USD/JPY has failed to hold above former resistance given at 113.26 (27/09/2017 low). Support is located at 111.99 (16/10/2017 low). Downside risks are rising as markets may soon take some short-term profit.
We favor a long-term bearish bias. Support is now given at 99.02 (10/08/2013 low). A gradual rise towards the major resistance at 125.86 (05/06/2015 high) seems unlikely. Expected to decline further support at 93.79 (13/06/2013 low).
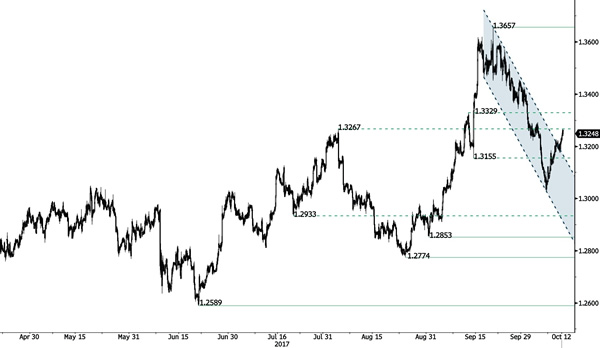
GBP/USD Breakout Extension
GBP/USD continues to rise after the break of falling channel. A support can be found at 1.3237 (intraday low). Hourly resistances stand at 1.3265 (intraday high).
The long-term technical pattern is reversing. The Brexit vote had paved the way for further decline. Long-term support can be found at 1.1841 (07/10/2017 low). Long-term resistance given around 1.35 is at stake and indicates a long-term reversal in the negative trend. Yet, it is very unlikely at the moment.