Sample Category Title
Swedish Inflation Is In Focus Today
Market movers today
Swedish inflation is in focus today. We expect a new high in y/y terms (2.5% y/y for CPIF), though we expect the y/y rate to moderate in coming months. A relatively high print is probably expected at this point , and rates in the short end of Swedish curves have traded up in anticipation. In Norway, the budget for 2018 is revealed (see next page).
On the global front , the euro area is due to release industrial production for August . Following a st rong German print for August , we should expect a decent increase. If confirmed, it will point to another robust quarter for euro area growth.
In the US, PPI and initial jobless claims are due for release. The Fed's Brainard (vot er, dovish) and Powell (voter, neut ral) are due to speak today.
With respect to Brexit, the fifth negotiation round concludes today with a joint press conference. As the EU leaders at the EU summit later next week are likely to conclude there has not been ‘sufficient progress' to begin discussing the future relationship, more negotiations are needed in November and early December.
Selected market news
In our view, there was nothing new of great importance in the FOMC minutes, as we already know the different positions among the FOMC members . This also explains why markets did not react to the minutes. It remains our base case that the Fed will hike in December, as the core voting FOMC members put more weight on labour market data than current inflation data, although we agree with the dovish camp that low inflation may not be temporary due to low inflation expectations. Also, there was no news on what level the Fed targets for its balance sheet , as the Fed is likely to want to keep its flexibility, adjusting the target along the way. ‘Quant it ative tightening' is new to the Fed, so it is unlikely to see any benefits from precommitting. For more see FOMC minutes: Core members still want to hike in December, 11 October 2017.
Trump is set to meet with John Taylor (professor at Stanford University and the man behind the so-called " T aylor rule") lat er this week about the Fed chair, see Bloomberg, 11 October 2017. Taylor has indicated previously that he thinks the Fed funds rate is too low and that he wants a more rule-based approach to monetary policy. Trump has said previously that he will make an announcement on his nominat ion for Fed change in a couple of weeks.
President Trump has also said he will soon make an announcement on an Iranian deal. The US is pushing for condemning Iran but allies are pushing back and defending the nuclear deal, see Washington Post, 11 October 2017.
Yesterday in Spain, Prime Minister Mariano Rajoy gave Catalan leader Carles Puigdemont five days to clarify whether he has declared independence from Spain while threatening with article 155, which would suspend the authority of the Catalonian local government. Today is a national holiday in Spain and Rajoy is due to at tend a military parade in Madrid alongside King Felip VI.
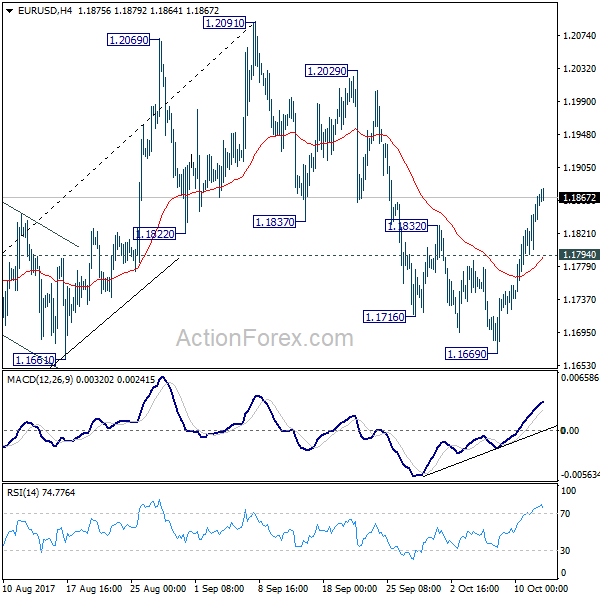
EUR/USD Daily Outlook
Daily Pivots: (S1) 1.1813; (P) 1.1841 (R1) 1.1888; More...
Intraday bias in EUR/USD remains on the upside for the moment. Pull back from 1.2091 should have completed at 1.1669, ahead of 1.1661 support. Further rise should be seen to retest 1.2091 high. We'll be cautious on strong resistance from there to bring another fall to extend the consolidation. On the downside, below 1.1794 minor support will turn bias back to the downside and could extend the correction from 1.2091 through 1.1669.
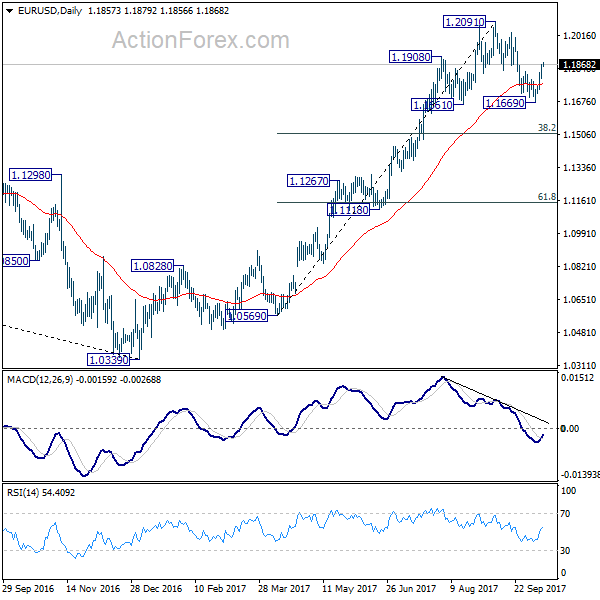
In the bigger picture, rise from medium term bottom at 1.0339 is not finished yet. It's expected to continue after pull back from 1.2091 completes. And, next target will be 38.2% retracement of 1.6039 (2008 high) to 1.0339 (2017 low) at 1.2516. However, it should be noted that there is no confirmation of trend reversal yet. That is, such rebound from 1.0399 could be a correction. And the long term fall from 1.6039 (2008 high) could resume. Hence, we'd be cautious on strong resistance from 1.2516 to limit upside.
EUR/GBP Candlesticks and Ichimoku Analysis
Weekly
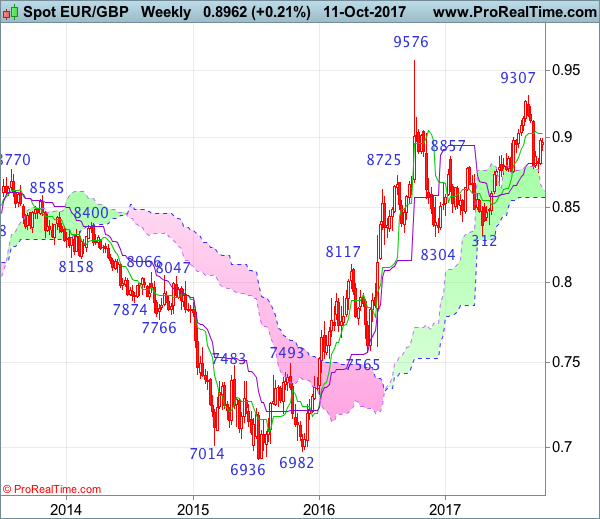
• Last Candlesticks pattern: N/A
• Time of formation: N/A
• Trend bias: Near term up
Daily
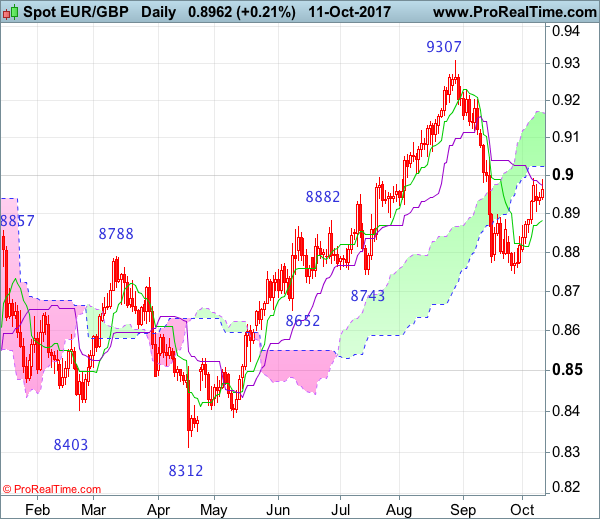
• Last Candlesticks pattern: Shooting star
• Time of formation: 29 Aug 2017
• Trend bias: Down
EURGBP – 0.8962
As the single currency found good support at 0.8746 late last month and has rebounded, suggesting the decline from 0.9307 has ended there and consolidation with mild upside bias is seen for retracement of this move to the lower Kumo (now at 0.9025), then 0.9045-50, however, reckon upside would be limited to 0.9110-15 and as top has been formed at 0.9307, reckon upside would be limited to 0.9150 and price should falter below 0.9203, bring another leg of corrective decline later this month.
On the downside, whilst pullback to 0.8900-10 cannot be ruled out, reckon the Tenkan-Sen (now at 0.8882) would limit downside and 0.8820-25 should hold and bring another rebound later. A daily close below 0.8020-25 would suggest the rebound from 0.8746 has ended and bring weakness to 0.8790-00, then towards this recent low later. Looking ahead, only break of 0.8746 would signal the fall from 0.9307 top has resumed and extend weakness towards 0.8690-95 (61.8% Fibonacci retracement of 0.8312-0.9307) but previous support at 0.8652 would hold.
Recommendation: Stand aside for this week.
On the weekly chart, despite falling marginally to 0.8746 (a doji star was formed), last week’s rebound formed a white candlestick, suggesting at least the first leg of decline from 0.9307 top has ended there, hence consolidation with mild upside bias is seen for gain to the Tenkan-Sen (now at 0.9027) and then 0.9050, however, if our view that top has been formed at 0.9307 is correct, upside would be limited to 0.9120-25 and price should falter well below 0.9203, bring another leg of decline later this month.
On the downside, expect pullback to be limited to 0.8900 and 0.8840-45 should hold, bring another rebound later. Only a drop below last week’s low at 0.8801 would suggest the rebound from 0.8746 has ended and bring retest of this level, break there would signal another leg of corrective decline from 0.9307 top is underway and bring retracement of early upmove to 0.8690-95 (61.8% Fibonacci retracement of 0.8312-0.9307) and possibly support at 0.8562, however, reckon downside would be limited to the lower Kumo (now at 0.8571) and previous resistance at 0.8531 should turn into support and contain euro’s downside.
EUR/CHF Candlesticks and Ichimoku Analysis
Weekly
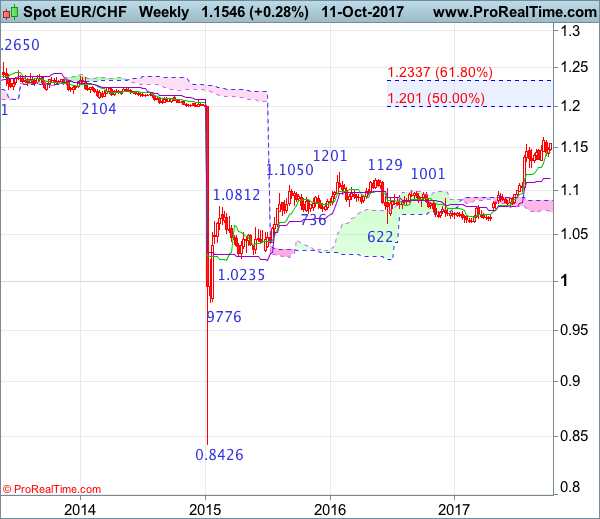
• Last Candlesticks pattern: Long white candlestick
• Time of formation: 24 Jul 2017
• Trend bias: Up
Daily
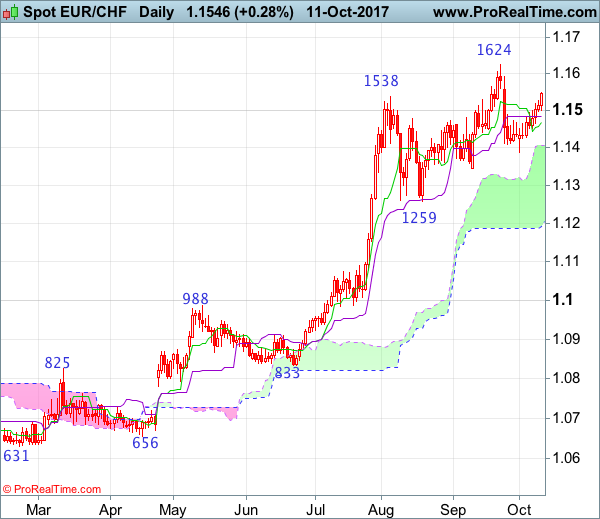
• Last Candlesticks pattern: Morning doji
• Time of formation: 25 Jul 2017
• Trend bias: Up
EUR/CHF – 1.1536
Although the single currency has rebounded after finding support at 1.1388 and marginal gain from here cannot be ruled out, if our view a temporary top formed at 1.1624 last month is correct, upside would be limited and 1.1590-95 should hold, bring another retreat later, below 1.1450 would bring test of said support at 1.1388 but break there is needed to add credence to this view, bring retracement of recent upmove to support at 1.1345, then towards 1.1300, however, another previous support at 1.1259 should hold from here.
On the upside, whilst initial marginal recovery cannot be ruled out, reckon 1.1590-95 would limit upside and bring another decline later. Above said last month’s high at 1.1624 would abort and revive bullishness, then recent upmove shall extend gain towards 1.1695-00 (61.8% projection of 1.0833-1.1538 measuring from 1.1260), however, loss of upward momentum should prevent sharp move beyond 1.1770-80 and reckon 1.1800-10 would hold from here, risk from there is seen for a retreat to take place later.
Recommendation: Hold short entered at 1.1520 for 1.1320 with stop above 1.1620.
On the weekly chart, although euro found support at 1.1388 and recovered, as long as last month’s high at 1.1624 holds, minor consolidation would be seen with mild downside bias for another retreat, below said support would bring retreat to 1.1345 support but break there is needed to signal a temporary top is possibly formed, bring retracement of recent rise to 1.1300, then towards another previous support at 1.1259 but price should stay above the Kijun-Sen (now at 1.1140) and bring rebound later.
On the upside, only break of said last month’s high at 1.1624 would signal the major rise from 0.8426 low has once again resumed and extend headway to 1.1695-00 (61.8% projection of 1.0833-1.1538 measuring from 1.1260), then towards 1.1760-70 but overbought condition should prevent sharp move beyond 1.1840-50 and reckon 1.1900-10 would hold from here, risk from there has increased for a retreat to take place later.
GBP/USD Daily Outlook
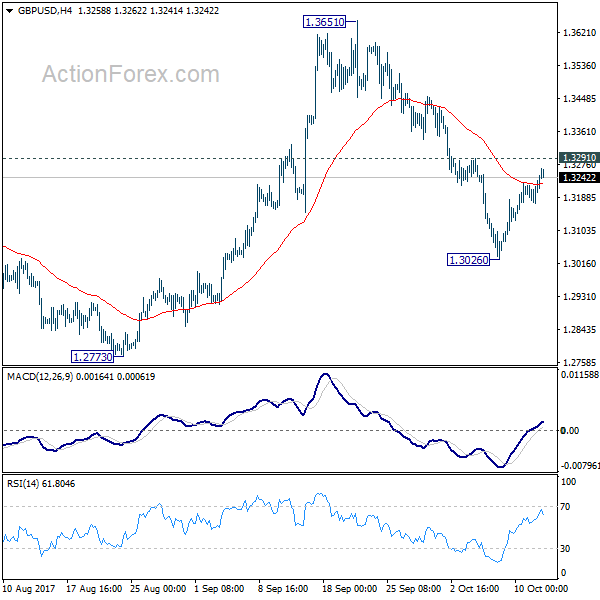
Daily Pivots: (S1) 1.3187; (P) 1.3211; (R1) 1.3247; More....
Intraday bias in GBP/USD remains neutral for consolidation above 1.3026 temporary low. At this point, deeper fall is mildly in favor as long as 1.3291 minor resistance holds. Below 1.3026 will target 1.2773 key support level. Decisive break there will affirm the bearish case of medium term reversal. Nonetheless, break of 1.3291 will suggest that the pull back from 1.3651 is completed and turn bias back to the upside.
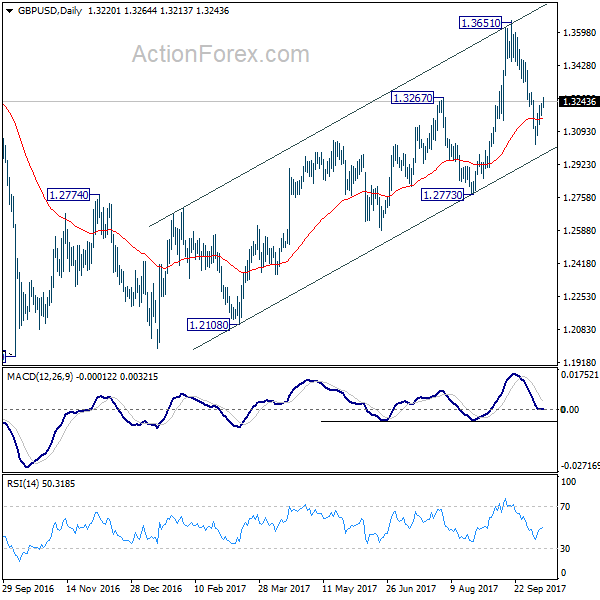
In the bigger picture, while the medium term rebound from 1.1946 was strong, GBP/USD hit strong resistance from the long term falling trend line. Outlook is turned a bit mixed and we'll turn neutral first. On the downside, decisive break of 1.2773 key support will argue that rebound from 1.1946 has completed. The corrective structure of rise from 1.1946 to 1.3651 will in turn suggest that long term down trend is now completed. Break of 1.1946 low should then be seen. On the upside, break of 1.3835 support turned resistance will revive the case of trend reversal and target 38.2% retracement of 2.1161 (2007 high) to 1.1946 (2016 low) at 1.5466 .
Trade Idea : USD/CHF – Sell at 0.9755
USD/CHF - 0.9720
Most recent candlesticks pattern : N/A
Trend : Near term up
Tenkan-Sen level : 0.9725
Kijun-Sen level : 0.9739
Ichimoku cloud top : 0.9772
Ichimoku cloud bottom : 0.9757
Original strategy :
Sell at 0.9760, Target: 0.9660, Stop: 0.9795
Position : -
Target : -
Stop : -
New strategy :
Sell at 0.9755, Target: 0.9655, Stop: 0.9790
Position : -
Target : -
Stop : -
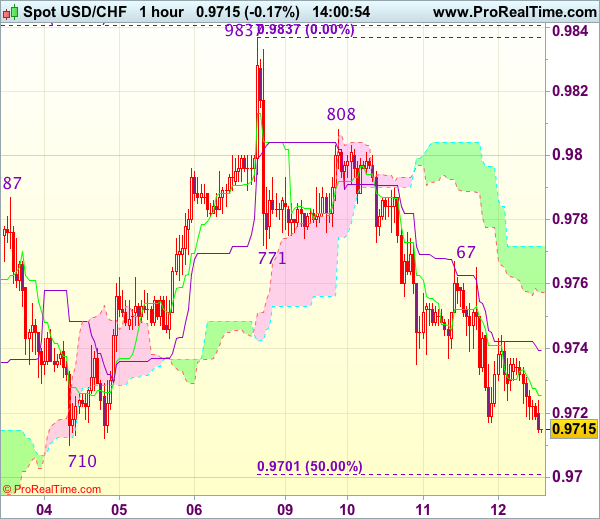
As the greenback has fallen again after brief recovery, suggesting the fall from 0.9837 top is still in progress and bearishness remains for test of previous support at 0.9710, however, break there is needed to retain downside bias for further decline to 0.9669-70 (61.8% Fibonacci retracement of 0.9565-0.9837 and previous support) but previous support at 0.9642 should remain intact due to near term oversold condition.
In view of this, would not chase this fall here and we are looking to sell dollar on recovery as resistance at 0.9767 should limit upside and bring another decline later. Only break of resistance at 0.9808 would signal an intra-day low is formed and indicate the pullback from 0.9837 has ended, bring retest of this level later.
USD/CHF Daily Outlook
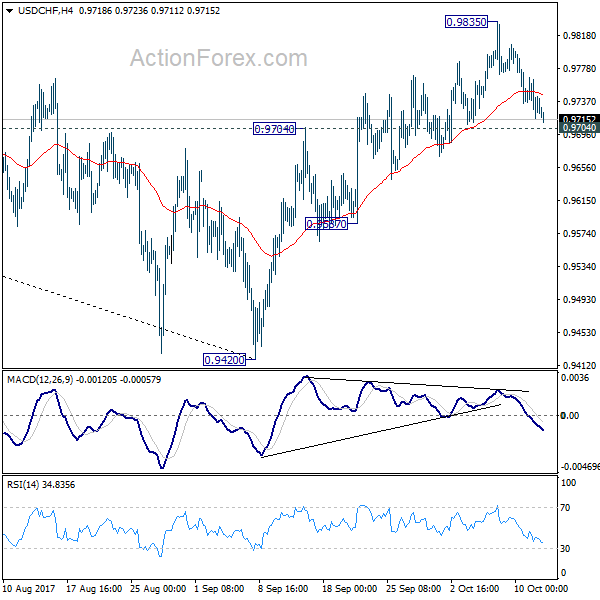
Daily Pivots: (S1) 0.9709; (P) 0.9737; (R1) 0.9759; More....
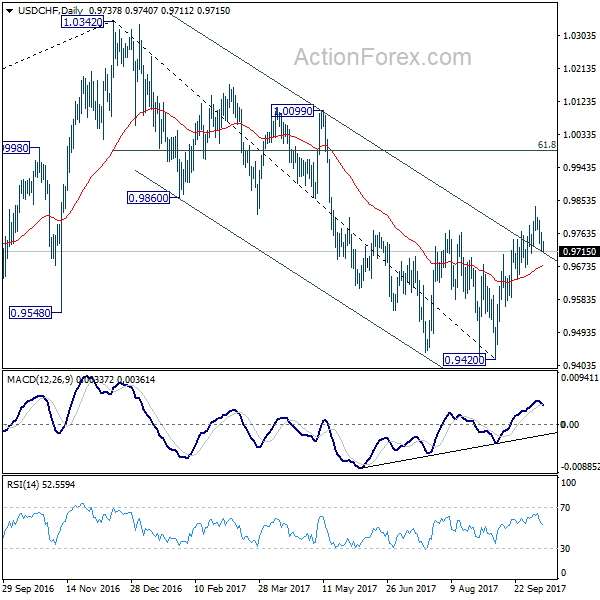
Intraday bias in USD/CHF remains neutral for the moment. Considering bearish divergence condition in 4 hour MACD, break of 0.9704 resistance turned support will argue that rebound from 0.9420 has completed. This will also mixed up the near term outlook and turn bias back to the downside for 0.9587 support. Meanwhile, break of 0.9835 temporary top will extend the rebound to 61.8% retracement of 1.0342 to 0.9420 at 0.9990.
In the bigger picture, current development suggests that USD/CHF has defended 0.9443 (2016 low) key support level again. Rise from 0.9420 could develop into a medium term move and target a test on 1.0342 high. This represents the upper end of a long term range that started back in 2015. On the downside, break of 0.9587 support is now needed to indicate completion of the rise from 0.9420. Otherwise, further rally will remain in favor in medium term.
USD/JPY Daily Outlook
Daily Pivots: (S1) 112.18; (P) 112.38; (R1) 112.69; More...
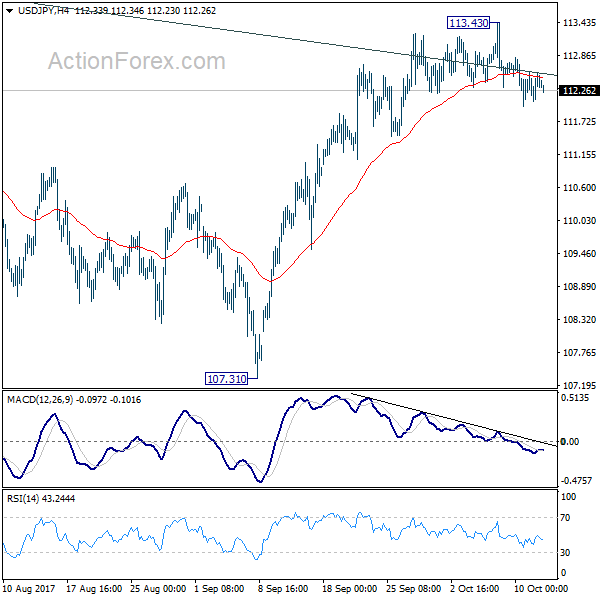
Intraday bias in USD/JPY remains on the downside. The fall from 113.43 short term top would extend to 55 day EMA (now at 111.35) first. Sustained break there will bring retest of 107.31. For now, risk will stays on the downside as long as 113.43 resistance holds.
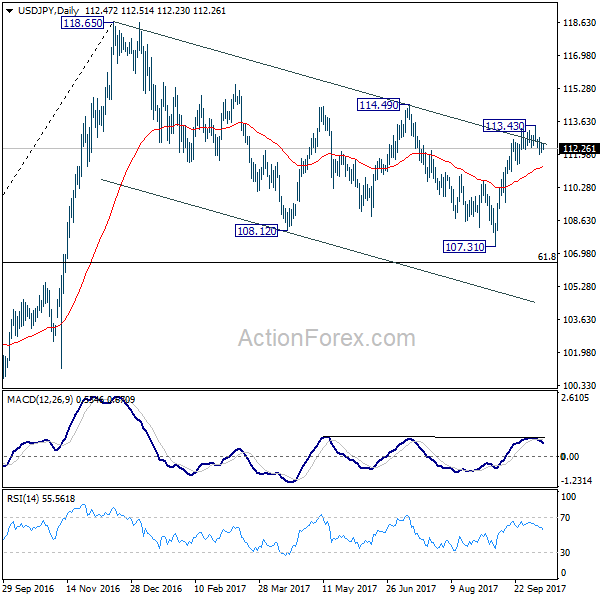
In the bigger picture, rise from 98.97 (2016 low) is seen as the second leg of the corrective pattern from 125.85 (2015 high). It's unclear whether this this second leg has completed at 118.65 or not. But medium term outlook will be mildly bearish as long as 114.49 resistance holds. And, there is prospect of breaking 98.97 ahead. Meanwhile, break of 114.49 will bring retest of 125.85 high. But even in that case, we don't expect a break there on first attempt.
Trade Idea : GBP/USD – Sell at 1.3315
GBP/USD - 1.3256
Most recent candlesticks pattern : N/A
Trend : Down
Tenkan-Sen level : 1.3244
Kijun-Sen level : 1.3220
Ichimoku cloud top : 1.3198
Ichimoku cloud bottom : 1.3151
New strategy :
Sell at 1.3315, Target: 1.3215, Stop: 1.3350
Position : -
Target : -
Stop : -
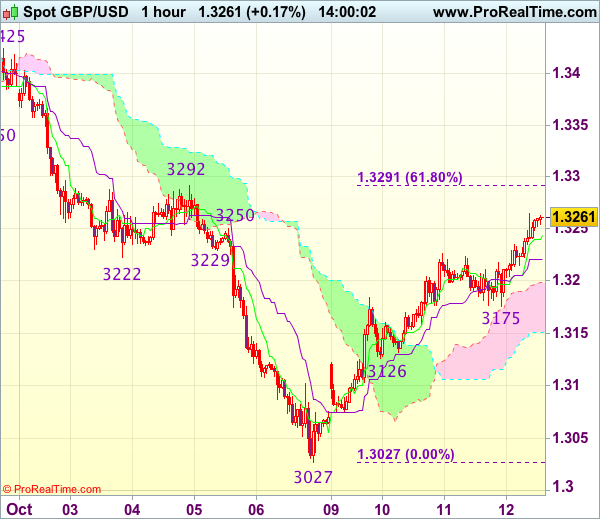
Although cable has surged again after finding renewed buying interest at 1.3175 yesterday and near term upside risk remains for the rise from 1.3027 low to bring retracement of recent decline, reckon upside would be limited to 1.3291-92 (61.8% Fibonacci retracement of 1.3455-1.3027 and previous resistance) and 1.3310-15 (50% Fibonacci retracement of intermediate fall from 1.3596-1.3027) should hold, bring retreat later. Below the Kijun-Sen (now at 1.3220) would bring weakness to 1.3195-00 but break of said support at 1.3175 is needed to signal top is formed.
In view of this, we are inclined to sell cable on further subsequent rise. Above 1.3340-50 would signal the rise from 1.3027 low is still in progress and may extend gain to 1.3375-80 (61.8% Fibonacci retracement of 1.3596-1.3027) but still reckon 1.3400 would hold from here due to overbought condition.
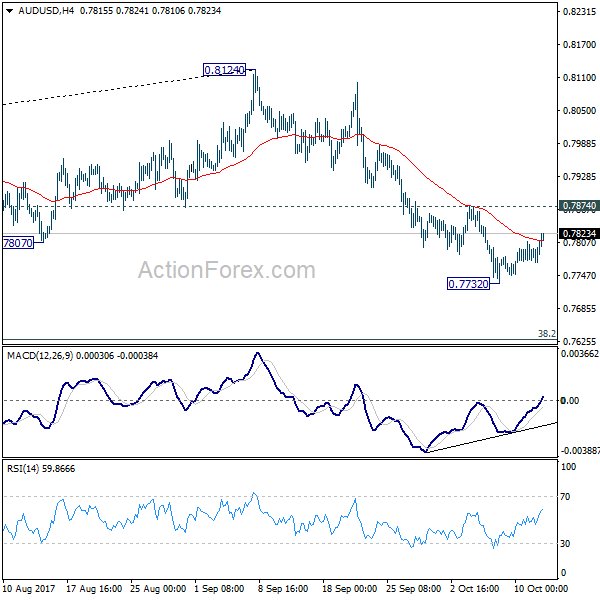
AUD/USD Daily Outlook
Daily Pivots: (S1) 0.7768; (P) 0.7789; (R1) 0.7807; More...
Intraday bias in AUD?USD remains neutral for consolidation above 0.7732 temporary low. Another fall is expected as long as 0.7874 resistance holds. As noted before, rise from 0.7382 is possibly completed at 0.8124 already. Below 0.7732 will target medium term fibonacci level at 0.7628 first. Decisive break there will target 0.7328 key cluster support. On the upside, break of 0.7874 will argue that the decline is completed and turn bias back to the upside.
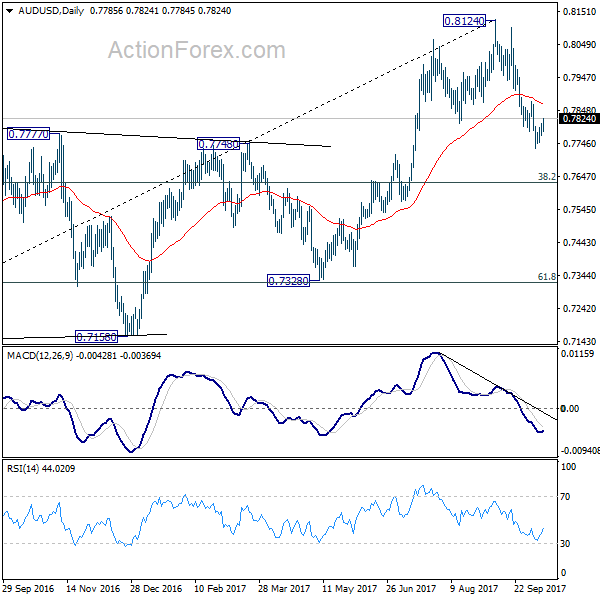
In the bigger picture, rise from 0.6826 medium term bottom is seen as corrective pattern. Current development suggests that it might be completed with three waves up to 0.8124 already. Break of 38.2% retracement of 0.6826 to 0.8124 at 0.7628 will firm this bearish case. And, decisive break of 0.7328 key cluster support (61.8% retracement at 0.7322) will confirm and bring retest of 0.6826 low. In case rise from 0.6826 resumes and extends, strong resistance should be seen at 38.2% retracement of 1.1079 to 0.6826 at 0.8451 to limit upside.