Sample Category Title
Trade Idea : USD/CHF – Stand aside
USD/CHF - 0.9783
Most recent candlesticks pattern : N/A
Trend : Near term up
Tenkan-Sen level : 0.9787
Kijun-Sen level : 0.9791
Ichimoku cloud top : 0.9792
Ichimoku cloud bottom : 0.9790
New strategy :
Stand aside
Position : -
Target : -
Stop : -
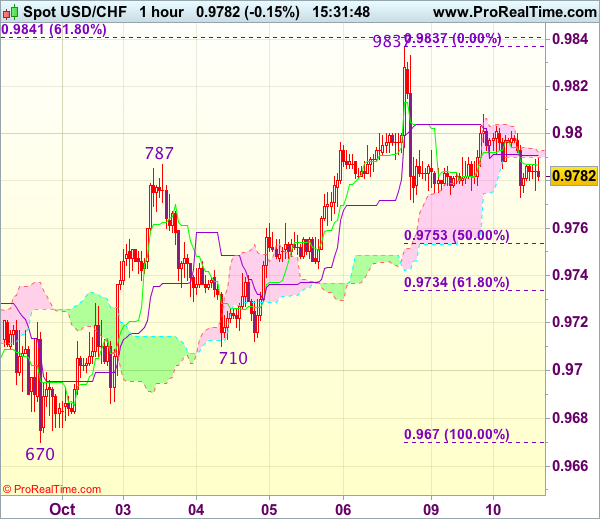
Despite last week’s late rise to 0.9837, the subsequent retreat to 0.9771 suggests top has possibly been formed there and consolidation with mild downside bias is seen for weakness to 0.9750-55 (50% Fibonacci retracement of 0.9670-0.9837), however, break of 0.9730-35 (61.8% Fibonacci retracement) is needed to add credence to this view, bring further fall towards support at 0.9710 which is likely to hold on first testing.
On the upside, whilst recovery to 0.9805-10 cannot be ruled out, reckon said resistance at 0.9837 would hold and bring another retreat later. Above said resistance at 0.9837 would shift risk back to upside and signal the rise from 0.9421 low is still in progress, then gain to 0.9875-80 would follow but reckon 0.9900 would hold from here. As near term outlook is still mixed, would be prudent to stand aside for now.
Dollar Slips Further From 10-Week High, Is The Rally Over?
The dollar index fell for a third consecutive day early Tuesday, despite market expectations of a rate hike in December, hovering near 90%. Since 8 September, the index has rallied almost 3% in a clear sign that the greenback has finally found its feet, after declining more than 12% from January highs. However, investors have almost wholly priced in a third-rate increase for 2017 and now require another catalyst to decide on whether to push the dollar higher from current levels.
The dollar’s strength since early September has been accompanied by a rally in U.S. Treasury yields. U.S. 10-year Treasury yields gained 15% from September lows, sending U.S.- German 10-year rate differentials to a four-month high. It is highly likely that EUR/USD and other major currency pairs will continue to track the interest rate differentials, so traders should keep a close eye on how bond yields behave in the last quarter of 2017.
Another factor supporting the dollar isthe belief that a reduction in taxes and other forms of fiscal stimulus, will materialize in the coming months, leading to tighter monetary policy and further increases in interest rates in 2018 and 2019. However, this depends a lot on Trump’s choice of the next Fed chair.
Higher interest rates will undoubtedly disrupt the current U.S. administration’s economic policy plans. I firmly believe that Trump wants a dovish Fed to keep the U.S. dollar lower,in order to support his economic agenda. In the next couple of weeks, we will start hearing about how Mr. Trump is willing to politicize the independent government agency, the Federal Reserve. In my opinion, this would be a dangerous phase that will lead to a lot of criticism and suspicions amongst investors holding the U.S. currency.
The short-term rally might not be over yet for the dollar, but I prefer selling the rallies than buying the dips at this stage. Let’s not forget that other central banks are also planning to tighten their monetary policies, particularly the BoE and ECB, thus reducing the interest rate advantage currently held by the U.S. dollar.
GBP/JPY Daily Outlook
Daily Pivots: (S1) 147.15; (P) 147.85; (R1) 148.79; More
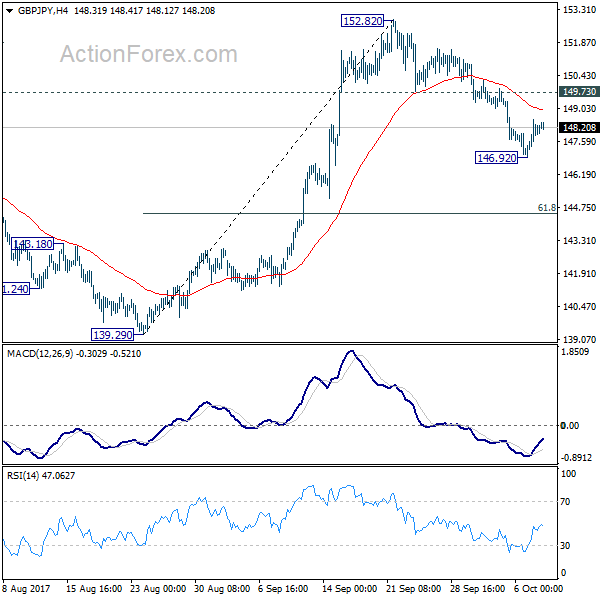
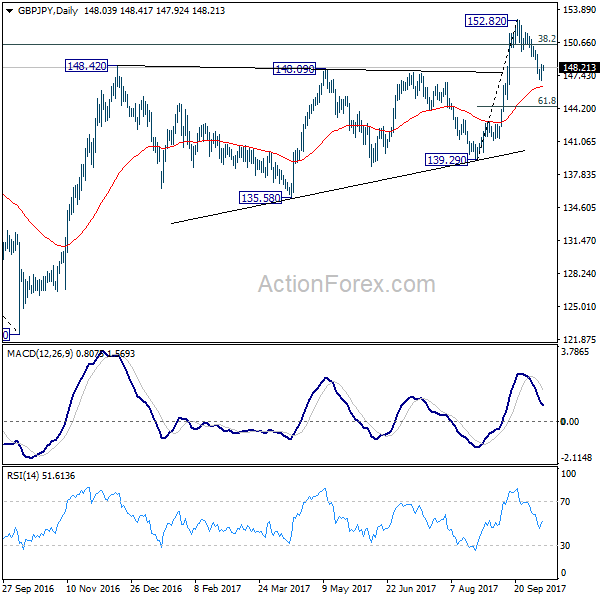
A temporary low is formed at 146.92 and intraday bias is turned neutral first. Another decline is expected with 149.73 intact. Below 146.92 will target 61.8% retracement of 139.29 to 152.82 at 144.45. Such decline is seen as a correction and we'd look for strong support from 144.45 to bring rebound. On the upside, break of 149.73 support turned resistance will argue that the pull back is completed and turn bias back to the upside for retesting 152.82 high. However, sustained break of 144.45 will put 139.29 key support in focus.
In the bigger picture, medium term rebound from 122.36 is still expected to resume after corrective pull back from 152.82 completes. Firm break of 38.2% retracement of 196.85 to 122.36 at 150.43 will carry long term bullish implications. In that case, GBP/JPY could target 61.8% retracement at 167.78. However, break of 139.29 will indicate rejection from 150.43 key fibonacci level. And the three wave corrective structure of rebound from 122.36 will argue that larger down trend is resuming for a new low below 122.26.
Trade Idea : GBP/USD – Hold short entered at 1.3170
GBP/USD - 1.3169
Most recent candlesticks pattern : N/A
Trend : Down
Tenkan-Sen level : 1.3157
Kijun-Sen level : 1.3143
Ichimoku cloud top : 1.3139
Ichimoku cloud bottom : 1.3084
Original strategy :
Sold at 1.3170, Target: 1.3070, Stop: 1.3185
Position : - Short at 1.3170
Target : - 1.3070
Stop : - 1.3185
New strategy :
Hold short entered at 1.3170, Target: 1.3070, Stop: 1.3195
Position : - Short at 1.3170
Target : - 1.3070
Stop : - 1.3195
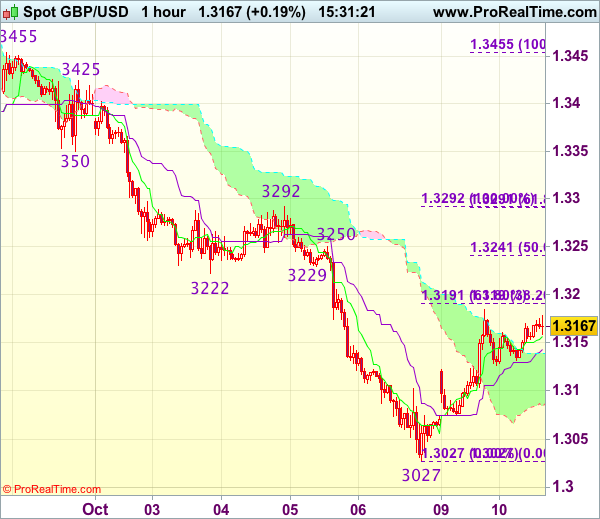
Although cable has maintained a relatively firm undertone after rising to 1.3184 yesterday, still reckon 1.3190-95 (61.8% Fibonacci retracement of 1.3292-1.3027 as well as 38.2% Fibonacci retracement of 1.3455-1.3027) would cap upside and bring retreat later, below 1.3125-30 would bring test of 1.3100, break there would suggest top is formed, bring subsequent fall to 1.3065-75, break there would suggest the rebound from 1.3027 has ended, bring retest of this level, below there would extend recent decline to psychological support at 1.3000 next.
In view of this, we are holding on to our short position entered at 1.3170. Above 1.3190-95 would risk test of previous support at 1.3222-29 (now resistance), break there would abort and signal low has been formed at 1.3027 instead, bring further gain to 1.3250 but price should falter below resistance at 1.3292.
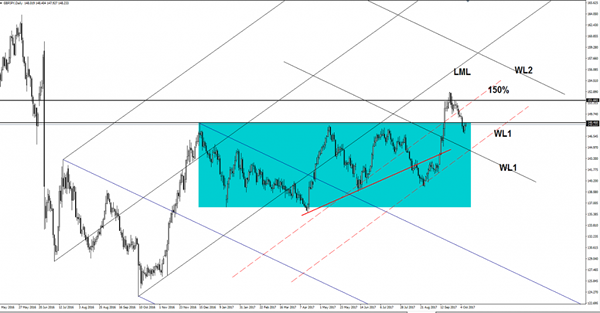
GBP/JPY More Downside In View
Price increased a little and retests the 148.46 static resistance. GBP/JPY is somehow expected to drop further on the short term after the failure to stay above the 250% Fibonacci line (ascending dotted line). The next downside target will be at the WL1of the ascending pitchfork.
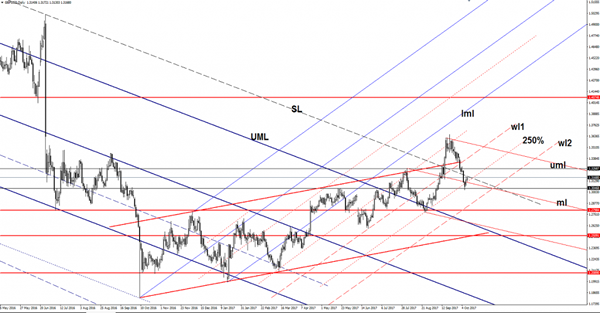
GBP/USD False Breakdown
Price increased and tries to resume the yesterday's minor bullish candle. GBP/USD is approaching the 1.3183 yesterday's high. GBP/USD is almost to reach the outside sliding line (SL) of the major descending pitchfork. A breakout followed by a retest will confirm a further increase. Looks like that we had a false breakdown below the 250% Fibonacci line (ascending dotted line) and below the median line (ml) of the minor descending pitchfork.
A USDX's drop somewhere below the 93.30 level will confirm a further drop in the upcoming period and a USD depreciation. USDX could come down only to retest a support level before will climb higher again, is still expected to reach new highs as the FED is expected to hike the rate in December. I've said in the previous week that the USDX could develop an Inverse Head and Shoulders pattern, a retest of the 92.49 will signal that the pattern is developing, but only a valid breakout above the 93.81 will confirm it.
Price has managed to jump above the median line (ml) of the descending pitchfork and could approach the median line (ml) of the minor ascending pitchfork. EUR/USD should increase further after the failure to close below the 1.1712 horizontal support and after the failure to reach and retest the median line (ML) of the major ascending pitchfork. The pair could still develop a Head and Shoulders pattern if will stay within the descending pitchfork's body. A further increase will be confirmed only after a valid breakout above the 1.2041 major resistance
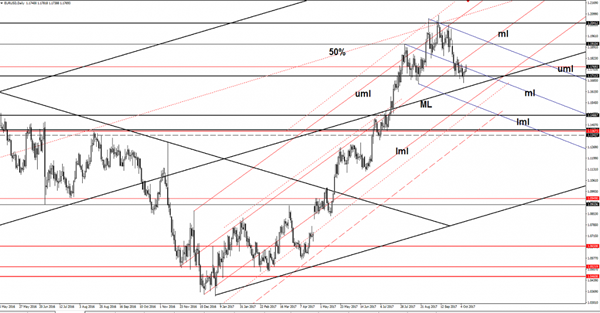
EUR/USD Throwback In Play
The EUR/USD increased in the morning and resumes in the last two day's bullish movement. Price rallies and tries to take out a dynamic resistance as the USD is punished by the USDX's drop. The index is at the third decreasing day and is pressuring an important dynamic support.
A USDX's drop somewhere below the 93.30 level will confirm a further drop in the upcoming period and a USD depreciation. USDX could come down only to retest a support level before will climb higher again, is still expected to reach new highs as the FED is expected to hike the rate in December. I've said in the previous week that the USDX could develop an Inverse Head and Shoulders pattern, a retest of the 92.49 will signal that the pattern is developing, but only a valid breakout above the 93.81 will confirm it.
Price has managed to jump above the median line (ml) of the descending pitchfork and could approach the median line (ml) of the minor ascending pitchfork. EUR/USD should increase further after the failure to close below the 1.1712 horizontal support and after the failure to reach and retest the median line (ML) of the major ascending pitchfork. The pair could still develop a Head and Shoulders pattern if will stay within the descending pitchfork's body. A further increase will be confirmed only after a valid breakout above the 1.2041 major resistance
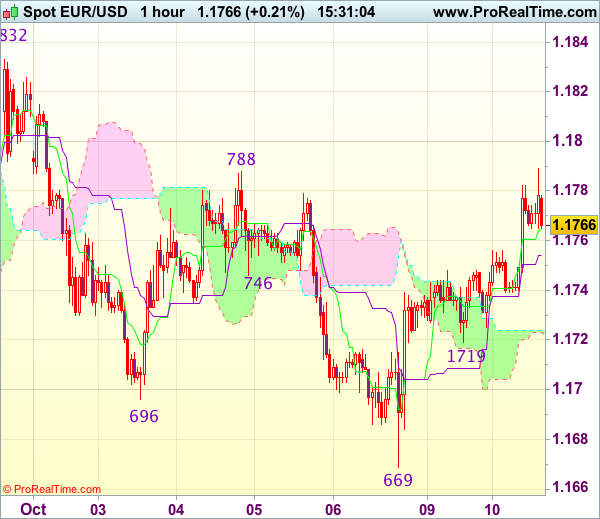
Trade Idea : EUR/USD – Buy at 1.1720
EUR/USD - 1.1770
Most recent candlesticks pattern : N/A
Trend : Down
Tenkan-Sen level : 1.1765
Kijun-Sen level : 1.1754
Ichimoku cloud top : 1.1724
Ichimoku cloud bottom : 1.1723
Original strategy :
Buy at 1.1690, Target: 1.1790, Stop: 1.1655
Position : -
Target : -
Stop : -
New strategy :
Buy at 1.1720, Target: 1.1820, Stop: 1.1685
Position : -
Target : -
Stop : -
As the single currency surged again after brief pullback to 1.1719, adding credence to our view that a temporary low has possibly been formed at 1.1669 last week and consolidation with upside bias remains, a firm break above indicated resistance at 1.1788-89 would bring retracement of recent decline to 1.1800 and later towards resistance at 1.1832 which is likely to hold from here due to near term overbought condition.
In view of this, we are still looking to buy euro on dips as 1.1719 support should limit downside and bring another rebound. Only break of strong support at 1.1662-69 would signal recent decline is still in progress and may extend weakness towards 1.1625-30 but reckon 1.1600 would hold.
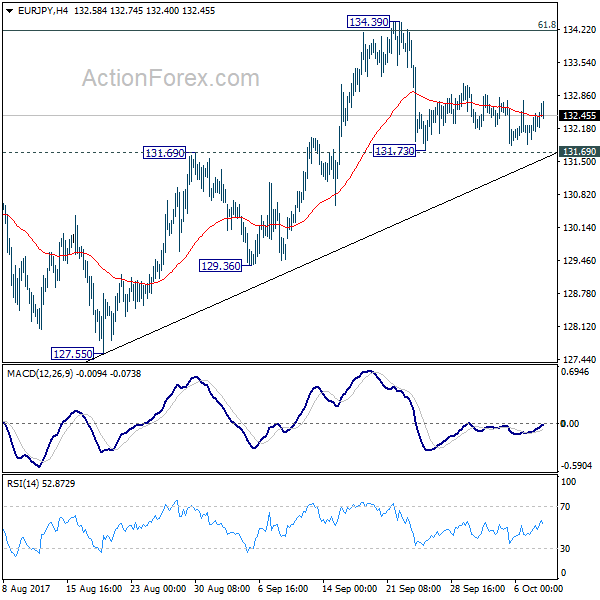
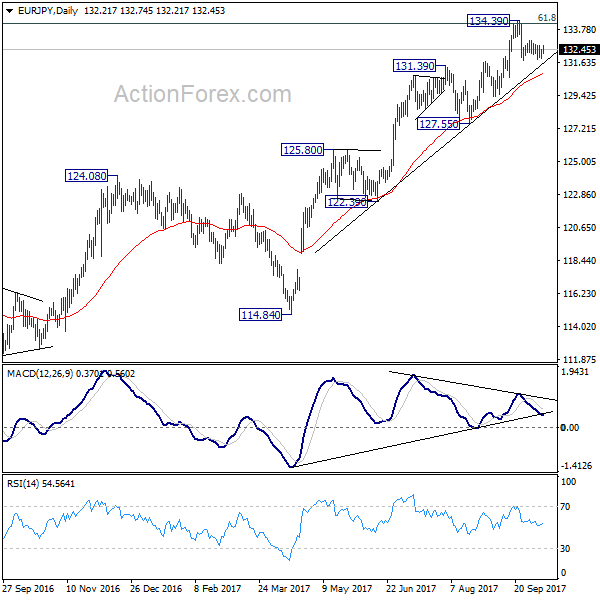
EUR/JPY Daily Outlook
Daily Pivots: (S1) 131.93; (P) 132.21; (R1) 132.58; More...
Intraday bias in EUR/JPY remains neutral for the moment. Near term outlook remains bullish as long as 131.69 holds. Sustained break of 134.20 fibonacci level will extend larger up trend to 141.04 resistance next. However, break of 131.69 will be an early sign of medium term reversal and will target 127.55 key support level instead.
In the bigger picture, medium term rise from 109.03 (2016 low) is seen as at the same degree as the down trend from 149.76 (2014 high) to 109.03 (2016 low). 61.8% retracement of 149.76 to 109.03 at 134.20 is already met. Sustained break there will pave the way to key long term resistance zone at 141.04/149.76. However, break of 127.55 support will argue that the medium term trend has reversal and will turn outlook bearish for deeper fall.
EUR/AUD Daily Outlook
Daily Pivots: (S1) 1.5098; (P) 1.5123; (R1) 1.5166; More....
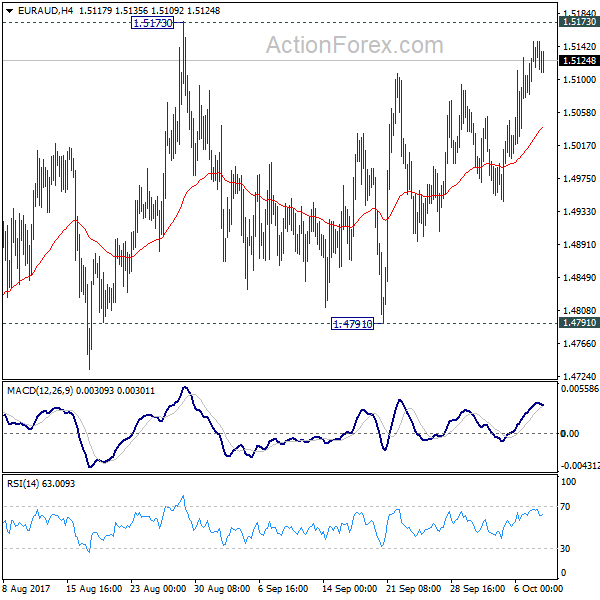
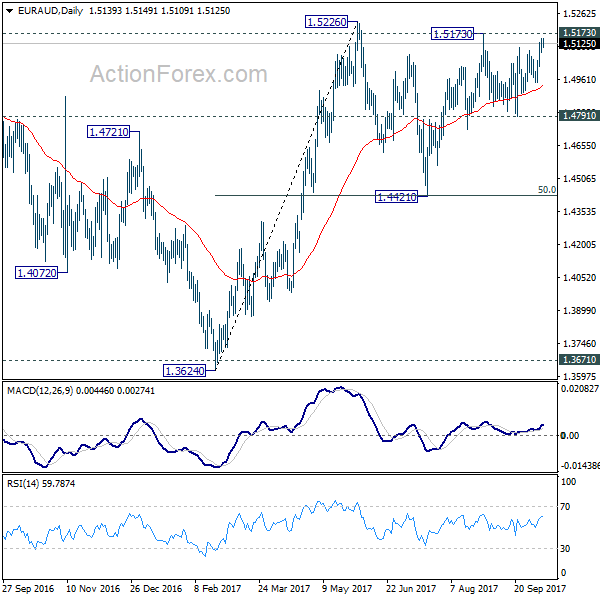
At this point, EUR/AUD is still bounded in range of 1.4791/5173. Intraday bias remains neutral first. On the upside, break of 1.5173/5226 resistance zone will finally resume larger rise from 1.3624. In that case, EUR/AUD will target 1.5644 resistance first. On the downside, break of 1.4791 support will turn bias to the downside and extend the fall from 1.5173 to retest 1.4421 support.
In the bigger picture, we're holding on to the view that corrective decline from 1.6587 medium term top has completed at 1.3624. Rise from 1.3624 is expected to extend to retest 1.6587. The corrective structure of the price actions from 1.5226 is affirming this view. Above 1.5226 will target a test on 1.6587 key resistance. However, break of 1.4421 support will dampen our view and would drag EUR/AUD lower to retest key support zone around 1.3624.