Sample Category Title
US: September Report Affected By Extreme Weather Conditions
Hurricanes likely pulled down jobs growth
We expect the jobs report for September due on Friday will show below trend progress in the labour market due to hurricanes Harvey and Irma. Although we still see underlying strength of the labour market as solid, job creation is usually negatively affected following major hurricanes. We expect employment rose 90,000 in September (although uncertainty is higher than usual) against a 12-month moving average of 175,000 and we expect a broad-based slowdown in job creation. In our view, the negative impact on the labour market should be short-lived, as we have already seen initial jobless claims are beginning to come down again. We do not expect to see a decline in the unemployment rate (although risk is probably skewed towards an increase). Finally, we estimate average hourly earnings to be relatively unaffected by the hurricane season and hence expect an increase of 0.2% m/m, implying wage growth rate of 2.5% y/y, unchanged from August. We expect markets to mainly look at average hourly earnings and not so much nonfarm payrolls and unemployment, unless they surprise on the upside.
While most labour market indicators are now strong, the slack indicators still suggest there is some slack left in the labour market, as the numbers of marginally attached and part-time workers for economic reasons are still high and long-term unemployed is still elevated (see also the spider web chart on the next page). This also suggests that the unemployment gap is not closed yet. One reason might be that people on the edge of the labour market do not have the necessary qualifications, as there are many positions, which businesses are unable to fill.
Fed says it looks beyond weak data due to hurricanes
By announcing 'quantitative tightening' and keeping the 'dot' signal unchanged at one hike this year and three next year, the Fed showed that it still wants to tighten monetary policy gradually, see also FOMC review: Unchanged hiking signals as QT is set to begin next month, 20 September. Despite weak inflation and subdued wage growth, the Fed still thinks it is appropriate to raise rates, as Yellen still has strong belief in the Phillips curve mechanism (tighter labour market will push up wage growth and hence inflation eventually).
It is also worth noting that the Fed has explicitly stated that it does not expect the impact of hurricanes Harvey and Irma to play a role in its monetary policy decisions, since it expects them to impact economic activity only in the short term. This means that we should not see a sharp market reaction to a weak jobs report since it will likely not affect monetary policy.
We expect the Fed to hike once more this year in December due to the focus on the unemployment rate and easy financial conditions.
Daily Wave Analysis: EUR/USD, GBP/USD Continue With Bearish Channels Below Fib Levels
Currency pair EUR/USD
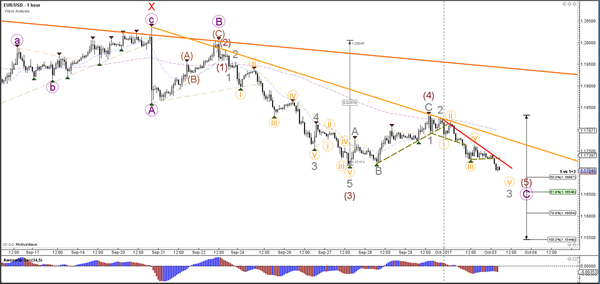
The EUR/USD is trying to break below the 23.6% Fibonacci level. could create a larger ABC (green). A bearish breakout could see price fall towards 1.15 at the 38.2% Fibonacci level of wave 4 vs 3, which in turn could act as potential support.
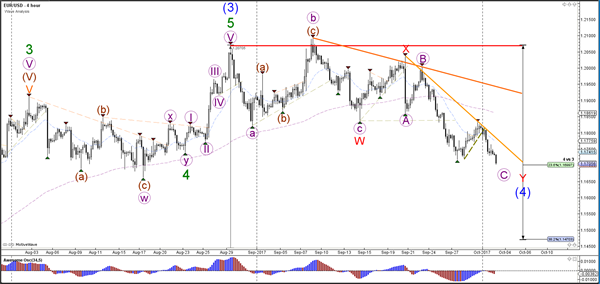
The EUR/USD bullish corrective pattern did not take place as price failed to break above the resistance trend lines (red/orange). Instead, price broke below the previous bottom which could indicate that price is in a wave 3 (grey) of wave C (purple). A break above the resistance trend lines would invalidate the bearish outlook.
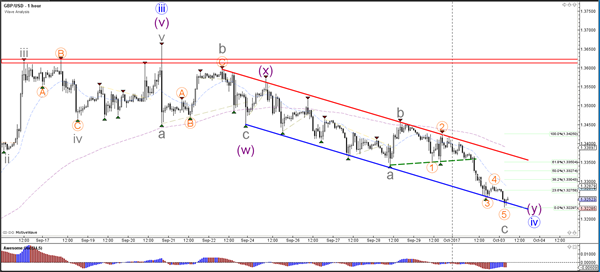
Currency pair GBP/USD
The GBP/USD broke below the 38.2% Fibonacci level and indeed made a bearish breakout towards the 50% Fib of wave 4 vs 3 and the support trend line (blue) as mentioned yesterday. The 1.3250 is an important support zone as they are two trend lines (blue) and a 50% Fib of wave 4 vs 3.
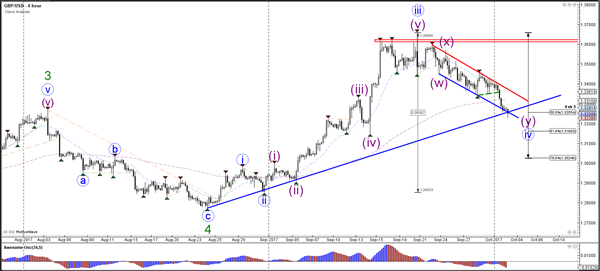
A bullish bounce could price test the of the bearish channel whereas a bearish breakout could see price fall towards the 61.8% Fib of the 4 hour chart. A bullish bounce could face resistance from the Fib levels (green) and from the channel resistance. A breakout above these resistances makes a larger bullish move more likely.
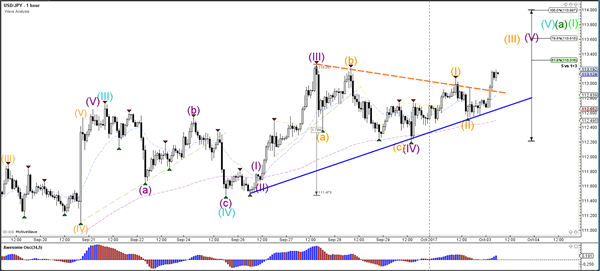
Currency pair USD/JPY
The USD/JPY bounced again at the support trend line (blue), which could indicate the continuation within wave 5 (blue).
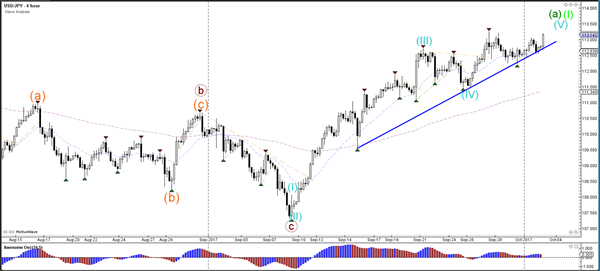
The USD/JPY broke above the resistance trend line (dotted orange) and seems to be heading towards the Fibonacci targets of wave 5 (purple).
Daily Technical Outlook And Review: EUR/USD, GBP/USD, AUD/USD, USD/JPY, USD/CAD, USD/CHF, DOW 30, GOLD
A note on lower timeframe confirming price action...
Waiting for lower timeframe confirmation is our main tool to confirm strength within higher timeframe zones, and has really been the key to our trading success. It takes a little time to understand the subtle nuances, however, as each trade is never the same, but once you master the rhythm so to speak, you will be saved from countless unnecessary losing trades. The following is a list of what we look for:
- A break/retest of supply or demand dependent on which way you're trading.
- A trendline break/retest.
- Buying/selling tails ... essentially we look for a cluster of very obvious spikes off of lower timeframe support and resistance levels within the higher timeframe zone.
- Candlestick patterns. We tend to only stick with pin bars and engulfing bars as these have proven to be the most effective.
We typically search for lower-timeframe confirmation between the M15 and H1 timeframes, since most of our higher-timeframe areas begin with the H4. Stops are usually placed 1-3 pips beyond confirming structures.
EUR/USD
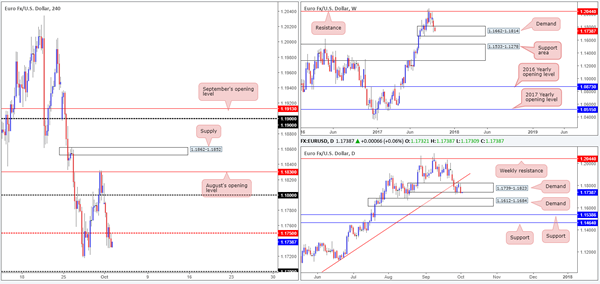
The euro, as you can see, opened the week lower against its US counterpart, consequently placing H4 price beneath the 1.18 handle. The bearish pulse continued to beat throughout the day, eventually wiping out bids around the mid-level support at 1.1750 on stronger-than-expected US ISM manufacturing data.
With 1.1750 engulfed, the 1.17 handle, followed closely by a H4 Quasimodo support at 1.1681, is likely next on tap. Over on the bigger picture, however, weekly price remains trading within the walls of demand at 1.1662-1.1814. Meanwhile, daily action shows the unit confronting the lower edge of demand coming in at 1.1739-1.1823, which could indicate that the pair may be eyeing demand seen below at 1.1612-1.1684.
Suggestions: Watch for H4 price to test 1.17 today and look for the fakeout down to the nearby H4 Quasimodo support level at 1.1681. Psychological numbers are typically prone to fakeouts due to the amount of orders that these levels attract. This – coupled with the fact that the Quasimodo is also positioned around the top edge of daily demand mentioned above at 1.1612-1.1684 and located within the lower limits of the said weekly demand, makes this is a high-probability buy, in our opinion.
Data points to consider: FOMC member Powell speaks at 1.30pm GMT+1.
Levels to watch/live orders:
- Buys: Watch for H4 price to fake through 1.17 and attack H4 Quasimodo support at 1.1681 ([waiting for a H4 bullish pin-bar to form here is advised] stop loss: either beyond the fakeout candle’s tail or beneath the lower edge of weekly demand at 1.1660).
- Sells: Flat (stop loss: N/A).
GBP/USD
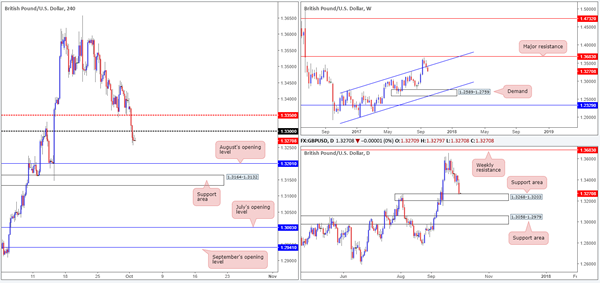
The British pound suffered going into yesterday’s sessions as the sellers pummeled the market from the word go! Aided by a less-than-stellar UK Manufacturing PMI print, H4 action ended the day firmly crossing below the 1.33 handle. Should the bears remain in the driving seat here, the next port of call will likely be August’s opening level pegged at 1.3201, shadowed closely by a support area seen at 1.3164-1.3132.
Looking over to the higher timeframes, weekly price recently re-entered the ascending channel formation (1.1986/1.2673). We know there’s a lot of ground to cover, but this move could have potentially opened up downside to as low as the demand area positioned at 1.2589-1.2759. On the flip side, daily activity is currently seen challenging the top edge of a support area coming in at 1.3268-1.3203. A violation of this area will likely clear the river south down to as far as another support area seen at 1.3058-1.2979.
Suggestions: Shorting based on weekly structure is a little too risky for our liking, considering the position of daily price right now. For that reason, shorting below 1.33 is not something we’re going to be taking part in.
Data points to consider: UK Construction PMI at 9.30am. FOMC member Powell speaks at 1.30pm GMT+1.
Levels to watch/live orders:
- Buys: Flat (stop loss: N/A).
- Sells: Flat (stop loss: N/A).
AUD/USD
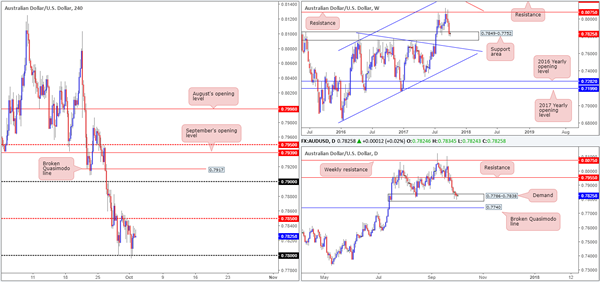
Kicking off this morning’s report with a quick look at the weekly chart, we can see that buyers and sellers remain battling for position within the walls of a support area penciled in at 0.7849-0.7752. This zone has a strong history and held well as support during the month of August, thus there’s a good chance that we may see history repeat itself here. In support of the current weekly zone, a strong daily demand base logged at 0.7786-0.7838 is seen painted within its boundaries. While as of current price the market is bid from this daily barrier, traders might want to note that should this area give way, the next port of call will likely be a nearby broken daily Quasimodo line seen at 0.7740.
As expected, H4 price drove lower in opening trade on Monday and attempted to breach the 0.78 handle. The unit, as far as we can tell, is well-bid from this psychological level given that the number is positioned within the higher-timeframe support areas!
Suggestions: As of current price, we see two possible setups:
Wait for H4 price to CLOSE above the nearby mid-level resistance at 0.7850, and then look to trade any retest seen thereafter, targeting the 0.79 handle, followed closely by a broken Quasimodo line at 0.7917.
As stop-loss orders are still likely active beneath 0.78, a whipsaw through this number in the shape of a H4 buying tail (pin bar) would be attractive. Once/if this is seen, traders could look to become buyers on the candle close, targeting 0.7850 as an initial take-profit zone.
Data points to consider: RBA interest rate decision and statement at 4.30am. FOMC member Powell speaks at 1.30pm GMT+1.
Levels to watch/live orders:
- Buys: 0.78 region ([watch for a H4 pin-bar candle to whipsaw through this number before pulling the trigger] stop loss: ideally beyond the pin bar’s tail). Watch for H4 price to engulf 0.7850 and then look to trade any retest seen thereafter ([waiting for a H4 bullish candle to form in the shape of a full or near-full-bodied candle following the retest is advised] stop loss: ideally beyond the candle’s tail).
- Sells: Flat (stop loss: N/A).
USD/JPY:
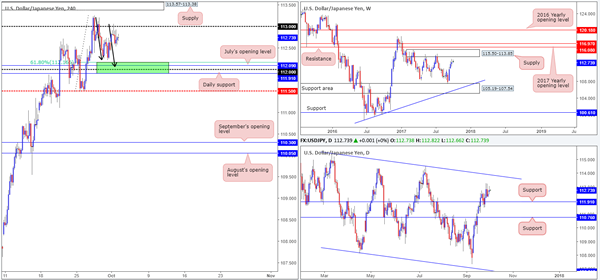
During the course of Monday’s sessions, the USD/JPY advanced north in early trading and crossed swords with the 113 handle. As you can see though, the pair failed to sustain gains beyond this psychological number and managed to clock a low of 112.53 amid US opening trade.
Assessing the weekly chart’s structure, the piece looks poised to challenge nearby supply coming in at 115.50-113.85. In conjunction with weekly flow, we can also see daily price respecting support at 111.91 and showing space for the unit to move north up to at least the trendline resistance extended from the high 115.50 (intersects with the aforementioned weekly supply zone).
The road to 112 remains in view and is still, as highlighted in Friday’s report, an incredibly appealing level at the moment. Here’s why:
Positioned directly above daily support at 111.91.
Located just below July’s opening level at 112.09.
Nearby a 61.8% H4 Fib support at 112.16 taken from the low 111.47.
H4 AB=CD completion point at 112.06 (see black arrows).
Suggestions: With space seen for both weekly and daily action to push higher, coupled with the 112 handle’s surrounding confluence mentioned above, a long from the green H4 buy zone is worthy of attention. As psychological levels are prone to fakeouts, however, you may want to wait for H4 price to confirm buyer intent before pulling the trigger. For us, this would simply be a full or near-full-bodied bullish candle formed within the green zone, which would, in our view, provide enough evidence to hold the position up to at least 113/H4 supply at 113.57-113.38.
Data points to consider: FOMC member Powell speaks at 1.30pm GMT+1.
Levels to watch/live orders:
- Buys: 111.91/112.16 ([waiting for a reasonably sized H4 bullish candle to form – preferably a full, or near-full-bodied candle – is advised] stop loss: ideally beyond the candle’s tail).
- Sells: Flat (stop loss: N/A).
USD/CAD
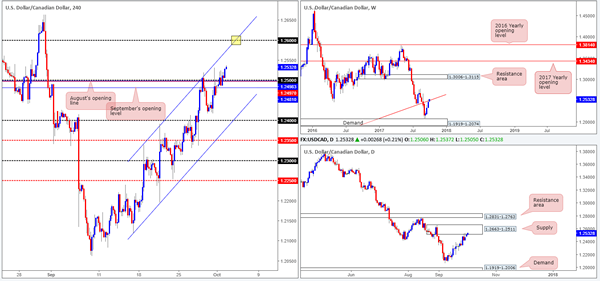
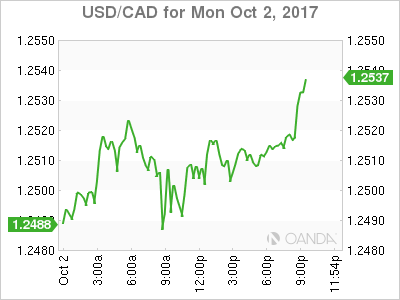
Reinforced by a robust US dollar and an upbeat US ISM Manufacturing PMI, the USD/CAD conquered the 1.25 handle on Monday and tapped a high of 1.2524 on the day. Although daily action resides within supply seen at 1.2663-1.2511 and weekly price at a trendline resistance extended from the low 0.9633, H4 price shows room to advance up to the 1.26 handle which happens to fuse beautifully with a channel resistance etched from the high 1.2338 (yellow rectangle).
Suggestions: In view of the unit’s position on both the weekly and daily charts, we would strongly advise not buying this market today since one can never really know when higher-timeframe sellers will make an appearance! This –
coupled with the pair trading in a clear downtrend at the moment, we feel price is extremely overbought. To that end, the best course of action we feel is to simply wait and see if H4 price connects with 1.26 for a high-probability sell trade.
Data points to consider: FOMC member Powell speaks at 1.30pm GMT+1.
Levels to watch/live orders:
- Buys: Flat (stop loss: N/A).
- Sells: 1.26 region [waiting for a reasonably sized H4 bearish candle to form – preferably a full, or near-full-bodied candle – is advised] stop loss: ideally beyond the candle’s wick).
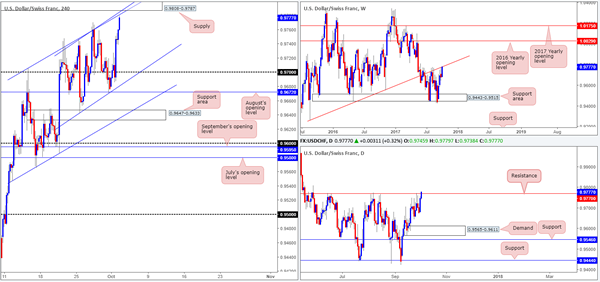
USD/CHF
The impact of Monday’s hotter-than-expected US ISM Manufacturing PMI print saw the USD/CHF springboard north. Following this, the pair remained in a bullish state and has just this minute connected with two H4 channel resistances etched from highs of 0.9705/0.9746. It might also be worth noting that directly above these lines is a H4 supply zone pegged at 0.9808-0.9787 that houses the 0.98 handle.
Over on the bigger picture, weekly price is currently kissing the underside of a trendline resistance extended from the low 0.9257. In addition to this, traders may have also noticed that daily flow is trading around resistance fixed at 0.9770.
Suggestions: Owing to the collective resistances seen on each timeframe, today’s spotlight will firmly be focused on shorts. As such, a pending sell order has been set at 0.9787 (the underside of the current H4 supply) and a stop positioned above the zone at 0.9810. Ultimately, we will be looking to trail this position down to the 0.97 neighborhood.
Data points to consider: FOMC member Powell speaks at 1.30pm GMT+1.
Levels to watch/live orders:
- Buys: Flat (stop loss: N/A).
- Sells: 0.9787 ([pending order] stop loss: 0.9810).
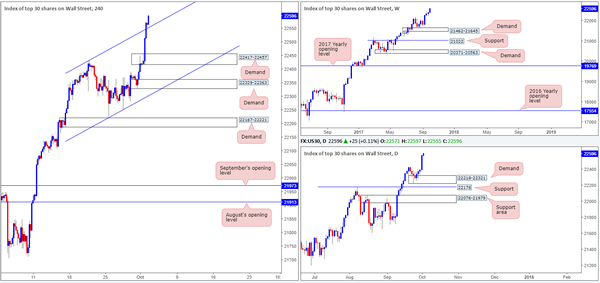
DOW 30
US stocks aggressively extended recent gains, pushing the index to a fresh record high of 22575! The move, as far as we can tell, was not only influenced by upbeat US data but also over the tax reform plans proposed by the Trump administration.
With H4 price now trading proud above a recently broken channel resistance extended from the high 22431, we see little reason why the market will not continue to punch higher today.
Suggestions: To take advantage of any potential move north, we would strongly recommend waiting for H4 price to pullback and retest the recently broken channel resistance as support. A retest, coupled with a reasonably strong H4 bull candle (a full or near-full-bodied candle) would, in our technical view, be ideal buying conditions.
Data points to consider: FOMC member Powell speaks at 1.30pm GMT+1.
Levels to watch/live orders:
- Buys: Watch for H4 price to retest channel support ([waiting for a reasonably sized H4 bullish candle to form – preferably a full, or near-full-bodied candle – following the retest is advised] stop loss: ideally beyond the candle’s tail).
- Sells: Flat (stop loss: N/A).
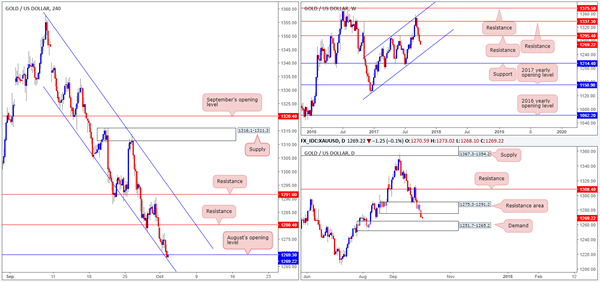
GOLD
Across the board the US dollar gravitated north on Monday, consequently pressuring the yellow metal lower.
As can be seen on the H4 timeframe this morning, the buyers and sellers are currently battling for position around August’s opening level at 1269.3 which happens to merge nicely with a channel support chalked in from the low 1323.0.
Supporting a bounce from this angle is the daily USDX chart which is now within striking distance of crossing swords with a channel resistance etched from the high 12635. Conversely, however, daily action on gold shows we may see price extend down to nearby demand painted at 1251.7-1265.2, after the unit broke through demand at 1275.3-1291.2 (now acting resistance area). The flip side to this is the weekly chart. Last week’s breach of support at 1295.4 (now acting resistance) opens the door for further selling down to as far as the channel support extended from the low 1122.8.
Suggestions: As much as we want to long August’s opening level at 1269.3, the threat of further selling on the bigger picture is just too great for us at this time (see above in bold). So, why not sell then? Good question! This, unfortunately, would equally place one in a difficult position, in our view. Not only would you be selling into a monthly opening level and H4 converging channel support, you’d also have to contend with possible buying from nearby daily demand mentioned above at 1251.7-1265.2.
Therefore, remaining on the sidelines may be the better path to take today.
Levels to watch/live orders:
- Buys: Flat (stop loss: N/A).
- Sells: Flat (stop loss: N/A).
European Open Briefing: Equity Markets Across The Asia-Pacific Region Opened Higher On Tuesday
Global Markets:
- Asian stock markets: Nikkei up 0.88 %, Shanghai Composite rose 0.28 %, Hang Seng gained 1.51 %, ASX 200 down 0.28 %
- Commodities: Gold at $1272.56 (-0.26 %), Silver at $16.59 (-0.38 %), WTI Oil at $50.46 (-0.24 %), Brent Oil at $55.91 (-0.37 %)
- Rates: US 10-year yield at 2.35, UK 10-year yield at 1.32, German 10-year yield at 0.46
News & Data:
- (AUD) Building Approvals m/m 0.4 % vs 1.1 % expected
- (AUD) Cash Rate 1.50 % vs 1.50 % expected
- (EUR) Retail Sales y/y -0.2 % vs 0.5 % expected
- (EUR) Spanish Manufacturing PMI 54.3 vs 53.2 expected
- (GBP) Manufacturing PMI 55.9 vs 56.3 expected
- (EUR) Unemployment Rate 9.1 % vs 9.0 % expected
- (USD) ISM Manufacturing PMI 60.8 vs 57.9 expected
- (CHF) Manufacturing PMI 61.7 vs 60.6 expected
- Oil prices fall for second day on oversupply concerns
- Fed's Yellen says AIG's threat to stability is reduced after downsizing- RTRS
Markets Update:
Equity markets across the Asia-Pacific region opened higher on Tuesday tracking record closes on Wall Street backed by Strong factory data & the prospect for American tax cuts boosting confidence. The Upbeat economic data lifted the dollar emboldening bulls who drove U.S. equities to fresh record highs. However weaker oil prices took their toll on some market segments.
USDJPY was seen trading higher as the USD managed to add a few points in the session. Price is currently seen trading at 113.10 as the Yen lost 0.3 percent against the US Dollar. The exporter stocks benefited from the weaker yen as the Nikkei Stock Average NIKKEI 225 was up 0.8%
EURUSD is currently seen trading at 1.1704 as the Euro lost 0.2 percent against the US Dollar, losing over 40 points from the session highs managing to hold just above the round number 1.1700 where Price is currently seen ranging. The dollar index, which tracks the dollar against a basket of currencies rose 0.3 percent and is currently valued at 93.85.
AUDUSD dropped to lows of around 0.7790 as the Aussie dollar lost over 30 points on the session as the Reserve Bank of Australia announced no change to cash rate, as expected. Australian shares also opened in red, slipping 0.6 percent, pressured by consumer and energy shares.Currently the AUD is seen trading around the round number 0.7800. The New Zealand dollar fell to fresh session lows of 0.7158 along with the AUD and is currently seen trading at 0.7168 after recovering partially.
Upcoming Events:
- All Day – (EUR) German Bank Holiday
- Tentative – (NZD) GDT Price Index
- 07:00 GMT – (EUR) Spanish Unemployment Change
- 08:30 GMT – (GBP) Construction PMI
- 08:30 GMT – (GBP) FPC Meeting Minutes
- 09:00 GMT – (EUR) PPI m/m
- 12:30 GMT – (USD) FOMC Member Powell Speaks
CRUDE OIL – Looks To Weaken Further On Bear Pressure
CRUDE OIL - With the commodity selling off on Monday, further bearishness is likely. On the downside, support resides a50.00 level where a break will expose the 49.50 level. A cut through here will set the stage for a run at the 49.00 level. Further down, support resides at the 48.50 level. On the upside, resistance resides at the 51.00 level. Further out, resistance comes in at the 51.50 level. A break above here will aim at the 52.00 level and then the 52.50 level followed by the 53.00 level.. All in all, CRUDE OIL remains biased to the downside medium term.
Dollar Firms On Positive PMI Data, Euro Steadies After Being Under Pressure Due To Catalonia Worries
Greenback in Technical Rebound; Long Term Outlook Bearish. The US dollar got boosted from Manufacturing PMI on Monday, but the longer term outlook still looking bearish owing to a number of factors. Even though the US economy looks pretty healthy, judging from GDP figures, there are other factors that influence the US dollar such as geopolitics tensions in the Korean peninsula and Fed decision to reduce its balance sheet. The Fed’s balance sheet had ballooned after it started buying bonds and mortgage-backed securities, now it’s going to simply stop reinvesting into these bonds on a gradual basis starting from this month as they mature. Investors are right to be cautious because interest rates will rise when the Fed stops buying these debt papers. This is the reason why the outlook for the greenback is still bearish.
The Euro Steadied After Sliding in Response to Violence-Marred Catalonia. The euro was steady at $1.1731 after sliding 0.7 percent against a dollar boosted by data overnight. The common currency took a knock on Monday as Spain faced its biggest constitutional crisis in decades after Sunday’s independence referendum in Catalonia.
Dollar’s Advance vs Yen Slows on Caution Before Japan Vote. The dollar was flat at 112.750 against the yen on Tuesday with its advance as traders considered the implications of Japan’s snap general election later in the month. Market participants try to hedge against currency risk and volatility through the use of risk reversals, in which “puts” give them the option to sell.
Gold Slips to 7-wk Low as US Yields Rise. Gold has fallen to its lowest in nearly seven weeks as rising US Treasury yields pushes the US dollar higher while concern over violence during Catalonia’s independence vote at the weekend weighed on the euro. Today’s downside move has resulted in gold prices breaking below critical price support at $1280 per ounce.
Oil Prices Fall on Oversupply Concerns. Oil edged lower on Tuesday, declining for a second day and sapping more strength from a third-quarter rally, amid signs that a global glut in crude may not be clearing as quickly as bulls had hoped. U.S. crude was down 0.3 percent, at $50.43 a barrel, Brent crude was down 0.3 percent, at $55.94 a barrel.
Watch Out Today for:
03:30 am GMT: AUD RBA Interest Rate Decision
08:30 am GMT: GBP Construction PMI
Oil’s Drop Is No Barrel Of Fun
Oil's extended speculative long positioning feels the heat as crude runs out of momentum.
The unwind in long crude positioning continued overnight, with WTI falling 1.90 % and Brent 1.00% respectively. Separate Bloomberg and Reuters surveys pointing to higher than expected OPEC production in September was enough to see the rot set in. This, however, was more an excuse then the underlying reason, with extended speculative long positioning in both contracts the real culprit. The surveys gave nervous traders the excuse to run for the exit door with WTI faring the worse as it broke its September trendline support at 51.15 spurring more stop-loss selling.
As the dust settles, we could face a deeper correction in the near term as the street seems to have run out of reasons to keep buying crude at elevated levels. This means that we may need to see speculative long positioning further degraded before the street can turn back to oils increasing positive fundamentals. Most particularly the backwardation in the prompt Brent futures contracts.
Brent
Brent spot dropped as low as 55.50 overnight on stop-loss selling before climbing to 56.10 this morning. We have now closed below the 56.50/57.50 long-term breakout region, which is a disappointing technical development. Support is now at 55.50 and then the triple bottom at 54.80 with a break opening a test back to the 56.00 area. Above, resistance is at 56.90 and then 57.60.
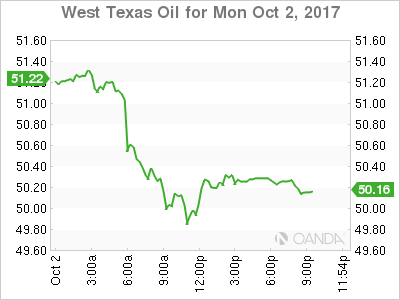
WTI
WTI spot fell from 51.30 to 49.80 at one stage as the herd cut longs positioning before rallying to 50.20 this morning. Key support lies at the multiple daily low and the 200-day moving average at 49.25 with a break opening up more downside pain to potentially below 48.00. Resistance is now distant at 51.40.
WTI Daily
This week's API and DOE Crude inventory data will now take on much more significance as other price drivers have run out of steam.
Market Morning Briefing: Good Strength In The Dollar Yesterday
STOCKS
Most indices gained sharply contrary to expectations but could soon test resistance levels from where some rejection is possible.
Dow (22557.60, +0.68%) shot up after the ISM Manufacturing index soared to 60.8 in September, the highest since 2004. Dow is headed towards 22600-22750 levels from where a rejection is expected which could push back the index towards 22430-22400 levels n the medium term.
Dax (12902.65, +0.58%) has indeed tested 12900 as expected and looks strongly bullish just now. The index could soon test the previous high of 12951 seen in Jun’17. In case a break above 12951 is seen, we may expect a test of 13000 in the near term. Trend looks potentially bullish.
Nikkei (20560.79, +0.78%) has broken above the previous high of 20481, contrary to our expectation and could be headed towards 20700 in the coming sessions from where some rejection is possible. While Dollar Yen is headed towards 113.50-114.00 levels, Nikkei could remain bullish in the near term.
Shanghai (3348.94, +0.28%) is almost stable within 3360-3325 region and could trade sideways for a few more sessions before resuming the uptrend.
Nifty (9788.60, +0.20%) has fair chances of testing 9875-9900 while above 9700. 9900 could act as a decent near term resistance which could push the index back towards 9700 or lower in the coming sessions.
COMMODITIES
Overall commodities look bearish for the coming sessions.
Gold (1270.22) is coming off as expected. 1260 is the immediate downside from where a slight bounce could occur. In the longer run we could see a test of 1250. Near to medium term looks bearish.
Silver (16.55) could come off to 16.25 in the near term. Maximum upside of 16.75 is seen in the next few sessions. Near term looks bearish. .
Brent (55.89) has been falling since the last few sessions and could find some support near 55 while WTI (50.42) fell sharply yesterday from 51.67 to 50.08. WTI looks bearish now and could now target 49.50-49.00 in the near term before bouncing back from there.
Copper (2.9350) came off from 3.00 and could re-test support at 2.90. Consolidation in the 2.90-3.00 region is possible for a few sessions.
FOREX
Good strength in the Dollar yesterday (Monday), with the Dollar Index (93.87) coming close to 94.00 enroute 94.51; the Euro (1.1707) breaking below last week's low of 1.1716 and Dollar-Yen (113.10) rising again after having dipped to 112.09 last week.
With this, Dollar-Yen (113.10) could test crucial Resistance at 113.50-60 this week, and the Euro-Yen (132.44) may find immediate Support at 132.00, the 21-day MA, reducing the chances of falling towards 131.00.
For the Euro (1.1707), it seems the market has decided to push it lower towards 1.1665. With Resistance at 94.51 on the Dollar Index, the Euro too might find Support near 1.1665.
The Pound (1.3249) also fell sharply yesterday, in line with our view that the upmove since 1.1985 (Jan '17) may have ended. Medium term target can be 1.30, with immediate Supports seen near 1.32 and 1.3150.
A low of 0.7781 has been seen on the Aussie (0.7820) yesterday, which might turn out to be a Support for the week. Else, there may be room down to 0.7750-00. We have to see how it behaves today.
Dollar-Yuan (6.6532) saw a high of 6.6819, a little short of our target of 6.70, and has come off a bit. This now suggests chances of sideways consolidation between 6.62-6.70 over the next couple of weeks. Dollar-Rupee had closed at 65.29 on Friday, but is trading higher near 65.50 on the NDF just now. Support is seen at 65.20-10-00 now.
INTEREST RATES
US Yields (5Yr 1.93%, 10Yr 2.34% and 30Yr 2.88%) trade marginally higher than Friday. As mentioned, the 10Yr (2.34%) may rise towards 2.50%, while the 30Yr (2.88%) may rise towards 3.00%.
The US Yield Curve has dipped a bit though, contrary to expectation, with the 30-10 (0.54%) down a bit from 0.56% and 0.60% earlier, and the 30-5 (0.95%) down from 0.96% and 0.99%. But, Supports should be available near 0.54% and 0.90% respectively.
The RBI policy is due today. It is reported that most players expect the RBI to do nothing and keep rates on hold today. The 10Yr GOI (6.6632%) remains below 6.70% now and we anticipate a dip towards 6.60% over the coming days/ weeks.
Contrary to our expectation of resistance near 2.24%, the US-Japan 10Yr Spread (2.26%) could be breaking to the upside, supporting the rise in Dollar-Yen (113.10).
(RBA) Statement by Philip Lowe, Governor: Monetary Policy Decision
At its meeting today, the Board decided to leave the cash rate unchanged at 1.50 per cent.
Conditions in the global economy have improved. Labour markets have tightened and above-trend growth is expected in a number of advanced economies, although uncertainties remain. Growth in the Chinese economy is being supported by increased spending on infrastructure and property construction, with the high level of debt continuing to present a medium-term risk. Australia's terms of trade are expected to decline in the period ahead but remain at relatively high levels.
Wage growth remains low in most countries, as does core inflation. Headline inflation rates are generally lower than at the start of the year, largely reflecting the earlier decline in oil prices. In the United States, the Federal Reserve has indicated that it will begin the process of balance sheet normalisation in October and that it expects to increase interest rates further. In the other major economies, there is no longer an expectation of additional monetary easing. Financial markets have been functioning effectively and volatility remains low.
The Australian economy expanded by 0.8 per cent in the June quarter. This outcome and other recent data are consistent with the Bank's expectation that growth in the Australian economy will gradually pick up over the coming year.
Over recent months there have been more consistent signs that non-mining business investment is picking up. A consolidation of this trend would be a welcome development. Business conditions as reported in surveys are at a high level and capacity utilisation has risen. A large pipeline of infrastructure investment is also supporting the outlook. Against this, slow growth in real wages and high levels of household debt are likely to constrain growth in household spending.
Employment has continued to grow strongly over recent months. Employment has increased in all states and has been accompanied by a rise in labour force participation. The various forward-looking indicators point to solid growth in employment over the period ahead, although the unemployment rate is expected to decline only gradually over the next couple of years.
Wage growth remains low. This is likely to continue for a while yet, although the stronger conditions in the labour market should see some lift in wage growth over time. Inflation also remains low and is expected to pick up gradually as the economy strengthens.
The Australian dollar has appreciated since mid year, partly reflecting a lower US dollar. The higher exchange rate is expected to contribute to continued subdued price pressures in the economy. It is also weighing on the outlook for output and employment. An appreciating exchange rate would be expected to result in a slower pick-up in economic activity and inflation than currently forecast.
Growth in housing debt has been outpacing the slow growth in household incomes for some time. To address the medium-term risks associated with high and rising household indebtedness, APRA has introduced a number of supervisory measures. Following some tightening in credit conditions, growth in borrowing by investors has slowed a little recently. In the housing market, conditions continue to vary considerably around the country. Housing prices have been rising briskly in some markets, while in others they have been declining. In Sydney, where prices have increased significantly, there have been further signs that conditions are easing. In the eastern capital cities, a considerable additional supply of apartments is scheduled to come on stream over the next couple of years. Rent increases remain low in most cities.
The low level of interest rates is continuing to support the Australian economy. Taking account of the available information, the Board judged that holding the stance of monetary policy unchanged at this meeting would be consistent with sustainable growth in the economy and achieving the inflation target over time.
September Payroll Preview: Buckle Up
Work disruptions due to Hurricanes Harvey and Irma are likely to knock down payroll growth substantially in September. We expect payrolls to rise only 55,000 and for the unemployment rate to edge up temporarily.
Will September Snap the Payroll Streak?
September is set to be a wild month for payroll employment following the landfall of Hurricanes Harvey and Irma. It bears the potential to interrupt the 83 consecutive months of employment growth. The payroll figures stand to be negatively impacted via two channels. First, payrolls are likely to be depressed by work disruptions having delayed routine hiring. Second, employees who didn't get paid because they weren't able to work during the pay period covering September 12 will not show up on payrolls. This would have the biggest impact on the one-third of firms with weekly pay periods, particularly in Florida where Irma made landfall during the survey week. The extent to which typically employed workers were not able to work during this period will be illustrated in the household survey (top chart) and leads up to expect a temporary uptick in the unemployment rate to 4.5 percent.
Lessons from Mesdames Katrina and Rita
To get a sense of how big a blow the storms may deal payrolls, we revisit the impact of Hurricanes Katrina and Rita in 2005. The timing of the two storms was similar to that of Harvey and Irma, with Katrina making landfall in late August and Rita coming ashore in September. From a business cycle perspective, Katrina and Rita also struck well into the economy's expansion, whereas Superstorm Sandy was earlier in the expansion and later in the year.
Following Hurricanes Katrina and Rita, payroll employment was initially reported to have contracted by 35,000 jobs. That marked a 120 percent drop, or 204,000 jobs, from the average over the prior three months. A similar sized drop relative to the current three-month average would result in a decline of 35,000 jobs in September. Applying the more modest 75 percent hit from the revised data for the period equates to payrolls slowing to a gain of 46,000 (middle chart).
Initial jobless claims therefore provide an additional guidepost. Initial claims in September have thus far averaged 278,000 which is 17 percent above August's average. That compares to a 21 percent rise in September 2005 (bottom chart).
Recent events do not perfectly follow those of 2005. While Houston was never fully evacuated like New Orleans, the metro area hosts a population five times larger. And whereas Rita struck after the survey week in 2005, Irma arrived right at the start of the survey week. Using the initial claims print for the survey week in our usual monthly payrolls model points to a gain of about 152,000 jobs in September. However, after adjusting for hiring delays and some employees not working at any point over the survey week pay period, we have penciled in a 55,000 rise. Of course, payrolls are notoriously difficult to predict in even a typical month, so our forecast comes with a wider confidence interval than usual.