Sample Category Title
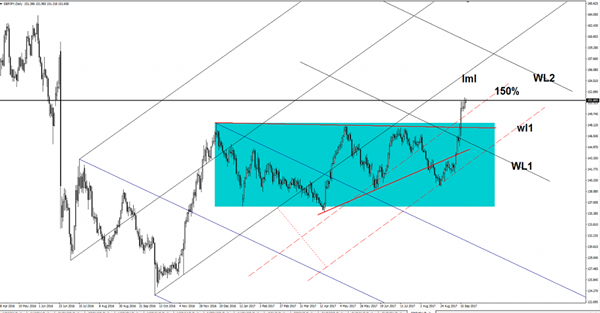
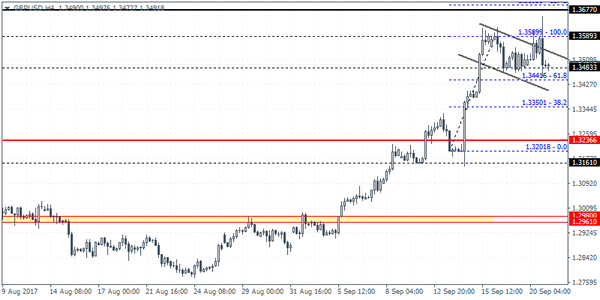
Trade Idea : GBP/USD – Sell at 1.3595
GBP/USD - 1.3509
Most recent candlesticks pattern : N/A
Trend : Up
Tenkan-Sen level : 1.3494
Kijun-Sen level : 1.3555
Ichimoku cloud top : 1.3542
Ichimoku cloud bottom : 1.3512
New strategy :
Sell at 1.3595, Target: 1.3480, Stop: 1.3630
Position : -
Target : -
Stop : -
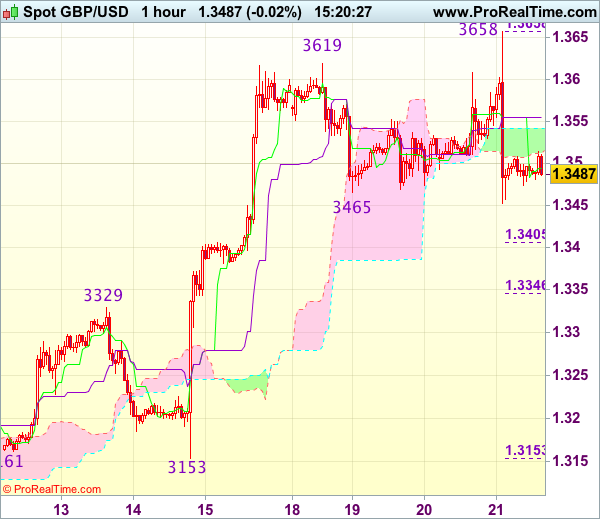
Although the British pound resumed recent rise and rose to as high as 1.3658, lack of follow through buying and the subsequent sharp retreat suggest top is possibly formed there and consolidation with mild downside bias is seen, below 1.3450 would bring further fall towards 1.3400-05 (50% Fibonacci retracement of 1.3153-1.3658), however, near term oversold condition should prevent sharp fall below 1.3345-50 (61.8% Fibonacci retracement) and previous resistance at 1.3329 should remain intact.
In view of this, we are looking to sell cable on recovery as 1.3590-00 should limit upside. Above 1.3620 would risk retest of said yesterday’s high at 1.3658 but only break there would revive bullishness and extend recent upmove to 1.3690-00 later.
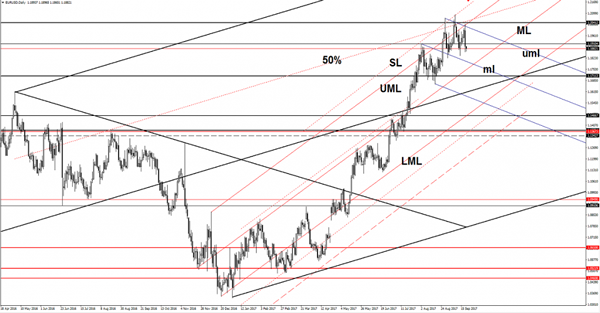
Trade Idea : EUR/USD – Sell at 1.1950
EUR/USD - 1.1894
Most recent candlesticks pattern : N/A
Trend : Sideways
Tenkan-Sen level : 1.1883
Kijun-Sen level : 1.1948
Ichimoku cloud top : 1.1995
Ichimoku cloud bottom : 1.1968
Original strategy :
Bought at 1.1970, stopped at 1.1950
Position : - Long at 1.1970
Target : -
Stop : - 1.1950
New strategy :
Sell at 1.1950, Target: 1.1850, Stop: 1.1985
Position : -
Target : -
Stop : -
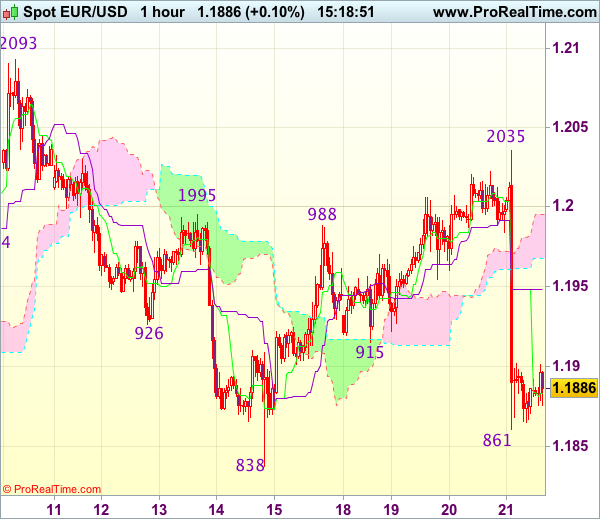
Although the single currency rose to as high as 1.2035 in late NY, euro ran into strong selling pressure there and has dropped sharply after Fed, suggesting early rebound from 1.1838 has ended there and downside bias is seen for retest of said support, break there would signal another leg of corrective decline from 1.2093 top is underway and extend weakness to 1.1800-05 but near term oversold condition would limit downside to 1.1770 and reckon 1.1750 would hold.
In view of this, we are looking to sell euro on recovery as the Kijun-Sen (now at 1.1948) should limit upside and bring another decline later. Above the lower Kumo (now at 1.1968) would defer and risk a stronger rebound to the upper Kumo (now at 1.1995) but said resistance at 1.2035 should remain intact.
AUD/USD Drops Like A Rock
AUD/USD drop fast and could hit new lows in the upcoming hours. It could drop below the 0.7939 previous low and could hit the lower median line (LML) of the major ascending pitchfork. Technically is expected to drop after another spike. Is traded outside the minor ascending pitchfork’s body, a valid breakdown below the LML will open the door for a major drop.
GBP/JPY BOJ Policy Rate Unchanged
GBP/JPY continues to stay higher as the Yen is weakened by the Nikkei’s impressive rally. The index has managed to climb much above the 20320 previous high, but now seems a little exhausted and could slip lower. I’ve said in a previous report that the JP225 is somehow expected to decrease a little after the amazing upside momentum, it could come even to retest the 20058 former resistance before will climb much higher. BOJ kept the interest rate steady at the -0.10%, remains to see how the Yen will react after the BOJ Press Conference.
GBP/JPY reached the 151.66 horizontal obstacle, only a valid breakout will confirm a further increase towards the lower median line (LML) of the ascending pitchfork.
EUR/USD More Downside In View
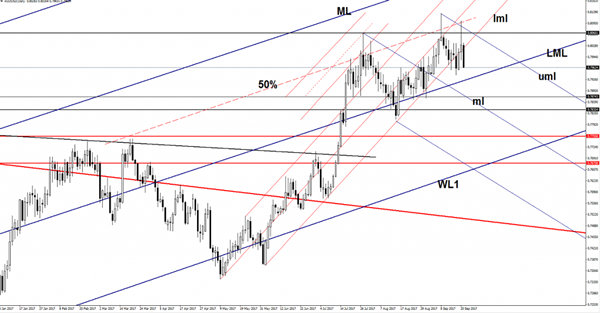
Price dropped significantly after the FOMC and looks poised to start a corrective phase on the short term. EUR/USD is narrowing on the short term, but it could breakout from this range and could make a significant move. Technically, it could drop much deeper on the short term after the retest of some important resistance levels.
The dollar has taken the lead again as the USDX has climbed much higher since yesterday's US session, the index is trading in the green, but is facing a tough resistance.
USDX is pressuring the 92.49 major horizontal resistance, a valid breakout will validate a further increase and a USD's dominance. The USD still needs more support from the United States economy, some positive data in the afternoon could give it the needed bullish spark. The Unemployment Claims are expected to jump from 284K to 302K jobs in the previous week, a better report will boost the greenback.
Price is moving sideways, but it could drop much deeper after the retest of the UML and the upper median line (uml) of the minor descending pitchfork. Actually, it could drop after the failure to reach the confluence area formed at the intersection between the UML with the upper median line (uml). EUR/USD failed to close near the mentioned resistance levels, signaling that is expected to drop significantly. The pair could be attracted by the confluence area formed at the intersection between the median line (ml) with the ML of the ascending pitchfork.
The Fed Draws A Clearer Picture Of Rate Hike By The End Of The Year
Dollar Rebounds After Fed Statement. As anticipated, the Fed announced it would begin from next month to reduce its approximately $4.2 trillion in holdings of U.S. Treasury bonds and mortgage-backed securities acquired in the years after the 2008 financial crisis. The dollar index was up 0.1 percent at 92.623 and near a two-week high of 92.697 set overnight, when it added 0.8 percent.
Dollar Extended Its Gains Against Euro. The euro is recovering from the losses suffered on Wednesday, when the common currency’s slide against the dollar nudged it away from a 21-month high of 134.160 set on Tuesday.
Kiwi Bounces as US Gains. The New Zealand dollar was down 0.3 percent at $0.7334, its rally the previous day petering out against a broadly stronger dollar. The kiwi soared to a 1-1/2-month high of $0.7435 on Wednesday after a poll showed New Zealand’s ruling National Party pulled ahead of the rival Labor Party ahead of a general election this weekend.
Dollar Hits 2-Month High Vs Yen On Heightened Fed Hike Expectations. The dollar rose to a two-month high against the yen on Thursday after a hawkish-sounding Federal Reserve heightened expectations for an interest rate hike in December.
Gold hits 3-week low. Gold dropped to its lowest level in over three weeks at $1295.65 on Thursday as a stronger US dollar and the increasing likelihood of another Federal Reserve interest rate hike this year curbed demand.
Oil Prices Dip Due to Hike in US Crude Production. Oil prices dipped during Thursday’s trade due to hike in US crude inventories and production as well as stronger dollar. US oil production has largely recovered from the shutdowns following Hurricane Harvey, currently standing at 9.51 million barrels per day (bpd), up from 8.78 million bpd directly after the storm hit the US Gulf Coast.
Watch Out Today for:
03:00 am GMT: JPY BoJ Interest Rate Decision
06:10 am GMT: AUD RBA’s Governor Philip Lowe Speech
07:30 am GMT: JPY Bank of Japan Governor Kuroda Speech
14:30 pm GMT: EUR ECB President Draghi’s Speech
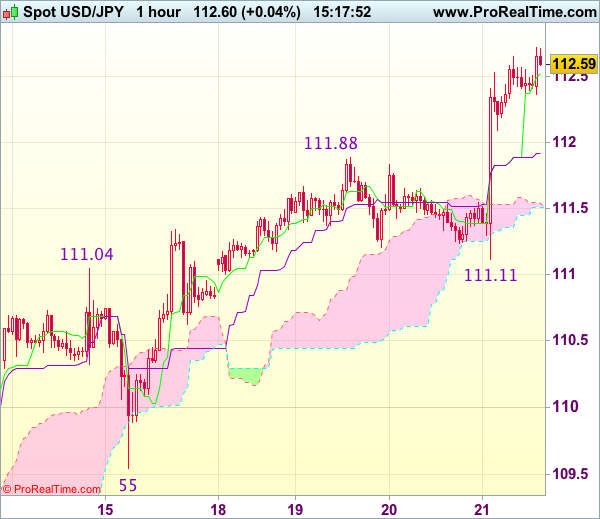
Trade Idea : USD/JPY – Buy at 111.90
USD/JPY - 112.60
Most recent candlesticks pattern : N/A
Trend : Up
Tenkan-Sen level : 111.53
Kijun-Sen level : 111.92
Ichimoku cloud top : 111.54
Ichimoku cloud bottom : 111.51
Original strategy :
Buy at 110.70, Target: 111.70, Stop: 110.35
Position : -
Target : -
Stop : -
New strategy :
Buy at 111.90, Target: 112.90, Stop: 111.55
Position : -
Target : -
Stop : -
The greenback has rallied after finding renewed buying interest at 111.11 yesterday (after Fed), adding credence to our bullish view that recent upmove is still in progress and may extend further gain to 112.90-00, however, loss of near term upward momentum should prevent sharp move beyond 113.25-30 (1.236 times projection of 107.32-111.04 measuring from 109.55) and previous chart resistance at 113.58 would hold from here, bring retreat later.
In view of this, would not chase this move here and would be prudent to buy dollar on subsequent pullback as previous resistance at 111.88 should turn into support and contain downside, bring another upmove. Below the Ichimoku cloud (now at 111.51-54) would defer and suggest a temporary top is possibly formed, risk weakness towards support at 111.11.
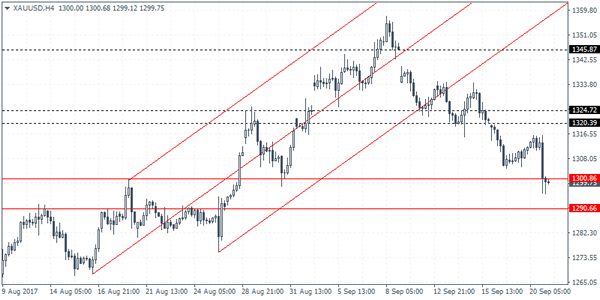
XAUUSD Intraday Analysis
XAUUSD (1299.75): Gold prices extended the declines following a slight bounce. Failure to retest the resistance level at 1324 - 1320 saw gold prices posting sharp declines to slide to 1300 support level. This potentially marks the downside target in gold. There is scope for prices to now post a reversal off this support which could see a retest back to the initial resistance level followed by further gains on an upside breakout. To the downside, below 1300, gold prices could be seen testing the 1290 handle where the next support comes in.
GBPUSD Intraday Analysis
GBPUSD (1.3491):The British pound closed with a doji yesterday as price continued to consolidate above the 1.3500 handle. The bullish flag pattern remains in play as GBPUSD is seen currently testing the support level at 1.3483. As long as this support holds, the bias is to the upside although resistance at 1.3590 will need to be breachedin order to set the stage for further gains. In the near term, GBPUSD could be seen consolidating within the resistance and support levels. A breakout from could either validate or invalidate the bullish flag pattern.
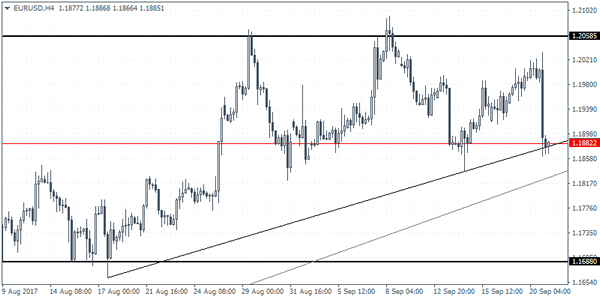
EURUSD Intraday Analysis
EURUSD (1.1885): The EURUSD fell sharply yesterday to close at a 4-day low. Price action is expected to continue the momentum, but the declines could be stalled near 1.1820. On the 4-hour chart, the head and shoulders pattern failed with price reversing strongly. EURUSD is seen currently supported at 1.1882 along with the rising trend line. This could offer some near-term support, but unless the bullish momentum sends the common currency to post fresh highs, we can expect this sideways pattern to continue.