Sample Category Title
Week Ahead – BoE MPC Vote Eyed Amid Slowing UK Growth; US CPI and Retail Sales in Focus Before...
Industrial output and retail sales data will dominate the economic calendar week, and inflation and employment will also be in focus. However, the week looks set to be a less dramatic one from the past seven days with policy meetings by the Bank of England and the Swiss National Bank unlikely to bring much surprises.
Australian employment report to be watched as aussie rallies
The Australian dollar is on track to end the week 1.5% higher against its US counterpart despite a neutral RBA policy meeting and a mixed batch of data. Next week's jobs numbers will be important in assessing whether the Australian economy is gaining sufficient momentum to warrant the RBA's view that growth will reach 3% in the coming months, having expanded at an annual rate of 1.8% in the second quarter. The August employment figures are out on Thursday and before that, the NAB business confidence and Westpac consumer sentiment gauges will be looked at on Tuesday and Wednesday respectively.
Steady as she goes in China
China posted a sixth straight month of year-on-year growth in exports in August, cementing expectations that the economy will avoid a sharp slowdown in growth in the second half of the year as the government cracks down on risky lending. The better-than-expected performance in 2017 has not only eased downside pressure on the yuan but has also enabled the People's Bank of China to lift the currency's mid-point versus the US dollar to its highest in 16 months this week. Data due next week on industrial output, fixed asset investment and retail sales are not expected to upset this picture. Industrial production (+6.6% y/y) and retail sales (+10.5% y/y) are forecast to improve slightly in August from the prior month, while fixed asset investment (+8.2% y/y) is expected to slow marginally.
Japanese machinery orders to bounce back
A bigger-than-anticipated downward revision to Japan's GDP growth rate for the second quarter this week did not cause much alarm for investors as all the indications are that the world's third largest economy is on course to expand for the seventh consecutive quarter in the third quarter, making it Japan's longest streak of expansion this century. This should be evident next Monday, with machinery orders forecast to rebound by 4.4% month-on-month in July. Also to watch next week are corporate goods prices for August on Tuesday and the final industrial output figures for July on Thursday.
SNB likely to remain dovish
Data out of the Eurozone will be scarce next week with industrial output numbers for July being the only major release (due on Wednesday). The euro rallied to a fresh 2½-year high against the dollar after the ECB's policy meeting this week. Against the Swiss franc, a high of similar period was reached in early August, bringing much relief to the Swiss National Bank, which has long argued that the Swissie is "significantly overvalued".
However, the franc has gained 7% against the dollar in the year-to-date and the recent bout of geopolitical risks has brought safe havens back in favour. The SNB is therefore not expected to be satisfied with the Swissie's broader value and is forecast to keep its three-month LIBOR target rate unchanged at -0.75%. Recent data out of Switzerland has been on the weak side, with second quarter GDP sharply missing estimates to grow by just 0.3% over the quarter and annual inflation running at a paltry 0.5%. This points to the SNB maintaining its dovish tone and exchange rate warning when it meets for its latest policy decision on Thursday.
Bank of England under spotlight as rate hike odds diminish
The Bank of England will have gotten its hands on the latest UK inflation and jobs data before concluding its two-day monetary policy meeting on Thursday. Inflation numbers are out on Tuesday and annual CPI is expected to tick higher again, rising to 2.8% in August. The core rate is also forecast to edge upwards, to 2.5%. Unemployment data due on Wednesday will likely show the jobless rate holding steady at 4.4% in the three months to July. Average weekly earnings growth is forecast to accelerate slightly to 2.3% y/y during the same period, though this remains below the level of headline inflation, meaning real incomes continue to decline.
Attention will shift onto the Bank of England on Thursday, with the Monetary Policy Committee retuning to its full nine-member board as the new Deputy Governor, Sir Dave Ramsden, attends his first meeting. The Bank shocked markets in June when three MPC members voted for a rate hike. That figure fell to two in August and it will be interesting to see which way the newest member will vote. Following the replacement of Kristin Forbes by the more dovish Silvana Tenreyro, if Ramsden also joins the doves, it will be difficult to foresee a rate hike before 2019, as per economists' latest projections. This could be negative for the pound's medium-term outlook, though progress in the Brexit negotiations will also strongly influence sterling's path over the next year, with the related uncertainty already dampening UK growth this year.
US inflation and retail sales eyed
As traders price out another Fed rate hike this year, economic data may nevertheless provide some support to the hammered dollar, which has fallen to 2½-year lows this week. The US calendar will start with the July JOLTS job openings on Tuesday and August producer prices will follow on Wednesday. Inflation data will be scrutinized on Thursday as subdued prices pressures continue to puzzle Fed policymakers. The annual CPI rate is forecast to rise from 1.7% to 1.8% in August, but the core rate is expected to ease to 1.6%. Retail sales figures are due on Friday and are expected to show a month-on-month gain of 0.4% in August, down from 0.6% in July. The August CPI and retail sales numbers will be the last before the September FOMC meeting on September 19-20. Also out on Friday are industrial output data and the University of Michigan's preliminary reading of consumer sentiment for September.
Weekly Focus: Focus on Inflation Prints
Market Movers ahead
- In the US, we expect inflation pressure remained muted in August.
- In the euro area, wage cost growth in Q2 will probably have been constrained by still broad labour market slack.
- We expect the Bank of England to keep the Bank Rate unchanged at 0.25% with a vote count of 7-2 (vs 6-2 in August; one extra member this month).
- In China, we pay more attention to the details of the industrial production release for August, as electricity generation and steel output should reflect the rebound over the summer in the Chinese economy.
- The August inflation prints in Denmark and Norway will likely show a lower inflation rate than the previous month while going up a bit in Sweden.
- In Norway, Norges Bank's preferred measure of economic activity, the regional network survey, is likely to rise on the back of solid momentum in the Norwegian economy.
Global macro and market themes
- Combination of strong global PMIs and postponement of US debt limit risk are good for equities.
- Trump's debt limit deal means that return of USD scarcity is postponed, likely till 2018.
- Any dips in EUR/USD should be shallow and short-lived. EUR yields to range trade before rising next year, as markets price in an ECB tapering premium.
- Fed to begin quantitative tightening at upcoming meeting but direction next year uncertain due to vacant seats.
WTI Oil Price Eased Below $49.00
WTI oil price eased below $49.00 on Friday after repeated upside rejections at $49.40/31 in previous two days and Thursday's action being shaped in Doji, signaling indecision.
In addition, strong build in crude inventories last week added to pressure on oil price which was inflated by increased demand for oil on restart of Texas refineries which were shut on Hurricane Harvey.
Current easing could be seen as correction of larger bull-leg from $45.57 on overbought studies and ahead of attack at strong barriers at $49.62 (200SMA) and psychological $50.00 barrier.
Dips should be ideally contained by supports at $48.00 zone, provided by daily cloud top and Fibo 38.2% of $45.57/$49.40 upleg).
Focus is shifting to three other hurricanes that are approaching the US Gulf coast and may disrupt refining process again and reduce demand for oil again that would further boost oil prices.
Another supportive factor for oil price would be decision of Saudi Arabia to cut supplies in October by 350.000 barrels per day.
Res: 49.24; 49.40; 49.62; 50.00
Sup: 48.72; 48.50; 48.00; 47.65
Sterling Breaks 1.32 ahead of BOE Meeting; Yen Extends Gains as North Korean Risks Linger
The dollar continued to trade weak during the European session with most of its peers hovering near fresh highs they reached in the Asian session. The pound and the yen extended their earlier gains, with the former hitting above the 1.32 key level against the greenback, while the latter reached the price of 107 per dollar for the first time since November 2016.
With Hurricane Irma heading towards Florida, after it devastated the Caribbean islands and while other two hurricanes have been observed moving in the Atlantic, the Federal Emergency Management Agency (FEMA) is worried whether its budget would be enough to cover additional damage, increasing the likelihood that the Congress might provide more funding during the next days.
In the meantime, markets are cautious to see whether North Korea will launch another intercontinental missile test on Saturday when it will celebrate its founding day, raising the risks of a dangerous military conflict between the US and the isolated regime. Late on Thursday, Trump argued that a military response is an "option" if North Korea continues developing its nuclear weapons.
The dollar index sank to a fresh 32-month low of 90.65 during the session, despite a fiscal policy relief on Wednesday when Trump and congressional Democrats agreed unexpectedly to raise the government's debt ceiling but only for the next three months.
Dollar/yen bottomed at a ten-month low of 107.31 before it climbed to 107.82 as risk-off sentiment was rising among investors.
The euro paused its uptrend versus the greenback, trading at $1.2026 after it managed to break above 1.21 in Asian trading. This came after the ECB decision on Thursday to hold interest rates unchanged and provide further hints on tapering its quantitate easing program most likely in October. However, unknown sources who have knowledge on the topic said that ECB plans to cut monthly asset purchases from 60bn euros currently to 20-40bn euros from the start of 2018 for a period of six to nine months.
The pound was in focus today as it surged by 1% on the day to a more than a 1-month high of $1.3213 on the back of a weaker dollar. Upbeat manufacturing data released out of the UK on Friday provided some support to the currency as well. On a monthly basis, manufacturing production in July rose by 0.5 percentage points to 0.5%, recording the highest growth since February, while analysts had projected an increase of only 0.3%.
This comes a week before BOE policymakers gather on Thursday to decide on monetary policy. However, markets anticipate the MPC members to follow their European counterparts and keep rates steady as recent economic evidence showed that the fifth biggest economy in the world continued growing slowly relative to its European peers after it posted the lowest growth since 2012 in the first quarter. The British Chambers of Commerce said on Friday that the British economy was "treading water" ahead of the divorce day in March 2019, while it also added that since the Brexit vote the pound's weakness did little for the exporters. The UK trade data published in the middle of the session justified this argument as the trade deficit widened by 0.05bn pounds to 11.58bn pounds, while forecasts were for the trade deficit to increase by an even bigger 0.42bn pounds.
Elsewhere, August jobs data out of Canada released today, showed the country's economy adding 22,200 positions during the month. This was better than the 19,000 which was expected by analysts and above July's 10,900. The unemployment rate ticked down to 6.2% from the 6.3% that was recorded in the previous month, which also coincided with economists' expectations. August's unemployment rate is the lowest the nation has experienced since October of 2008. The participation rate remained constant at 65.7%. On the downside, the positions added were attributed to part-timers, as full-time positions fell during the month. Another report released at the same time, showed industrial capacity utilization rising to 85.0% in the second quarter from 83.3% in first. The Canadian dollar weakened as the data went public with dollar/loonie advancing. The pair last traded 0.3% up on the day, while earlier in the day it fell to a fresh near 28-month low of 1.2060.
In commodities, oil prices were mixed. WTI crude was down by 0.65% at $48.77 per barrel while Brent was up by 0.15% at $54.63 per barrel.
Gold declined by 0.10% at $1,347.50 per ounce.
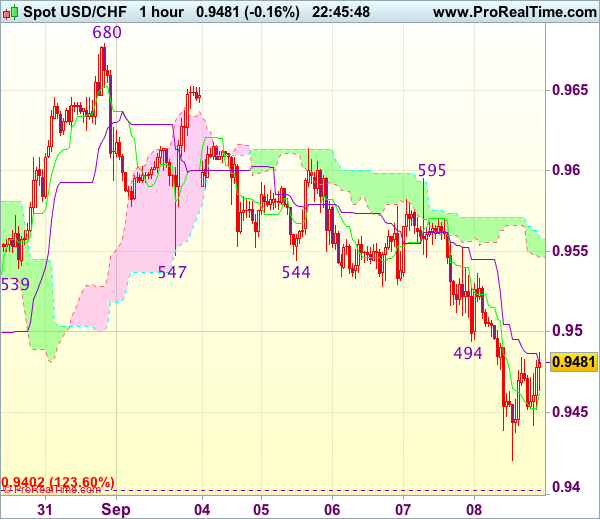
Trade Idea Wrap-up: USD/CHF – Hold long entered at 0.9450
USD/CHF - 0.9472
Most recent candlesticks pattern : N/A
Trend : Down
Tenkan-Sen level : 0.9466
Kijun-Sen level : 0.9479
Ichimoku cloud top : 0.9558
Ichimoku cloud bottom : 0.9546
Original strategy :
Bought at 0.9450, Target: 0.9550, Stop: 0.9415
Position : - Long at 0.9450
Target : - 0.9550
Stop : - 0.9415
New strategy :
Hold long entered at 0.9450, Target: 0.9550, Stop: 0.9420
Position : - Long at 0.9450
Target : - 0.9550
Stop : - 0.9420
As the greenback has dropped again and has remained under pressure, marginal weakness from here cannot be ruled out, however, loss of near term downward momentum should prevent sharp fall below 0.9415-20 and prospect of a rebound remains, ab one the Kijun-Sen (now at 0.9496) would bring subsequent gain to 0.9550 but dollar needs to penetrate resistance at 0.9595 to signal low is formed.
In view of this, we are holding on to our long position entered at 0.9450. Below 0.9415-20 would risk weakness to 0.9390-00, having said that, further sharp fall below 0.9370-75 should not be repeated and reckon 0.9350 would hold from here, bring rebound later.
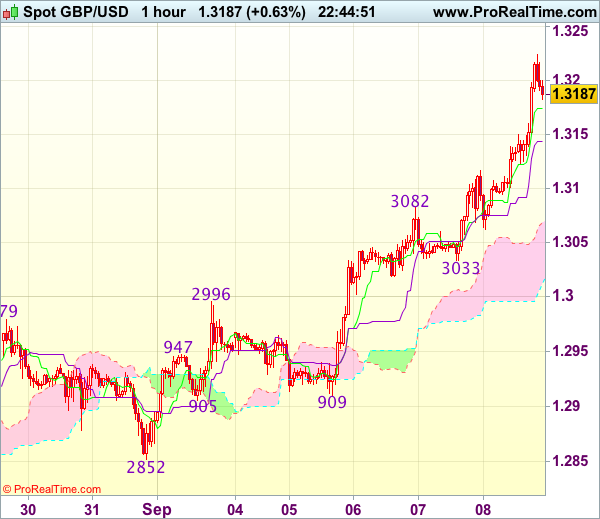
Trade Idea Wrap-up: GBP/USD – Buy at 1.3125
GBP/USD - 1.3189
Most recent candlesticks pattern : N/A
Trend : Near term up
Tenkan-Sen level : 1.3175
Kijun-Sen level : 1.3143
Ichimoku cloud top : 1.3071
Ichimoku cloud bottom : 1.3018
Original strategy :
Buy at 1.3125, Target: 1.3225, Stop: 1.3090
Position : -
Target : -
Stop : -
New strategy :
Buy at 1.3125, Target: 1.3225, Stop: 1.3090
Position : -
Target : -
Stop : -
As cable has surged again after brief pullback, adding credence to our bullish view that recent upmove from 1.2774 is still in progress and upside bias remains for further gain to 1.3225-30, then towards 1.3250, however, loss of near term upward momentum should prevent sharp move beyond latter level and price should falter below recent high at 1.3269, bring retreat later.
In view of this, would not chase this rise at current level and would be prudent to buy cable on subsequent pullback as 1.3120-25 should limit downside. Only below 1.3082 (previous resistance turned support) would abort ad suggest top is possibly formed, risk test of 1.3062 but reckon support at 1.3033 (yesterday’s low) would hold.
Elliott Wave Analysis: GBPJPY and Crude Oil
Good day traders! Today's focus will be on GBPJPY and Crude oil.
GBPJPY is making a new intra-day rise, which can be an indication that maybe blue wave two correction is completed and now sub-wave i) of three is in play. If that is the case, then more gains may follow on the pair.
GBPJPY, 1H
Crude oil is still trading sideways, now ideally in sub-wave d) of a triangle correction. Hopefully wave e) will unfold in the near-term as well and the whole correction will find support near the former wave four at the 48.50 level and make a new reaction higher.
Crude oil, 1H
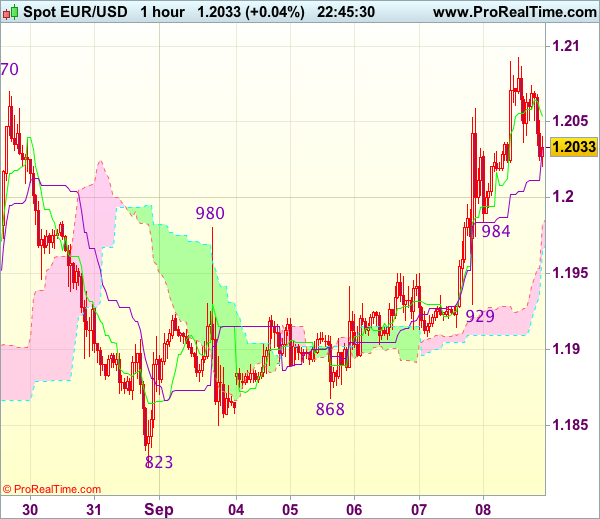
Trade Idea Wrap-up: EUR/USD – Buy at 1.1985
EUR/USD - 1.2023
Most recent candlesticks pattern : N/A
Trend : Up
Tenkan-Sen level : 1.2045
Kijun-Sen level : 1.2039
Ichimoku cloud top : 1.1985
Ichimoku cloud bottom : 1.1968
Original strategy :
Buy at 1.1985, Target: 1.2090, Stop: 1.1950
Position : -
Target : -
Stop : -
New strategy :
Buy at 1.1985, Target: 1.2090, Stop: 1.1950
Position : -
Target : -
Stop : -
As the single currency has retreated after rising to 1.2093 earlier today, suggesting consolidation below this level would be seen and pullback to 1.2000 is likely, however, reckon minor support at 1.1984 would limit downside and bring another rise later, above 1.2070-75 would bring retest of said resistance at 1.2093 but break there is needed to extend recent upmove to 1.2130-40, having said that, loss of upward momentum should limit upside to 1.2150-55 (61.8% projection of 1.1119-1.1910 measuring from 1.1662), bring correction later.
In view of this, would be prudent to buy euro on further pullback as support at 1.1980-84 should limit downside and bring another upmove later. Below 1.1950 (previous resistance turned support) would signal a temporary top is formed instead bring weakness to 1.1925-30 first.
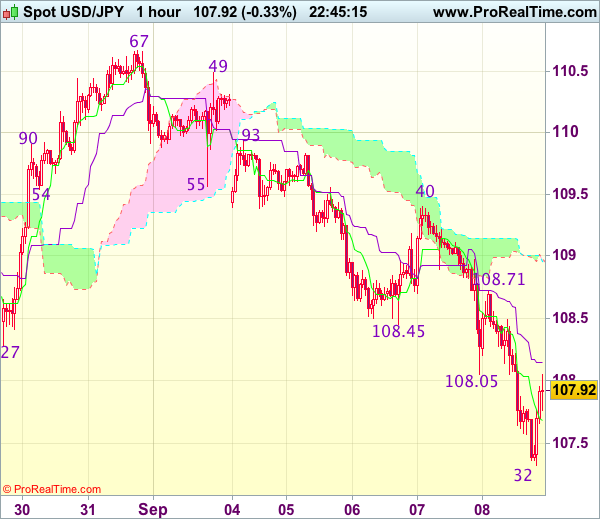
Trade Idea Wrap-up: USD/JPY – Sell at 108.65
USD/JPY - 107.96
Most recent candlesticks pattern : N/A
Trend : Down
Tenkan-Sen level : 107.69
Kijun-Sen level : 108.15
Ichimoku cloud top : 108.98
Ichimoku cloud bottom : 108.96
Original strategy :
Sell at 108.45, Target: 107.45, Stop: 108.90
Position : -
Target : -
Stop : -
New strategy :
Sell at 108.65, Target: 107.65, Stop: 109.00
Position : -
Target : -
Stop : -
As the greenback has recovered after falling to 107.32, suggesting consolidation above this level would be seen and test of the Kijun-Sen (now at 108.15) is like, however, reckon upside would be limited to 108.50 and resistance at 108.71 should hold, bring another decline later, below said support at 107.32 would extend recent decline to 107.00-10, however, oversold condition should limit downside and reckon 106.80-82 (61.8% projection of 114.50-108.27 measuring from 110.67) would hold from here, bring rebound later.
In view of this, we are still looking to sell dollar on recovery as resistance at 108.71 should limit upside. Only above 108.95-00 would abort and suggest an intra-day low is formed, bring a stronger rebound towards indicated resistance at 109.40 but break there is needed to provide confirmation.
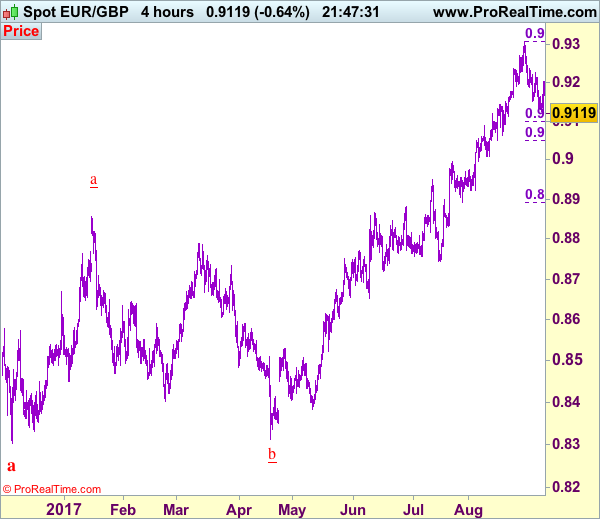
Trade Idea: EUR/GBP – Sell at 0.9200
EUR/GBP - 0.9120
Original strategy :
Sell at 0.9225, Target: 0.9100, Stop: 0.9265
Position : -
Target : -
Stop : -
New strategy :
Sell at 0.9200, Target: 0.9060, Stop: 0.9240
Position : -
Target : -
Stop : -
As the single currency has slipped again after brief bounce to 0.9203, suggesting the fall from 0.9307 is still in progress and mild downside bias remains for this move from temporary top of 0.9307 to bring retracement of recent upmove to 0.9095-00 (50% Fibonacci retracement of 0.8892-0.9307), then towards 0.9050 (61.8% Fibonacci retracement), however, near term oversold condition should prevent sharp fall below latter level and price should stay well above support at 0.9008.
In view of this, we are inclined to sell euro on recovery as resistance at 0.9203 should limit upside. Above 0.9235-40 would suggest low is formed instead, bring a stronger rebound to 0.9270 but only above said resistance at 0.9307 would revive bullishness and extend recent upmove to 0.9325-30 and possibly towards 0.9350, however, loss of upward momentum should limit upside and price should falter below 0.9390-00.
Our preferred count is that, after forming a major top at 0.9805 (wave V), (A)-(B)-(C) correction is unfolding with (A) leg ended at 0.8400 (A: 0.8637, B: 0.9491 and 5-waver C ended at 0.8400. Wave (B) has ended at 0.9413 and impulsive wave (C) has either ended at 0.8067 or may extend one more fall to 0.8000 before prospect of another rally. Current breach of indicated resistance at 0.9043 confirms our view that the (C) leg has ended and bring stronger rebound towards 0.9150/54, then towards 0.9240/50.