Sample Category Title
USD/JPY Weekly Outlook
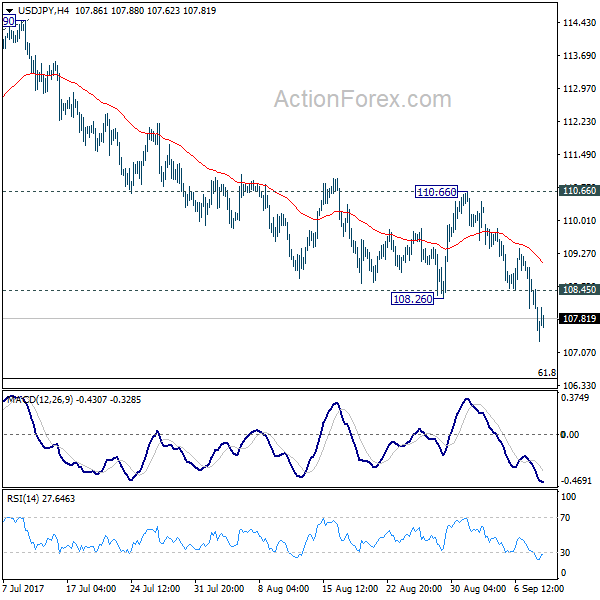
USD/JPY's medium decline from 118.65 finally resumed last week and reached as low as 107.31. Initial bias stays on the downside this week for 61.8% retracement of 98.97 to 118.65 at 106.48 first. We'd look for support from there to bring rebound. But firm break of 106.48 will extend the decline to 100% projection of 118.65 to 108.12 from 114.49 at 103.96 or below. On the upside, above 108.45 minor resistance will turn intraday bias neutral first. But outlook will now stay bearish as long as 110.66 resistance holds.
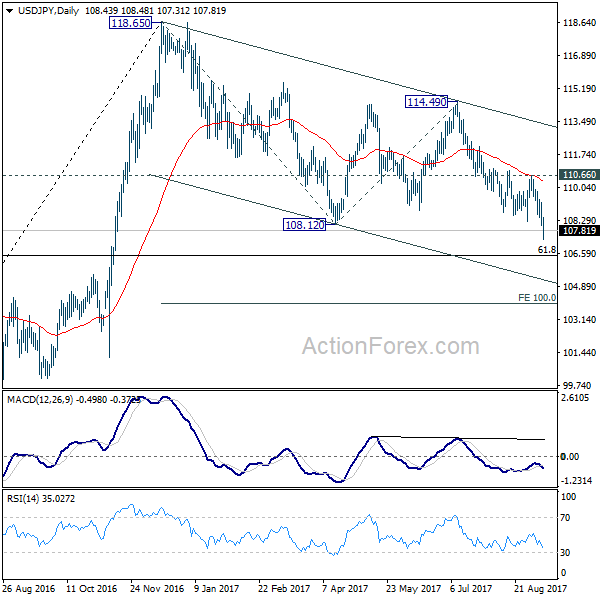
In the bigger picture, rise from 98.97 (2016 low) is now seen as the second leg of the corrective pattern from 125.85 (2015 high). It's unclear whether this this second leg has completed at 118.65 or not. But medium term outlook will be mildly bearish as long as 114.49 resistance holds. And, there is prospect of breaking 98.97 ahead. Meanwhile, break of 114.49 will bring retest of 125.85 high. But even in that case, we don't expect a break there on first attempt.
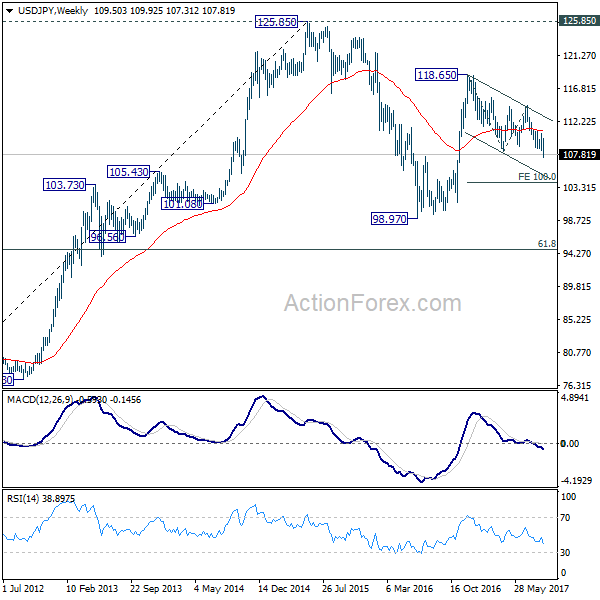
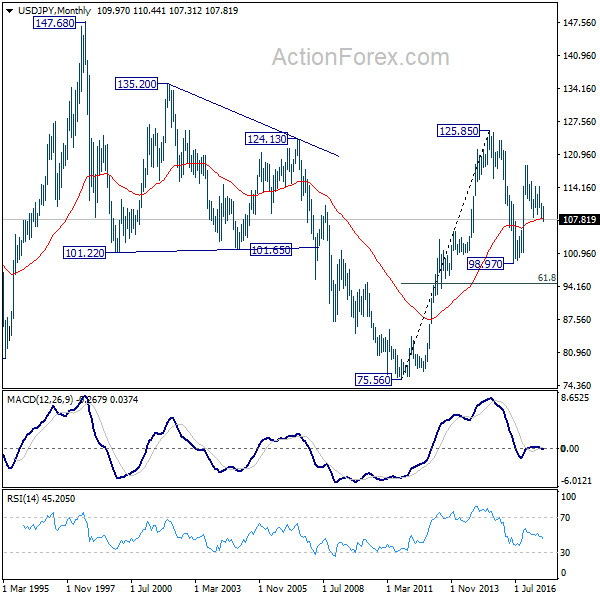
In the long term picture, the rise from 75.56 (2011 low) long term bottom to 125.85 top is viewed as an impulsive move, no change in this view. Price actions from 125.85 are seen as a corrective move which could still extend. In case of deeper fall, downside should be contained by 61.8% retracement of 75.56 to 125.85 at 94.77. Up trend from 75.56 is expected to resume at a later stage for above 135.20/147.68 resistance zone.
GBP/USD Weekly Outlook
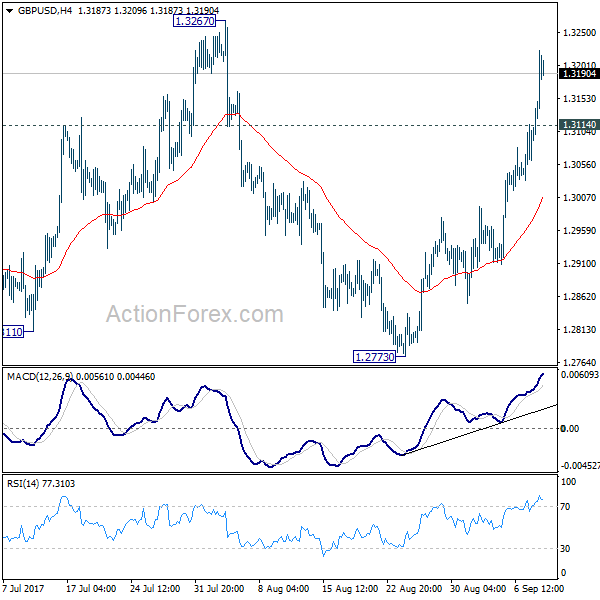
GBP/USD's strong rally last week now suggests that medium term rise from 1.1946 is still in progress. Initial bias stays on the upside this week for 1.3267 resistance first. Break will confirm this case and target 1.3444 key resistance next. But again, price actions from 1.1946 are still seen as a corrective pattern. Hence, we'd expect strong resistance from 1.3444 to limit upside to bring larger down trend reversal eventually. On the downside, below 1.3114 minor support will turn intraday bias neutral first.
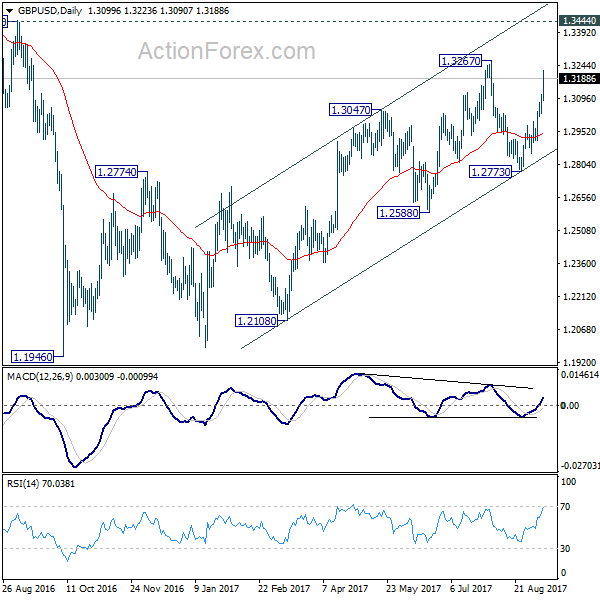
In the bigger picture, overall, price actions from 1.1946 medium term low are seen as a corrective pattern. While further rise cannot be ruled out, larger outlook remains bearish as long as 1.3444 key resistance holds. Down trend from 1.7190 (2014 high) is expected to resume later after the correction completes. And break of 1.2773 support will be the first sign that such down trend is resuming.
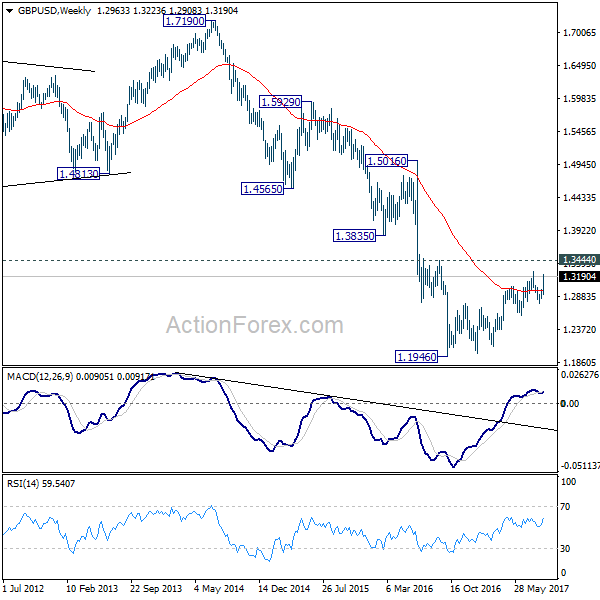
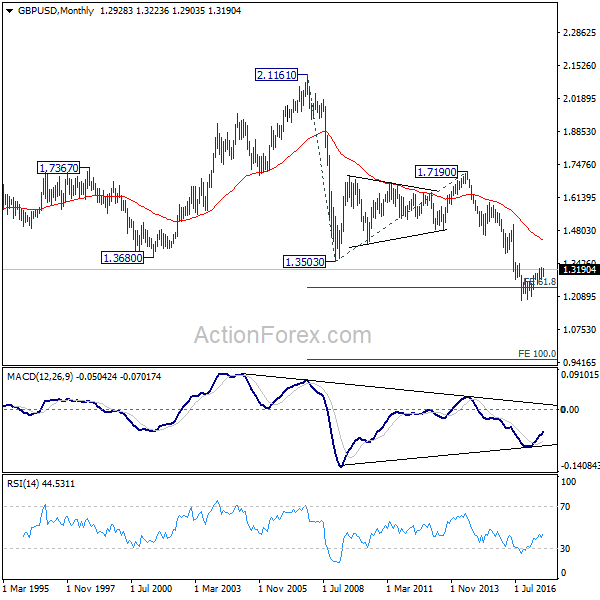
In the longer term picture, no change in the view that down trend from 2.1161 (2007 high) is still in progress. On resumption, such decline would extend deeper to 100% projection of 2.1161 to 1.3503 from 1.7190 at 0.9532. However, firm break of 1.3444 should confirm reversal and turn outlook bullish.
USD/CHF Weekly Outlook
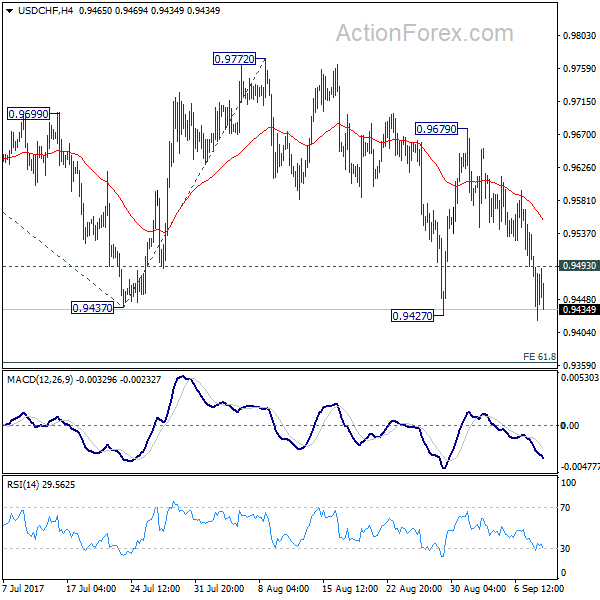
USD/CHF's sharp fall and breach of 0.9427 last week indicates that medium term fall from 1.0342 is resuming. Initial bias remains on the downside this week for 61.8% projection of 1.0099 to 0.9437 from 0.9772 at 0.9363 first. Break will target 100% projection at 0.9110 next. On the upside, above 0.9493 minor resistance will turn bias neutral first. But outlook will stay bearish as long as 0.9679 resistance holds.
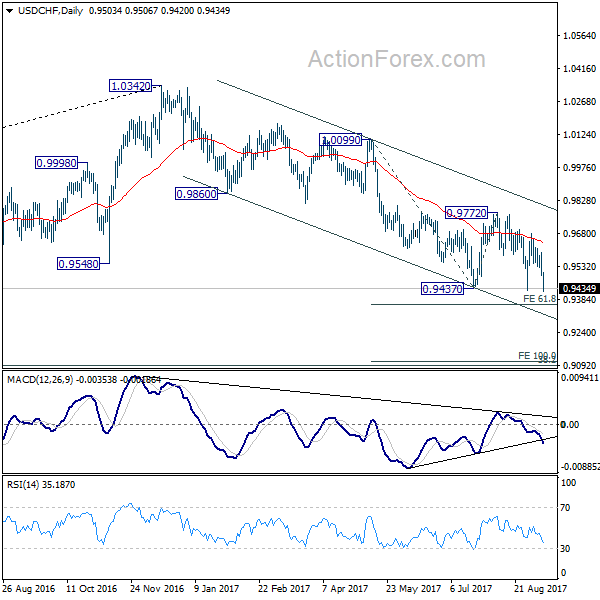
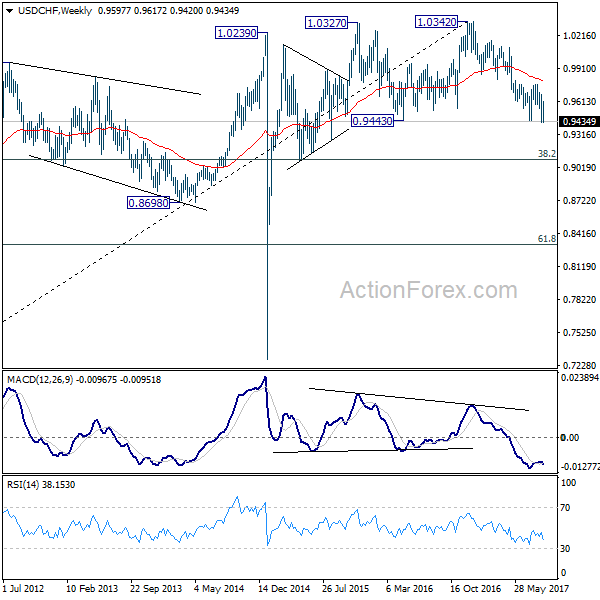
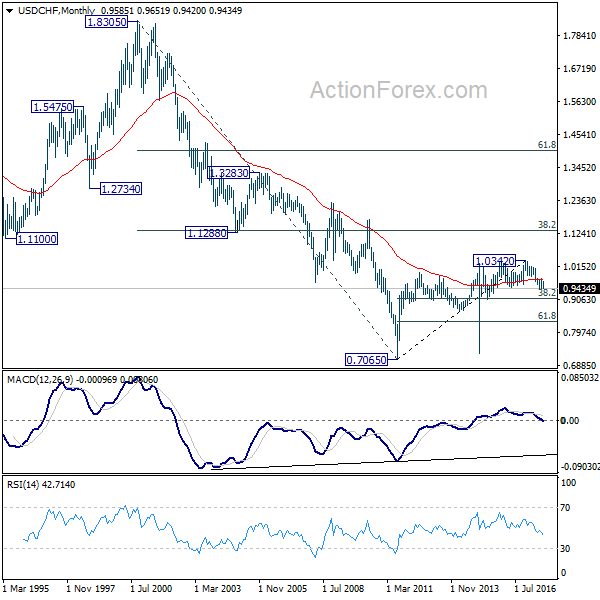
In the bigger picture, current development suggests that 0.9443 key support (2016 low) could be taken out firmly as down trend form 1.0342 extends. There are various interpretation of the price actions. But in any case, medium term outlook will stay bearish as long as 0.9772 resistance holds. Current down trend could extend to 38.2% retracement of 0.7065 (2011 low) to 1.0342 (2016 high) at 0.9090. However, break of 0.9772 will indicate that USD/CHF has successfully defended 0.9443 again and turn outlook bullish for 1.0099 resistance.
AUD/USD Weekly Outlook
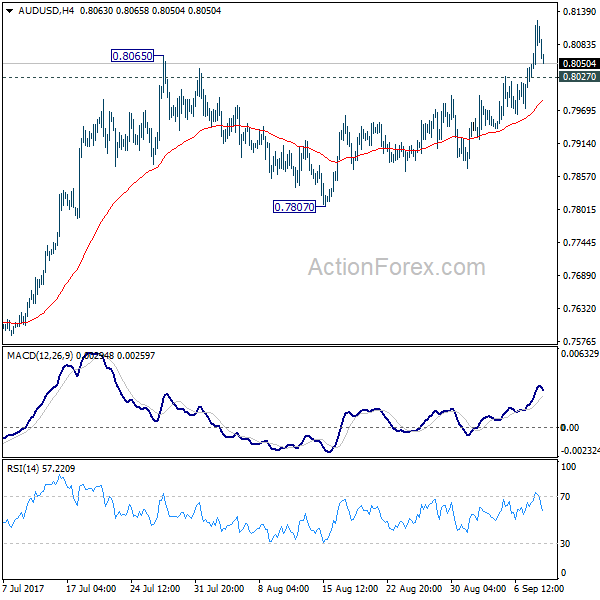
AUD/USD's break of 0.8065 last week confirms resumption of medium term rise from 0.6826. Initial bias stays on the upside this week for 100% projection of 0.6826 to 0.7833 from 0.7328 at 0.8335 next. On the downside, below 0.8027 minor support will turn intraday bias neutral first. But retreat should be contained well above 0.7807 support to bring rally resumption.
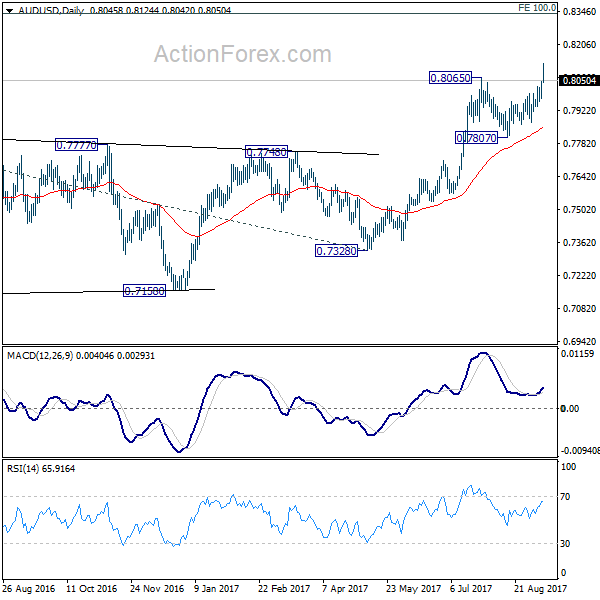
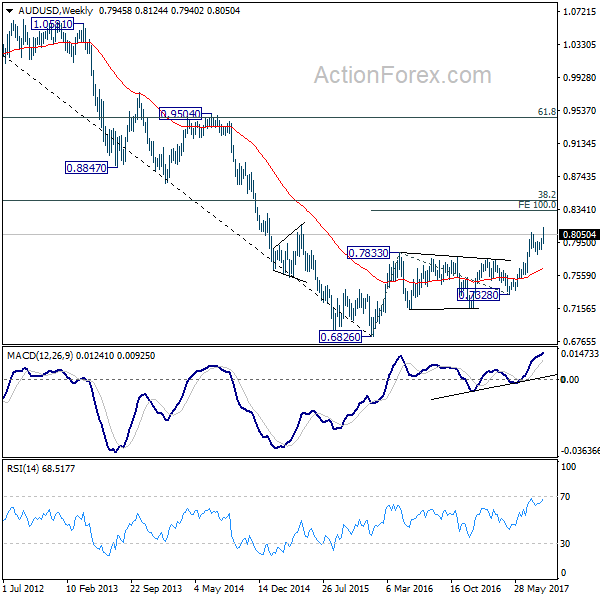
In the bigger picture, rise from 0.6826 medium term bottom is still in progress. At this point, there is no confirmation of trend reversal yet and we'll continue to treat such rebound as a corrective pattern. But in any case, break of 55 month EMA (now at 0.8090) will target 38.2% retracement of 1.1079 to 0.6826 at 0.8451. Break of 0.7807 support is needed to to be the first sign of completion of the rebound. Otherwise, further rise is now in favor.
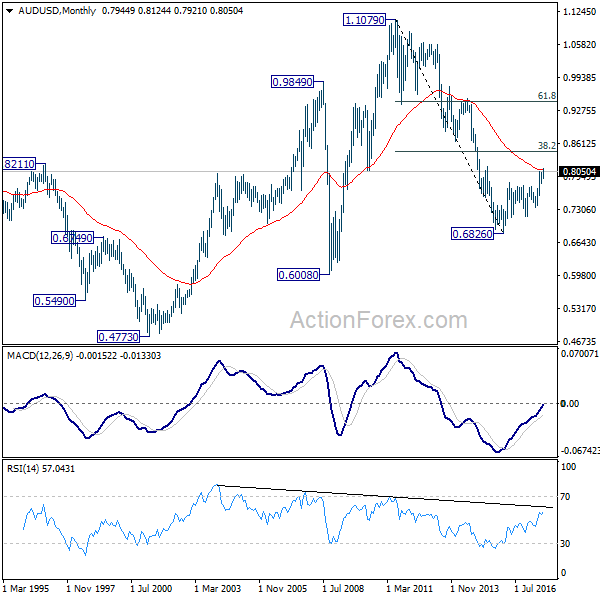
In the longer term picture, 0.6826 is seen as a long term bottom. Rise from there could either reverse the down trend from 1.1079, or just develop into a corrective pattern. At this point, we're favoring the latter. And, as long as 38.2% retracement of 1.1079 to 0.6826 at 0.8451 holds, we'd anticipate another decline through 0.6826 at a later stage.
USD/CAD Weekly Outlook
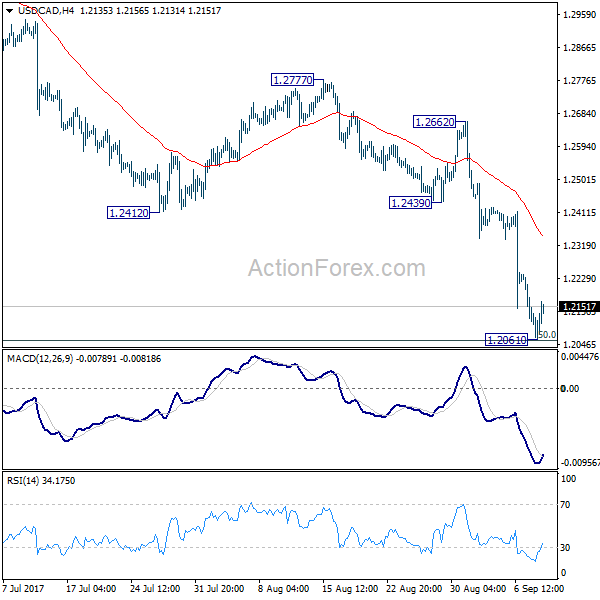
USD/CAD's down trend re-accelerated last week and dived to as low as 1.2061, just inch above long term fibonacci level at 1.2048. A temporary low is formed and initial bias is neutral this week for consolidation. At this point, we'd remain cautious on strong support from 1.2048 to bring sustainable rebound. But still, break of 1.2439 support turned resistance is needed to be the first sign of trend reversal. Otherwise, outlook will remain bearish. Firm break of 1.2048 will pave the way to next fibonacci level at 1.1424.
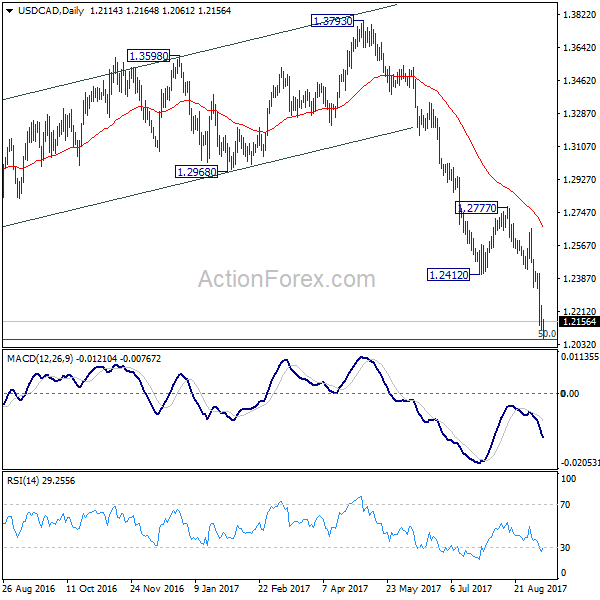
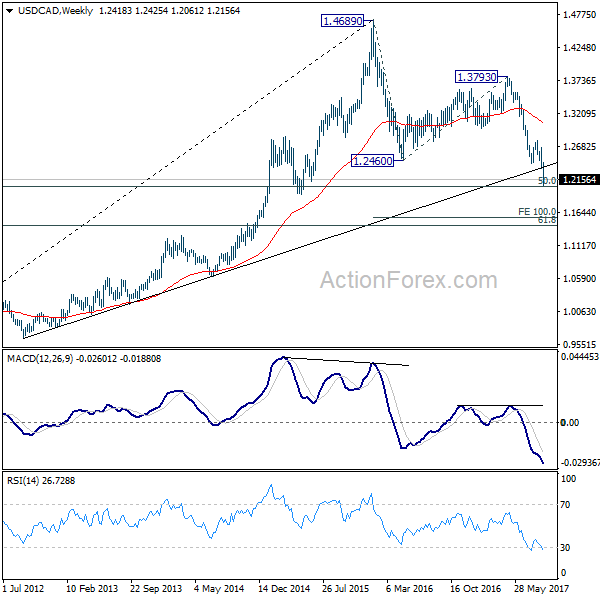
In the bigger picture, current downside acceleration is raising the chance that whole long term rise from 0.9406 (2011 low), and that from 0.9056 (2007 low) is completed at 1.4689. Focus is now on 50% retracement of 0.9406 to 1.4869 at 1.2048. As long as this level holds, we'd still favor that case that fall from 1.4689 is a correction. However, firm break of 1.2048 will indicate that fall fro 1.4689 is at least a medium term down trend and should target 61.8% retracement at 1.1424 and below.
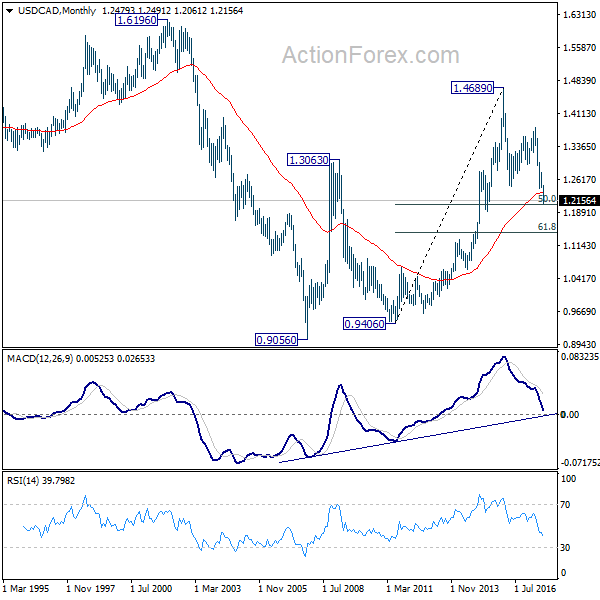
In the longer term picture, the long term outlook is turned a bit mixed with the current downside acceleration. As noted above, 50% retracement of 0.9406 to 1.4869 at 1.2048 is a key level to determine whether up trend from 0.9056 (2007) has already completed.
GBP/JPY Weekly Outlook
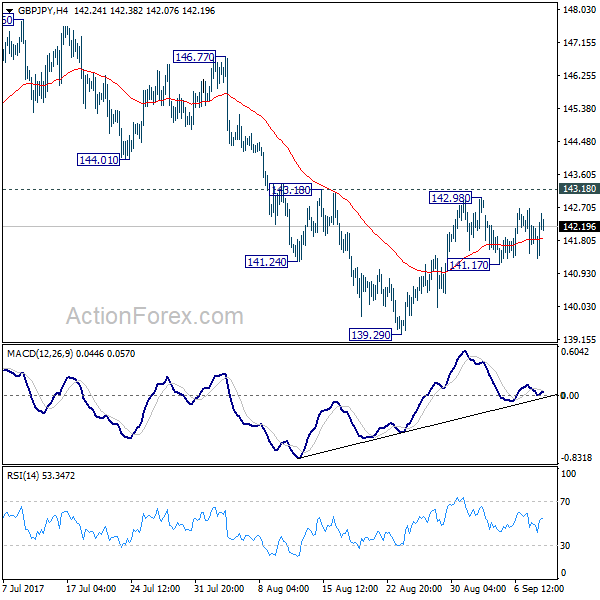
GBP/JPY's dipped to 141.17 last week but turned sideway since then. Initial bias is neutral this week first. With 143.18 resistance and 55 day EMA intact, deeper fall is mildly in favor. Below 141.17 will turn bias to the downside for 139.29 first. Break there will extend fall from 147.76 to 135.58 key support. At this point, price actions from 148.42 are seen as a sideway consolidation pattern. Hence, we'll expect strong support from 135.58 to contain downside and bring rebound. Meanwhile, break of 143.18 will indicate short term reversal and turn bias back to the upside.
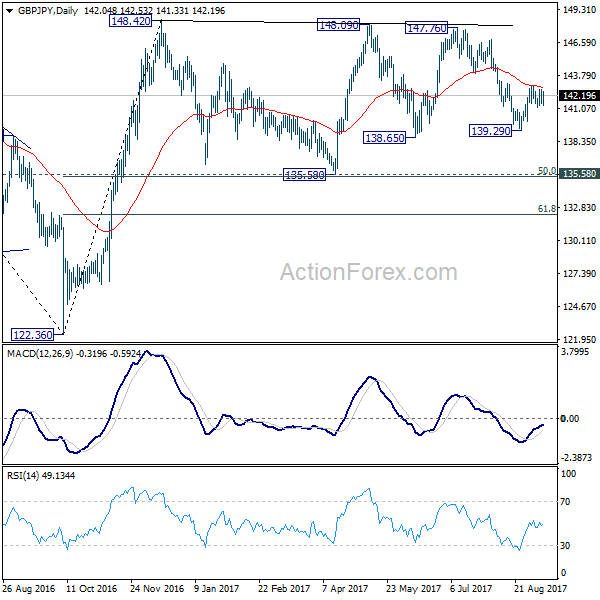
In the bigger picture, the sideway pattern from 148.42 is still unfolding. In case of deeper fall, we'd expect strong support from 135.58 and 50% retracement of 122.36 to 148.42 at 135.39 to contain downside. Medium term rise from 122.36 is expected to resume later. And break of 38.2% retracement of 196.85 to 122.36 at 150.43 will carry long term bullish implications. However, firm break of 135.58/39 will dampen the bullish view and turn focus back to 122.36 low.
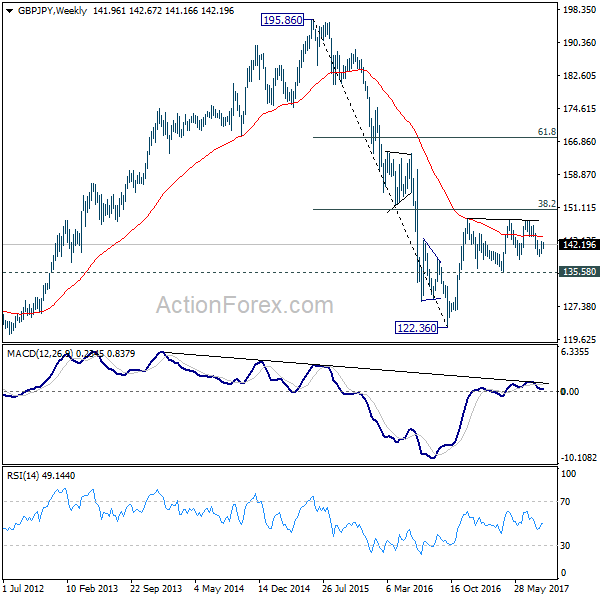
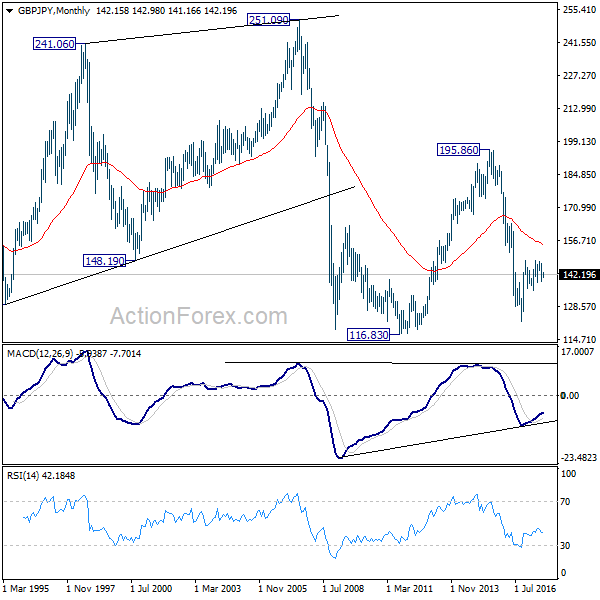
In the longer term picture, it remains to be confirmed if whole down trend from 195.86 has completed at 122.36 already and there is no confirmation yet. But in any case, firm break of 38.2% retracement of 195.86 to 122.36 at 150.43 would pave the way to 61.8% retracement at 167.78. And with that, the 55 month EMA will be firmly taken out which suggests that price actions from 116.83 is indeed a sideway pattern that could last more than a decade.
EUR/JPY Weekly Outlook
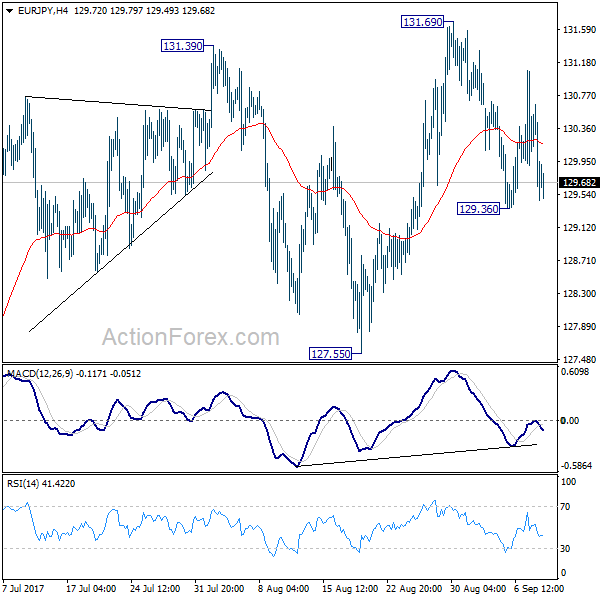
EUR/JPY edged lower to 129.36 last week but recovered since then. But overall, outlook remains unchanged that a short term top is in place at 131.69. Initial bias remains neutral tis week first. Break of 129.36 will turn bias to the downside for 127.55 support first. Firm break there will indicate near term reversal and deeper fall would be seen back to 122.39/125.80 support zone. In any case, we'd expect more corrective trading with risk of another fall, as long as 131.69 holds.
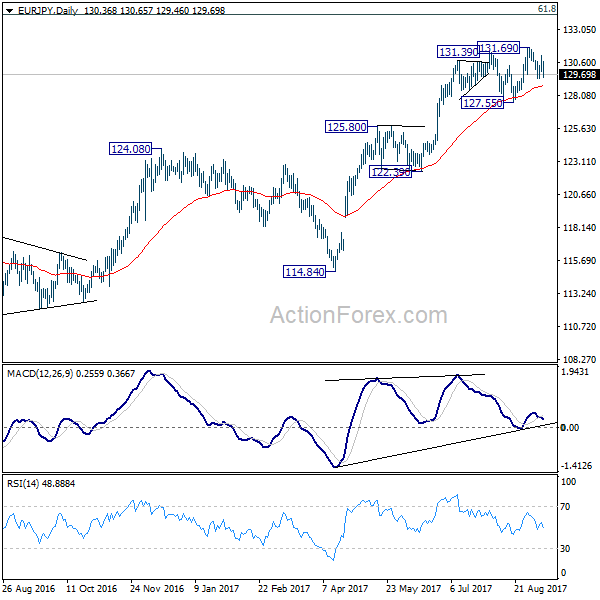
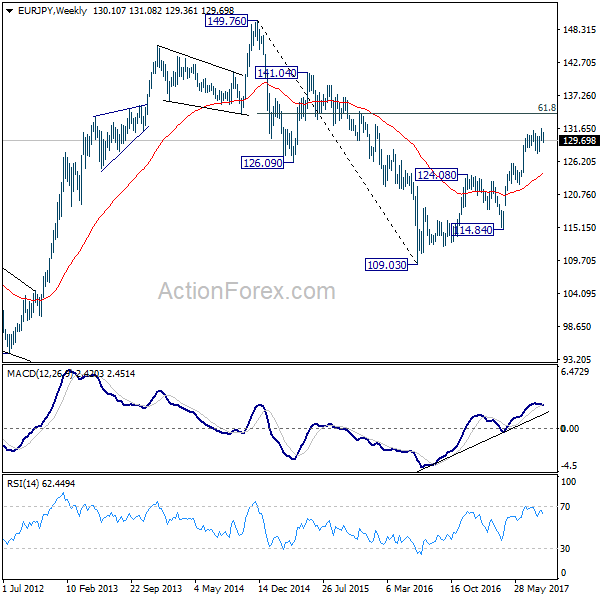
In the bigger picture, current rise from 109.03 is seen as at the same degree as the down trend from 149.76 (2014 high) to 109.03 (2016 low). as long as 124.08 resistance turned support holds, further rise is expected to 61.8% retracement of 149.76 to 109.03 at 134.20. Sustained break there will pave the way to key long term resistance zone at 141.04/149.76. However, firm break of 124.08 will argue that rise from 109.03 is completed and turn outlook bearish.
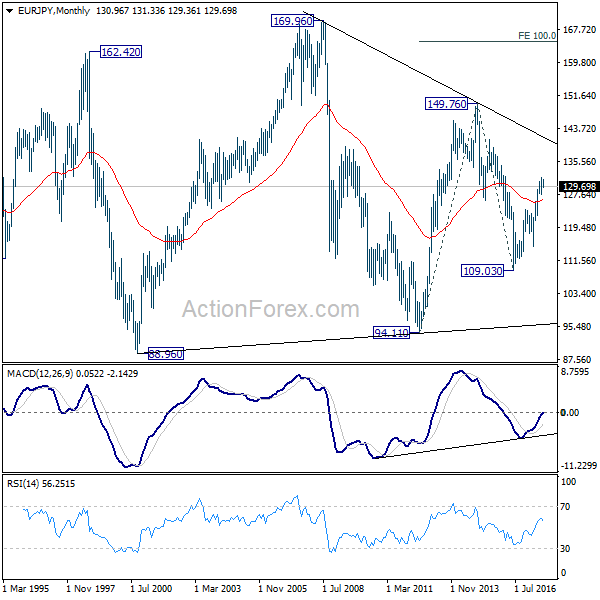
In the long term picture, at this point, there is no clear indication that rise from 109.03 is resuming that from 94.11. Hence, we'd be cautious on topping below 149.76 to extend range trading. Nonetheless, firm break of 149.76 will indicates strong underlying buying. In such case, EUR/JPY will target 100% projection of 94.11 to 149.76 from 109.03 at 164.68.
EUR/GBP Weekly Outlook
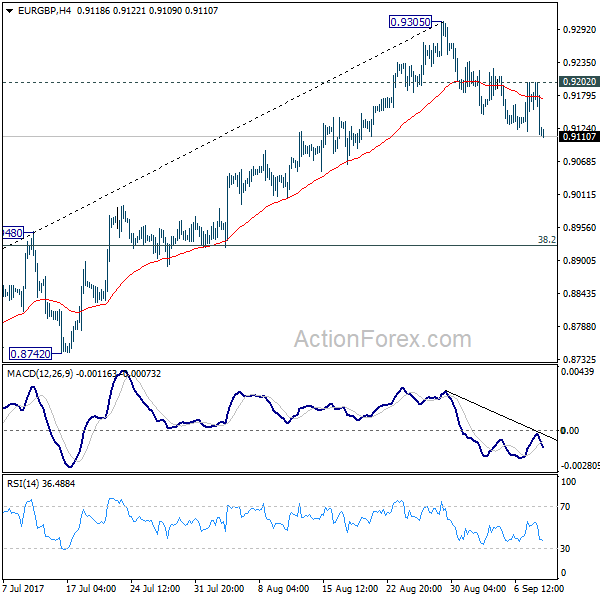
EUR/GBP's decline from 0.9305 short term top extended lower last week. Initial bias stays on the downside this week for 55 day EMA (now at 0.9018). Sustained trading below there will likely start the third leg of the consolidation from 0.9304 and target 38.2% retracement of 0.8312 to 0.9305 at 0.8926 first. On the upside, above 0.9202 minor resistance will turn bias back to the upside for 0.9305 resistance instead.
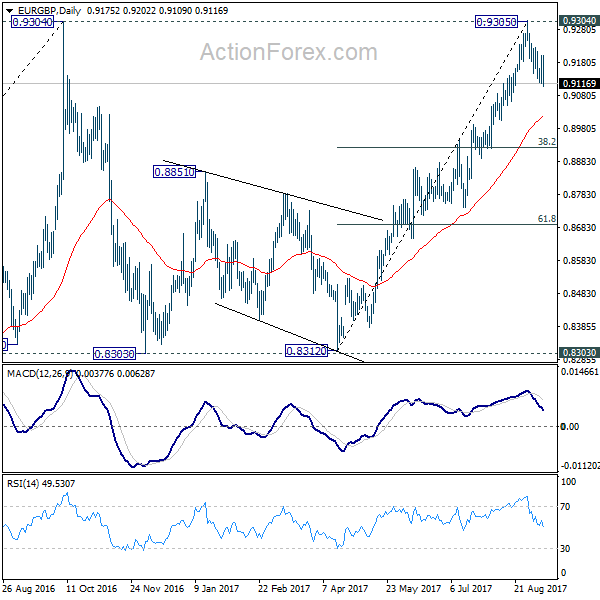
In the bigger picture, price actions from 0.9304 are viewed as a medium term corrective pattern. It's uncertain whether it is finished yet. But in case of another fall, we'd expect strong support from 0.8116 cluster support (50% retracement of 0.6935 to 0.9304 at 0.8120) to contain downside and bring rebound. Whole up trend from 0.6935 is expected to resume after consolidation from 0.9304 completes. Firm break of 0.9799 high will target 61.8% projection of 0.5680 to 0.9799 from 0.6935 at 1.1054.
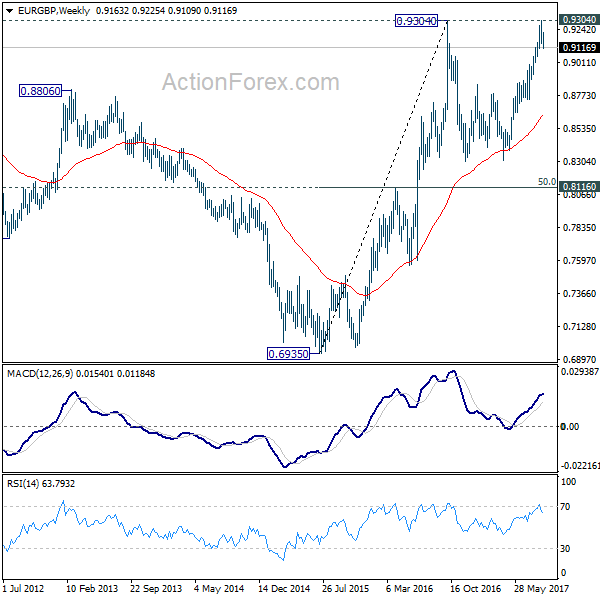
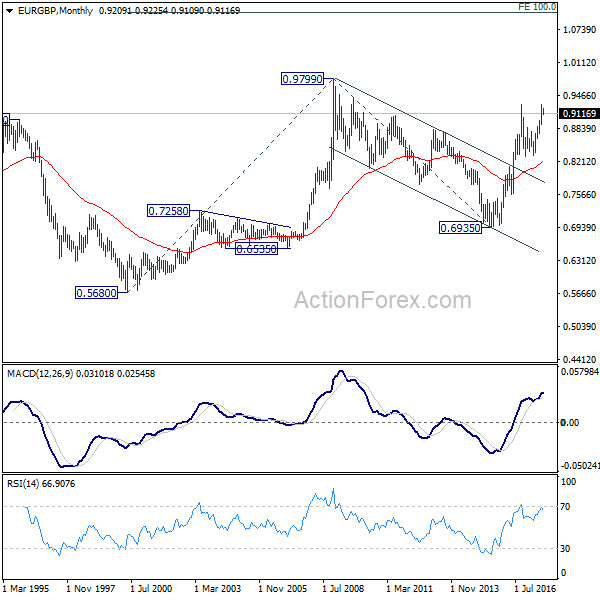
In the long term picture, firstly, price action from 0.9799 (2008 high) is seen as a long term corrective pattern and should have completed at 0.6935 (2015 low). Secondly, rise from 0.6935 is likely resuming up trend from 0.5680 (2000 low). Thirdly, this is supported by the impulsive structure of the rise from 0.6935 to 0.9304. Hence, after the correction from 0.9304 completes, we'd expect another medium term up trend through 0.9799 to 61.8% projection of 0.5680 to 0.9799 from 0.6935 at 1.1054.
EUR/AUD Weekly Outlook
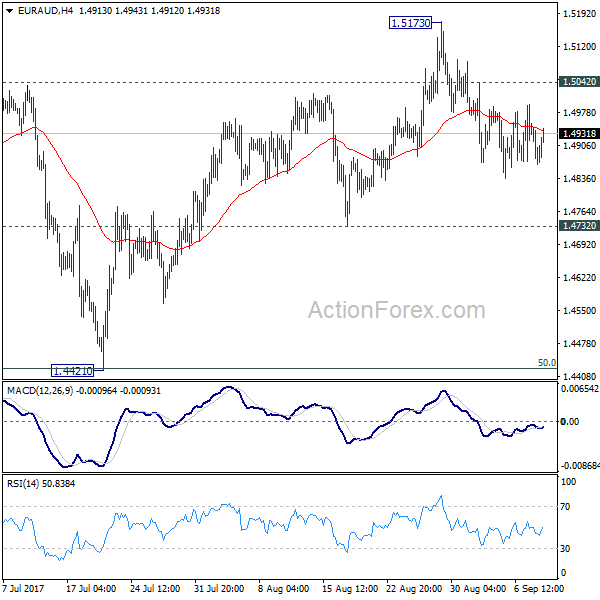
EUR/AUD was bounded in tight range last week but outlook is unchanged. With 1.5042 minor resistance intact, deeper decline is expected to 1.4732 support. Decisive break there confirm that fall from 1.5173 is the third leg of consolidation pattern from 1.5226. In that case, further fall should be seen to 1.4421 again. But we'd expect strong support from there to contain downside and bring rebound. On the upside, above 1.5042 minor resistance will turn bias back to the upside for 1.5173/5226 resistance zone instead.
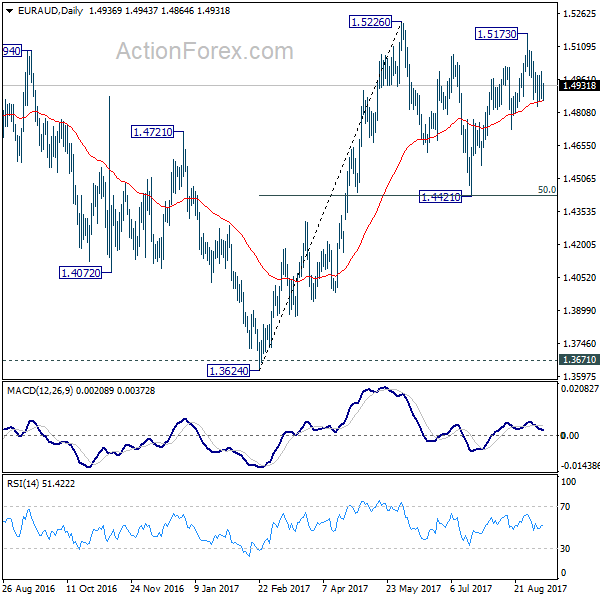
In the bigger picture, we're holding on to the view that corrective decline from 1.6587 medium term has completed at 1.3624. Rise from 1.3624 is expected to extend to retest 1.6587. The corrective structure of the price actions from 1.5226 is affirming this view. Above 1.5226 will target a test on 1.6587 key resistance. However, break of 1.4421 support will dampen our view and would drag EUR/AUD lower to retest key support zone around 1.3624.
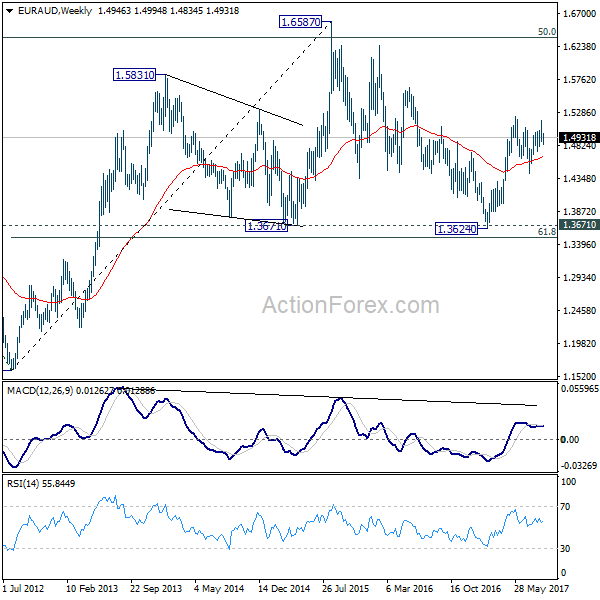
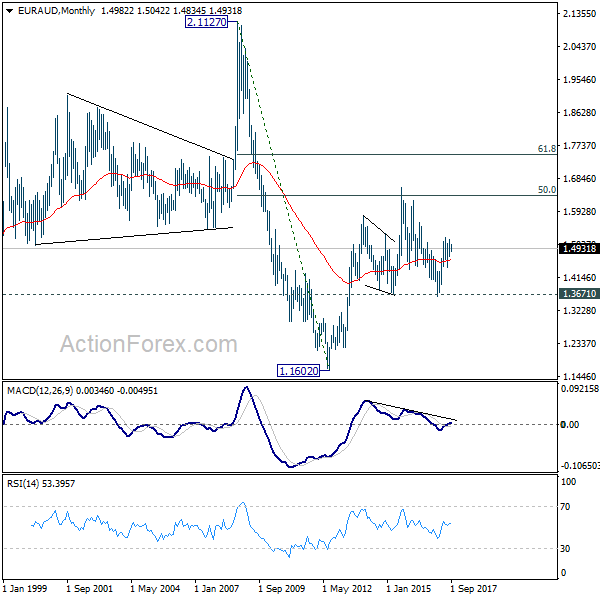
In the longer term picture, the rise from 1.1602 long term bottom isn't over yet. We'll keep monitoring the development but there is prospect of extending the rise to 61.8% retracement of 2.1127 to 1.1602 at 1.7488 and above. However, sustained trading below 1.3671 should confirm trend reversal and target 1.1602 long term bottom again.
EUR/CHF Weekly Outlook
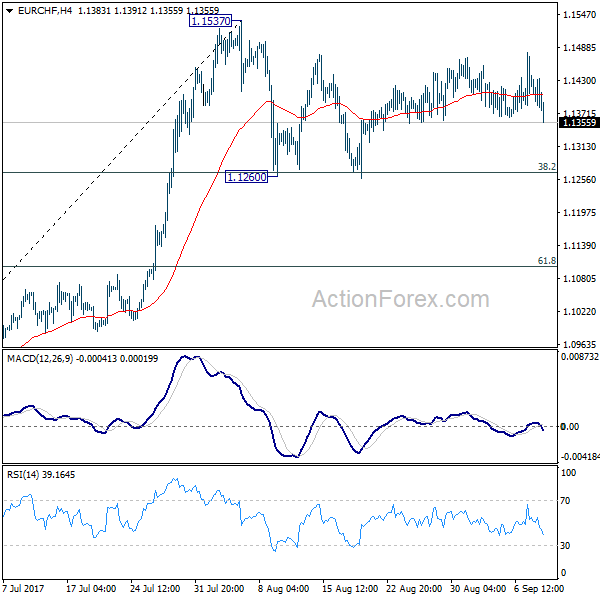
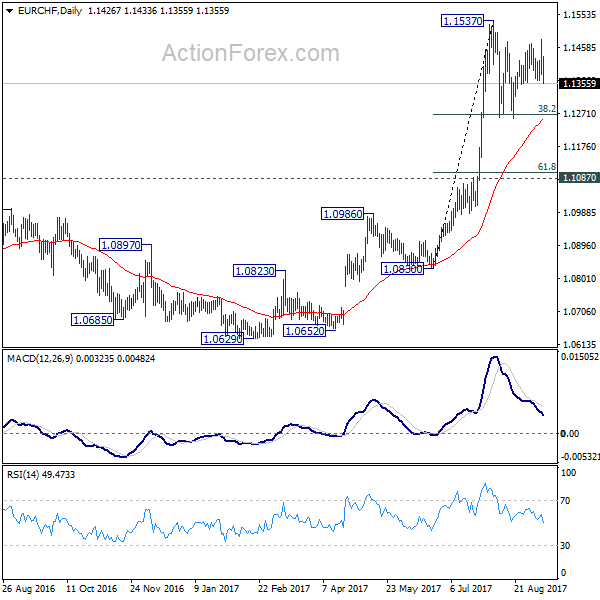
EUR/CHF edged higher to 1.1480 last week but reversed since then. But after all, the cross remained inside range of 1.1260/1537. Initial bias remains neutral this week first and more consolidation could be seen. On the upside, break of 1.1537 resistance will confirm resumption of larger rally from 1.0629. In that case, EUR/CHF should target 1.2 key resistance level next. On the downside, firm break of 38.2% retracement of 1.0830 to 1.1537 at 1.1267 will extend the correction to 61.8% retracement at 1.1100 before completion.
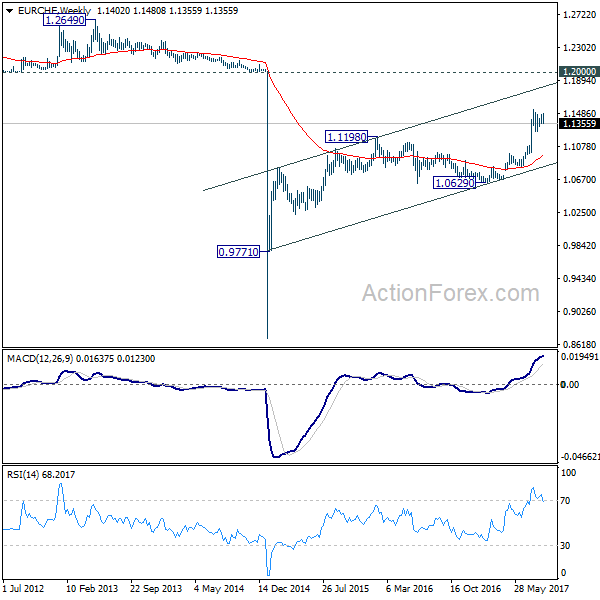
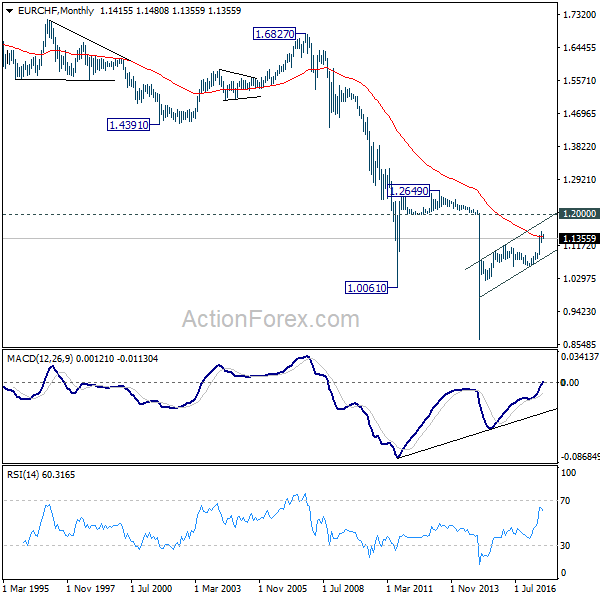
In the bigger picture, long term rise from SNB spike low back in 2015 is still in progress. EUR/CHF should now be heading back to prior SNB imposed floor at 1.2000. For now, this will be the favored case as long as 1.1087 resistance turned support holds.