Sample Category Title
USD/CHF Daily Outlook
Daily Pivots: (S1) 0.9404; (P) 0.9456; (R1) 0.9490; More....
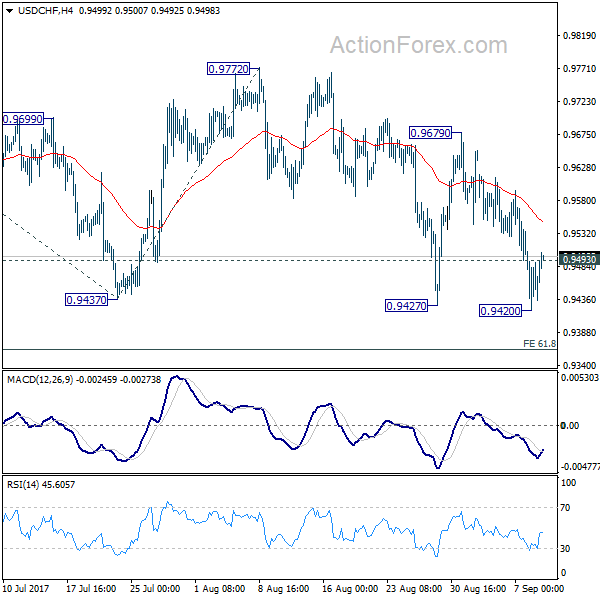
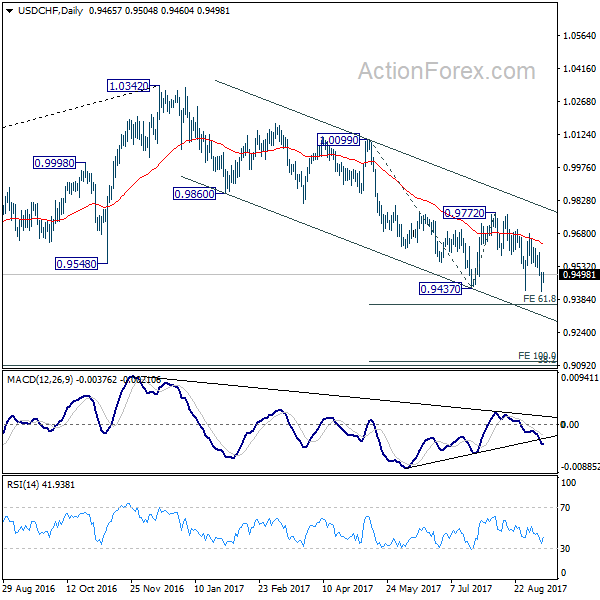
USD/CHF's recovery and break of 0.9493 minor resistance indicates temporary bottoming at 0.9420. Intraday bias is turned neutral for consolidation. But after all, near term outlook remains bearish as long as 0.9679 resistance holds. Deeper fall is still expected. Sustained break of 0.9420 will target 61.8% projection of 1.0099 to 0.9437 from 0.9772 at 0.9363 first. Break will target 100% projection at 0.9110 next.
In the bigger picture, current development suggests that 0.9443 key support (2016 low) could be taken out firmly as down trend form 1.0342 extends. There are various interpretation of the price actions. But in any case, medium term outlook will stay bearish as long as 0.9772 resistance holds. Current down trend could extend to 38.2% retracement of 0.7065 (2011 low) to 1.0342 (2016 high) at 0.9090. However, break of 0.9772 will indicate that USD/CHF has successfully defended 0.9443 again and turn outlook bullish for 1.0099 resistance.
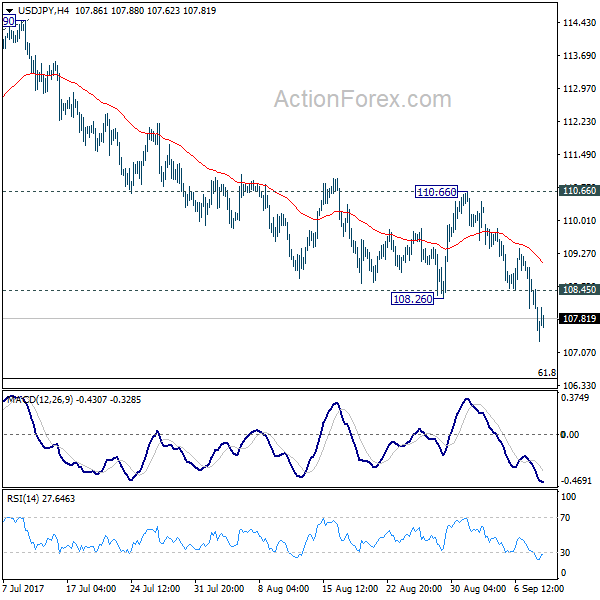
USD/JPY Daily Outlook
Daily Pivots: (S1) 107.27; (P) 107.88; (R1) 108.44; More...
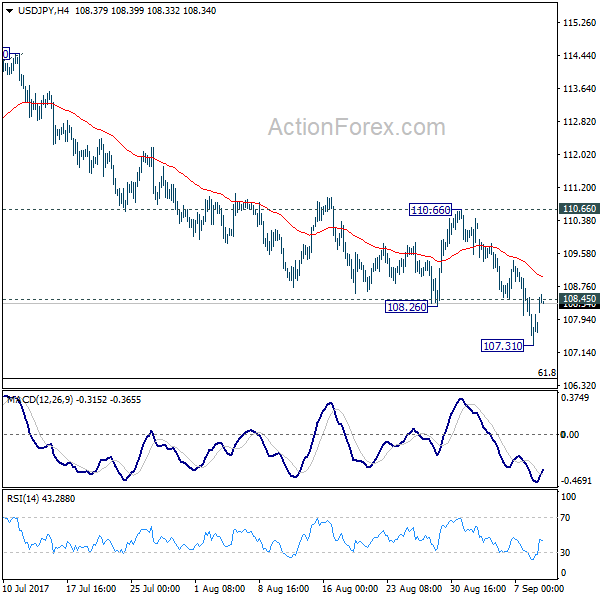
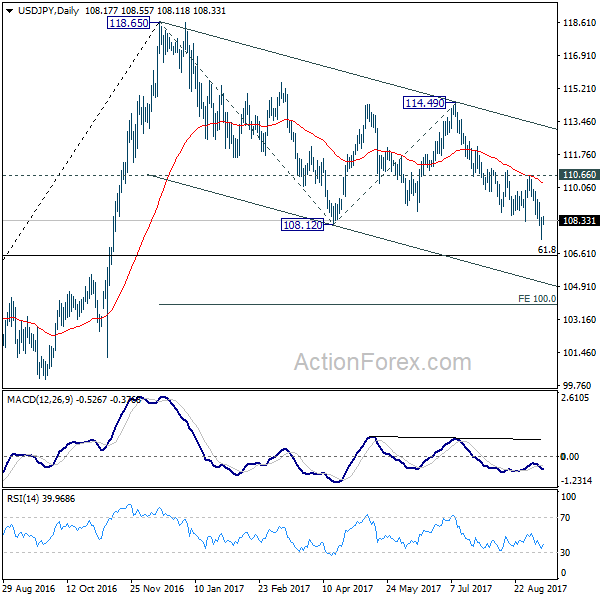
USD/JPY's strong rebound today suggests temporary bottoming at 107.31. Intraday bias is turned neutral for consolidations first. But outlook will remain bearish as long as 110.66 resistance holds. And, deeper decline is expected. Below 107.31 will extend the whole fall from 118.65 to 61.8% retracement of 98.97 to 118.65 at 106.48 first. We'd look for support from there to bring rebound. But firm break of 106.48 will extend the decline to 100% projection of 118.65 to 108.12 from 114.49 at 103.96 or below.
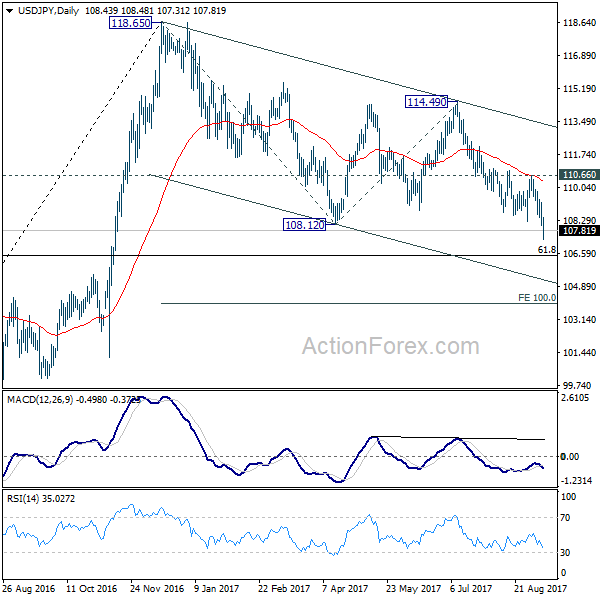
In the bigger picture, rise from 98.97 (2016 low) is now seen as the second leg of the corrective pattern from 125.85 (2015 high). It's unclear whether this this second leg has completed at 118.65 or not. But medium term outlook will be mildly bearish as long as 114.49 resistance holds. And, there is prospect of breaking 98.97 ahead. Meanwhile, break of 114.49 will bring retest of 125.85 high. But even in that case, we don't expect a break there on first attempt.
Dollar Recovers as Geopolitical Risks Moderate Slightly, BoE and SNB to Meet this Week
Dollar recovers broadly today as the weekend passed without any geopolitical events. But the greenback is slightly out-performed by Canadian Dollar. Meanwhile, Swiss Franc and Yen trade broadly losing, paring some of last week's risk aversion gains This pattern is also seen in other markets as gold is back pressing 1340 handle after hitting as high as 1362.4 last week. Economic calendar is rather light today and the forex markets will likely engage in some more consolidative trading. Nonetheless, more key events are scheduled for the week ahead including UK inflation, BoE and SNB meeting.
Geopolitical tensions moderated temporarily
Geopolitical tensions showed signs of temporary moderation as North Korea had not launched another missile test on September 9, the founding anniversary of the country. However, the US submitted a draft resolution to the UNSC last Friday proposing to add new sanctions against North Korea. The US is pushing to vote for the notion as UNSC members meet today. The US and Japan have been pushing for harsher sanctions against the hermit kingdom. On the other hand, China and Russia, the two UNSC veto powers besides the US, the UK, and France, are reluctant to impose tougher measures, let alone military intervention. North Korea has warned that the US has to pay the price for strengthening sanctions.
Harvey and Irma could cost USD 190b damage, 1.5% of GDP
In US, hurricane Irma made landfall Sunday as forecasted. According to AccuWeather, the damage from Irma could be at around USD 100b, among the costliest hurricanes of all time. And that is 0.5% of GDP of USD 19T. Damage of hurricane Harvey is estimated to be even worse at USD 190b, at nearly 1% of GDP. Together, the damages could be up to USD 190b, at 1.5% of GDP. Also, this is the first time two Category 4 hurricanes have hit US in the same year.
UK Parliament to vote on Brexit Repeal Bill
In UK, eyes will be on a parliamentary vote of the so called Brexit "Repeal Bill" today. In short, the bill seeks to copy and paste EU laws into UK legislation so that UK will have the same functioning laws and regulatory framework at the time of Brexit. Brexit Secretary David Davis warned that a vote against the bill is "a vote for chaotic exit from the European Union". And he emphasized that "businesses and individuals need reassurance that there will be no unexpected changes to our laws after exit day and that is exactly what the repeal bill provides. Without it, we would be approaching a cliff edge of uncertainty which is not in the interest of anyone." The government will need to secure the votes today to move on to the next phase of the legislation process. Opposition Labour Party has already indicated that they will vote against unless there are concessions.
China cut forex reserve requirement from 20% to 0%.
In China, the PBoC will unwind the rules on forex exchange forward reserve requirements that were implemented back in 2015. Back then the Renminbi exchange rate suffered prolonged depreciation after the devaluation in August 2015. The implementation of 20% reserve requirement was a move to halt the unwanted speculation in the exchanged rate. Effective today, the requirement is cut down to 0%. The move is seen by the markets as the government is adopting a more liberalized approach to Yuan trading. And it's also an act to soften restriction on capital outflow. Released over the weekend, China CPI accelerated to 1.6% yoy in August, up from 1.4% yoy. PPI slowed to 5.4% yoy, below 5.5% yoy.
Elsewhere in Asia, Japan machine orders rose 8.0% mom in July, M2 rose 4.0% yoy, Tertiary industry index rose 0.1% mom in July. Canadian housing starts is the only featured in the calendar today.
UK CPI, BoE and SNB to highlight the week
Looking ahead, it will be a particular big week for Sterling. UK inflation data to be released on Tuesday will be the first to watch. CPI is expected to climb back to 2.8% yoy in August. Tamer than expected inflation reading has cooled the speculations of an early rate hike by BoE. Indeed, there are talks that inflation would not even touch 3% level. Baring any upside surprise, BoE will likely remains on hold until the Brexit picture becomes clear. And talking about BoE, the monetary policy decision to be delivered on Thursday will be a major focus too. While the central bank is widely expected to keep bank rate and asset purchase target unchanged, attention will be on the vote split. In particular, eyes will be on whether hawks Michael Saunders and Ian McCafferty would change their mind.
SNB rate decision will be another major focus too. The Swiss franc suffered steep selling back in July but it has then stabilized. Indeed, rising geopolitical tensions have given the Franc a lift recently. SNB chairman Thomas Jordan has also indicated his cautious stance earlier this month. He emphasized that "it doesn't make any sense to jeopardize the recovery by tightening our monetary policy." And, the selloff and Franc back earlier just reduced the "significant overvaluation. And, situation in the exchange rate "remains fragile". He doubted if " the short-term movements we see in the markets are sustainable."
Elsewhere, US inflation data will be another key focus of the week. Australia employment and a batch of China data on Thursday will also be watched.
Here are some highlights for the week ahead:
- Tuesday: Australia NAB business confidence; UK CPI, RPI, PPI, house price index; US JOLTS job openings
- Wednesday: Australia Westpac consumer confidence; German CPI final; Swiss PPI, UK employment; Eurozone industrial production, employment; US PPI
- Thursday: Australia employment, China retail sales, industrial production, fixed assets investment. SNB rate decision; BoE rate decision; Canada new housing price index; US jobless claims, CPI
- Friday: New Zealand Business NZ manufacturing index; Eurozone trade balance; US empire state manufacturing, retail sales, industrial production, U of Michigan sentiment, business inventories.
USD/JPY Daily Outlook
Daily Pivots: (S1) 107.27; (P) 107.88; (R1) 108.44; More...
USD/JPY's strong rebound today suggests temporary bottoming at 107.31. Intraday bias is turned neutral for consolidations first. But outlook will remain bearish as long as 110.66 resistance holds. And, deeper decline is expected. Below 107.31 will extend the whole fall from 118.65 to 61.8% retracement of 98.97 to 118.65 at 106.48 first. We'd look for support from there to bring rebound. But firm break of 106.48 will extend the decline to 100% projection of 118.65 to 108.12 from 114.49 at 103.96 or below.
In the bigger picture, rise from 98.97 (2016 low) is now seen as the second leg of the corrective pattern from 125.85 (2015 high). It's unclear whether this this second leg has completed at 118.65 or not. But medium term outlook will be mildly bearish as long as 114.49 resistance holds. And, there is prospect of breaking 98.97 ahead. Meanwhile, break of 114.49 will bring retest of 125.85 high. But even in that case, we don't expect a break there on first attempt.
Economic Indicators Update
| GMT | Ccy | Events | Actual | Forecast | Previous | Revised |
|---|---|---|---|---|---|---|
| 23:50 | JPY | Machine Orders M/M Jul | 8.00% | 4.10% | -1.90% | |
| 23:50 | JPY | Japan Money Stock M2+CD Y/Y Aug | 4.00% | 4.10% | 4.00% | |
| 4:30 | JPY | Tertiary Industry Index M/M Jul | 0.10% | 0.10% | 0.00% | |
| 6:00 | JPY | Machine Tool Orders Y/Y Aug P | 28.00% | |||
| 12:15 | CAD | Housing Starts Aug | 220.0K | 222.3K |
Weekly Technical Outlook And Review: EUR/USD, GBP/USD, AUD/USD, USD/JPY, USD/CAD, USD/CHF, DOW 30, GOLD
A note on lower timeframe confirming price action...
Waiting for lower timeframe confirmation is our main tool to confirm strength within higher timeframe zones, and has really been the key to our trading success. It takes a little time to understand the subtle nuances, however, as each trade is never the same, but once you master the rhythm so to speak, you will be saved from countless unnecessary losing trades. The following is a list of what we look for:
- A break/retest of supply or demand dependent on which way you're trading.
- A trendline break/retest.
- Buying/selling tails ... essentially we look for a cluster of very obvious spikes off of lower timeframe support and resistance levels within the higher timeframe zone.
- Candlestick patterns. We tend to only stick with pin bars and engulfing bars as these have proven to be the most effective.
We typically search for lower-timeframe confirmation between the M15 and H1 timeframes, since most of our higher-timeframe areas begin with the H4. Stops are usually placed 1-3 pips beyond confirming structures.
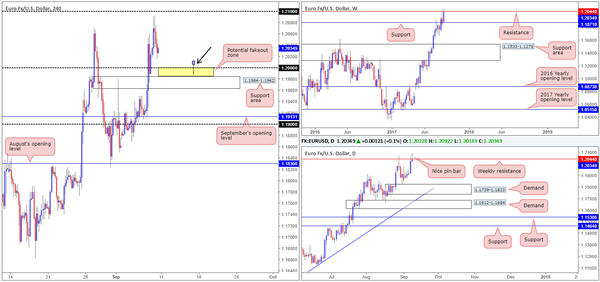
EUR/USD
Weekly gain/loss: + 173 pips
Weekly closing price: 1.2034
Over the course of last week's trading, the single currency maintained a bullish posture from weekly support pegged at 1.1871. Rallying close to 200 pips on the week, the move chalked up a fresh high of 1.2092 and revisited weekly resistance at 1.2044. Interestingly, the weekly USDX chart shows price violated support at 11854 and now looks poised to press its way down to support marked at 11687 (converges with a long-term trendline support taken from the low 9322). Should this come to fruition, this could lead to the EUR breaking through the current weekly resistance and pushing as far north as the weekly broken Quasimodo line at 1.2287 (the next upside target – not seen on the screen).
Turning our attention to the daily candles, Friday's movement formed a tasty-looking bearish selling wick that pierced through the current weekly resistance. Although the EUR is trending with a reasonably strong upside bias right now, this candlestick formation has likely garnered some attention. Over on the USDX daily chart, we can see that the unit also touched gloves with a daily channel support extended from the low 12352, but failed to produce much of a bullish buying tail. A selloff from current price (EUR) could see the major retest demand printed at 1.1739-1.1823.
A quick recap of Friday's trading on the H4 chart shows price topped at 1.2092 during the early hours of Europe, and ended the day in negative territory. To the downside, the next area of interest is the large psychological barrier 1.20, followed closely by a support area positioned at 1.1984-1.1962. In between these two structures, we've shaded the area in yellow to represent a potential fakeout zone. Why? Well, psychological numbers have a tendency to be whipsawed (a fakeout), and the yellow area is likely where you'll see this occur should it happen. A quick glance at the USDX H4 chart, nevertheless, sees price trading from resistance at 11787 with room to stretch as far down at 11728: a H4 Quasimodo support level not seen on the screen. Therefore, there's a chance we may see EUR H4 bulls come into the fray before connecting with 1.20.
Suggestions: So, let's run through what we have here:
Weekly resistance at 1.2044 – strong uptrend.
Daily pin bar at weekly resistance.
H4 nearing 1.20 – possible fakeout into a H4 support area at 1.1984-1.1962.
Technically speaking, this is a rather difficult market to trade. No matter which direction one chooses there's a downside! A long from 1.20 would have you buying in line with the current trend, but at the same time buying into weekly resistance. A sell on other hand is, at least in our view, countertrend, but in line with weekly structure and the daily pin bar.
Personally, given the strength of the uptrend and the lack of selling pressure seen from the noted weekly resistance, we would consider a long from 1.20 if, and only if, a H4 pin bar pierced into the fakeout zone, as drawn on the chart.
Data points to consider: No high-impacting news events scheduled for release today.
Levels to watch/live orders:
- Buys: 1.20 region ([looking for H4 price to fakeout through this number and close higher] stop loss: ideally below the fakeout candle's low).
- Sells: Flat (stop loss: N/A).
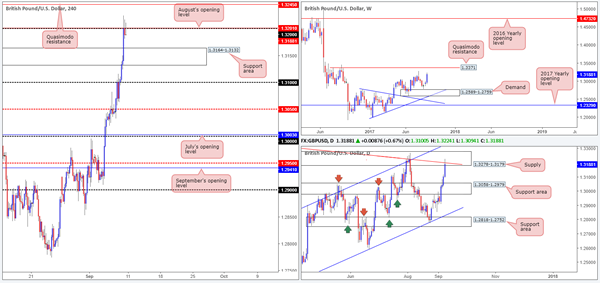
GBP/USD:
Weekly gain/loss: + 277 pips
Weekly closing price: 1.3188
With the USDX steam rolling its way through support at 11854 last week, the British pound just as aggressively rallied north. Downside on the USDX looks reasonably free for price to challenge support logged in at 11687, as does the GBP up to the weekly Quasimodo resistance level at 1.3371.
From Tuesday onwards last week a collection of daily bullish candles took shape, breaking through a resistance area at 1.3058-1.2979 and testing supply penciled in at 1.3278-1.3179 by the week's end. Although this supply boasts a nice-looking trendline resistance taken from the high 1.3480, directly above you'll notice that there's also a channel resistance stretched from the high 1.2903. Something else that may be of interest is the USDX daily candles recently connected with a channel support extended from the low 12352.
Friday's better-than-expected UK manufacturing production figures, coupled with a robust decline in the US dollar, sent the GBP soaring higher amid the London morning session. As you can see, the H4 resistance area at 1.3164-1.3132 was easily cleared, and it was only once the H4 candles struck 1.32 did the unit begin to mildly pare gains.
Suggestions: In essence, the nuts and bolts of this pair can be summed up as follows:
Weekly – room to move higher to 1.3371.
Daily – at supply with converging trendline resistance, channel resistance seen lurking above.
H4 – Bearish wicks printed from 1.32, possible move down to 1.3164-1.3132.
To sell, one has the 1.32 handle, daily supply and trendline resistance in favor. Despite this, against you there's the possibility weekly price could move higher, as well as the next downside target on the H4 timeframe being positioned less than 30 pips away (1.3164-1.3132). This, for us at least, is not sufficient enough to warrant a short right now. Unfortunately, the same goes for longs. Yes, we may have weekly flow on our side, but buying into daily supply and psychological resistance is not really a trade we'd label high probability.
Data points to consider: No high-impacting news events scheduled for release today.
Levels to watch/live orders:
- Buys: Flat (stop loss: N/A).
- Sells: Flat (stop loss: N/A).
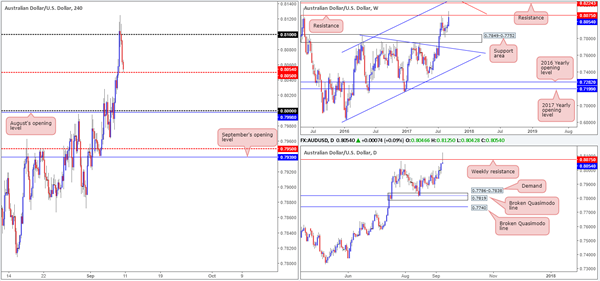
AUD/USD
Weekly gain/loss: + 91 pips
Weekly closing price: 0.8054
Since weekly price shook hands with the support area at 0.7849-0.7752 five weeks back, the commodity-driven currency has maintained a reasonably bullish posture. With the USDX seen selling off and breaking through a key support at 11854 last week, this propelled the Aussie up to resistance drawn from 0.8075.
A closer look at price action on the daily timeframe shows that Friday's trade chalked up a nice-looking bearish pin bar (similar to that on the EUR/USD) from the noted weekly resistance. Also prominent is the USDX daily candles recently linked with a channel support drawn from the low 12352. To our way of seeing things, downside (AUD) looks relatively cramped on the daily scale with little clear demand seen until we revisit the 0.7786-0.7838 area.
Looking at Friday's trade on the H4 timeframe, the 0.81 handle suffered multiple attacks in early trading, but managed to hold ground and eventually push lower. The move, as can be seen on the chart, brought price into contact with mid-level support at 0.8050 by the close.
Suggestions: With weekly resistance at 0.8075 now in the picture, watch for H4 buyers to be taken out at 0.8050 today. A decisive H4 close beyond this number – coupled with a retest and a reasonably sized H4 bearish candle in the shape of a full, or near-full-bodied formation – would be enough for our desk to initiate a short trade, targeting the key 0.80 level/August's opening line at 0.7998 as an initial take-profit base.
Data points to consider: No high-impacting news events scheduled for release today.
Levels to watch/live orders:
- Buys: Flat (stop loss: N/A).
- Sells: Watch for H4 price to engulf 0.8050 and then look to trade any retest seen thereafter ([waiting for a H4 bearish candle – preferably a full-bodied candle – to form following the retest is advised] stop loss: ideally beyond the candle's wick).
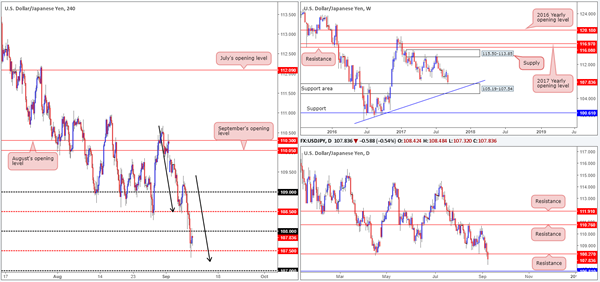
USD/JPY:
Weekly gain/loss: – 239 pips
Weekly closing price: 107.83
The USD/JPY shredded almost 250 pips of value amid trade last week, bringing weekly price down to the top edge of a support area formed at 105.19-107.54. Although we believe the pair is likely to find a bottom here with it having been a relatively strong barrier since 2014, there's a chance the unit may dig a little deeper since USDX weekly action shows room to decline down to support at 11687 (converges with a long-term trendline support taken from the low 9322). Daily movement, however, ended the week crossing below support at 108.27 (now acting resistance), possibly opening up downside to support at 106.81.
Reviewing Friday's movement on the H4 timeframe shows that the 108 handle was wiped out, leaving price free to greet mid-level support at 107.50, and greet it did. The bounce from 107.50 bid price back up to 108, which, as you can see, held firm as resistance during the later hours of NY. The other key thing to note here is the AB=CD formation (black arrows) that completes around the 107.25 mark.
Suggestions: Given weekly price is trading from a recognized support area and H4 price printed a nice-looking AB=CD approach, this week's spotlight will firmly be focused on longs. However, as there's marginal risk of downside to daily support at 106.81, we will need to see H4 price close above 108 before our team looks at buying this market. A retest of 108 as support, followed by a lower-timeframe confirming signal (see the top of this report) would be ideal.
Data points to consider: No high-impacting news events scheduled for release today.
Levels to watch/live orders:
- Buys: Watch for price to engulf 108 and then look to trade any retest seen thereafter ([waiting for a lower-timeframe confirming signal to form following the retest is advised] stop loss: dependent on where one confirms this number).
- Sells: Flat (stop loss: N/A).
USD/CAD:
Weekly gain/loss: – 236 pips
Weekly closing price: 1.2156
After hammering its way through a weekly trendline support etched from the low 0.9633, the USDCAD sustained further losses last week (fourth consecutive losing week) and placed the pair around the top edge of a weekly demand at 1.1919-1.2074. According to the USDX weekly chart though, dollar bulls may struggle here as price shows space to extend down to weekly support at 11687.
While we have seen a small bullish response from the noted weekly demand, daily price shows further upside could be challenging given a nearby broken Quasimodo line at 1.2201. A close above this daily hurdle does not really make things any better either since there's a neighboring resistance area derived at 1.2303-1.2423.
Interestingly, H4 price ended Friday's segment printing a full-bodied bullish close above 1.2150. This, technically speaking, has likely confirmed upside strength to the 1.22 handle, which is positioned just one pip below the aforementioned broken daily Quasimodo line.
Suggestions: Drill down to the lower timeframes and wait for a retest of 1.2150 to take place. Should this come to fruition and structure chalks up a lower-timeframe confirming buy signal (see the top of this report for more information), there could be an opportunity to buy this market up to 1.22 as an initial take-profit line. Just make sure you have adequate risk/reward at the first target, since the broken daily Quasimodo line, coupled with a strong down trending market, could eventually force price much lower.
Data points to consider: No high-impacting news events scheduled for release today.
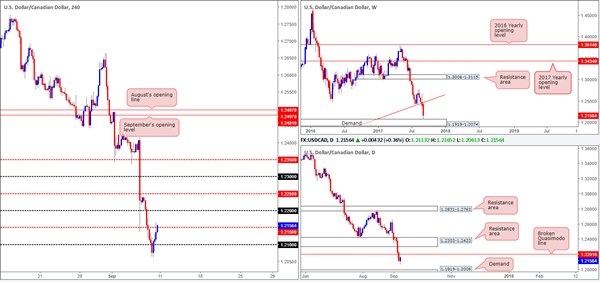
Levels to watch/live orders:
- Buys: 1.2150 region ([waiting for lower-timeframe confirming signal to form from here is advised] stop loss: dependent on where one confirms this number).
- Sells: Flat (stop loss: N/A).
USD/CHF:
Weekly gain/loss: – 202 pips
Weekly closing price: 0.9438
In spite of weekly price marginally closing beyond the walls of a support area at 0.9443-0.9515, this zone, at least in our opinion, is still in the picture. It would need a far more decisive breach before we could conclude that downside is on the cards. However, one still may want to take into account that the USDX weekly candles show support at 11854 was taken out last week, and therefore may promote further selling down to support at 11687.
There's a similar picture drawn on the daily timeframe, with a slight close being seen below support at 0.9444, which, as you can probably see, does in fact denote the lower edge of the weekly support area. In support of this level, nevertheless, daily USDX price shows the unit trading from a channel support taken from the low 12352.
Moving across to the H4 timeframe, Friday's closing candle breached the mid-level support at 0.9450 by twelve pips. On this scale, this is a reasonably respectable close, in our view, and therefore could expose the unit to further downside to the 0.94 handle today. Everything considered though, we would not contemplate selling this market at current price, largely due to the bigger picture (see above).
Suggestions: In light of the above notes, we feel laying low and remaining on the sidelines may be the better path to take at this time. There is, according to our trade plan, very little on offer right now.
Data points to consider: No high-impacting news events scheduled for release today.
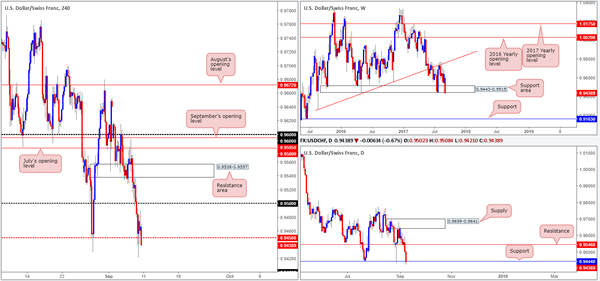
Levels to watch/live orders:
- Buys: Flat (stop loss: N/A).
- Sells: Flat (stop loss: N/A).
DOW 30:
Weekly gain/loss: – 169 points
Weekly closing price: 21808
Recent dealings show US equities remained afloat above weekly demand at 21462-21645 last week, despite ending in the red. With little overhead resistance to contend with on the weekly timeframe, a fresh record high could be achieved this week!
On the other side of the coin, nonetheless, the daily candles show price loitering mid-range between support at 21664 and supply at 22076-21929. Clearly, for weekly bulls to gravitate to fresh highs, offers at this supply need to be consumed beforehand.
Turing our attention to the H4 timeframe, support at 21723 has played a major part in recent trade, with bulls driving price higher from here going into the early hours of US trading on Friday. Providing that the buyers remain in the driving seat here, the next upside target in view can be seen at August's opening level drawn from 21913.
Suggestions: Given that the index remains entrenched within an incredibly strong uptrend, our bias continues to favor upside. Right now though, there's little on the table offering a trade. A retest of the H4 support mentioned above at 21273 would be interesting if additional candle confirmation was seen in the form of full, or near-full-bodied candle. Apart from this, we would want to see the index drive above the current daily supply before any long-term buys were considered.
Data points to consider: No high-impacting news events scheduled for release today
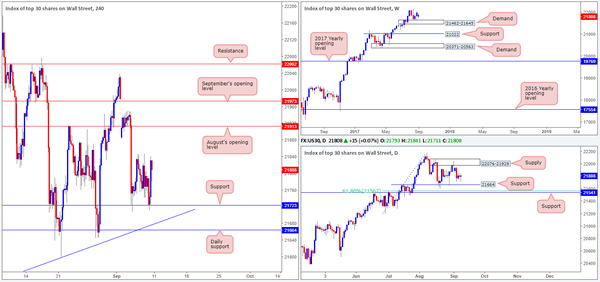
Levels to watch/live orders:
- Buys: 21723 region (waiting for a reasonably sized H4 bullish candle to form – preferably a full, or near-full-bodied candle – is advised] stop loss: ideally beyond the candle's tail).
- Sells: Flat (stop loss: N/A).
GOLD:
Weekly gain/loss: + $21.4
Weekly closing price: 1346.0
Since early July, the yellow metal has been on a tear! Of late, we've seen weekly price drive through offers at resistance drawn from 1337.3 (now acting support), potentially opening up the trapdoor north to resistance visible at 1375.5. Also noteworthy is 1375.5 converges nicely with an AB=CD bearish formation (see black arrow), along with room seen for weekly USDX candles to equally push lower to support at 11687/long-term trendline support taken from the low 9322 (remember gold and the US dollar are typically inversely correlated markets).
Before weekly bulls can shake hands with the aforesaid resistance level, however, daily price will need to chomp through offers sited at supply carved from 1367.3-1354.2. The daily bearish selling wick seen from the area, nonetheless, could bring price down to retest the nearby weekly support mentioned above at 1337.3, before serious buyers step in.
A brief look at recent dealings on the H4 timeframe shows Friday's action tagging resistance at 1356.2 in early European trading, ending the day with a loss. As USDX H4 candles are now seen retesting resistance at 11787, this could, technically speaking, lift the price of gold higher before we reach the aforementioned weekly support, which on the H4 scale you'll see ties in closely with the 38.2% Fib support at 1334.8 from 1297.8.
Suggestions: Based on structure, we have absolutely no intention in becoming sellers right now for the following reasons:
Weekly price free to move up to weekly resistance at 1375.5.
Yes, there is a daily supply at 1367.3-1354.2 in play, but let's also remember that nearby sits a weekly support just beneath it at 1337.3.
H4 USDX is trading from resistance at 11787 – could send the price of gold higher.
We would, however, consider looking at buying from the current weekly support level should price revisit this barrier. We know that by doing so we would effectively be entering long while daily price is selling off from supply, but we feel this may not cause too much of a problem, since the first take-profit target would be the H4 resistance at 1356.2 (essentially the underside of the daily supply).
To be on the safe side though, a trade long from 1337.3 would only be permitted should a reasonably sized H4 bull candle take shape (preferably a full, or near-full-bodied candle). Granted, this will not guarantee a winning trade, but what it will do is show buyer intent from a noted support.
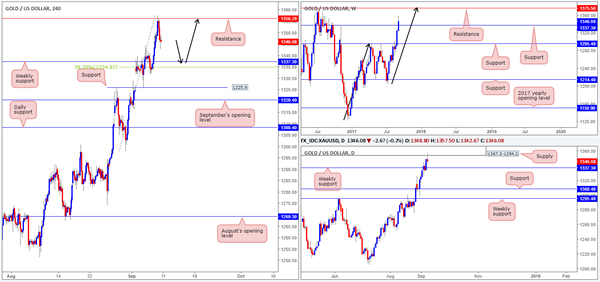
Levels to watch/live orders:
- Buys: 1337.3 region ([waiting for a H4 bullish candle to form is advised] stop loss: ideally beyond the candle tail).
- Sells: Flat (stop loss: N/A).
Market Morning Briefing: Surprising Gap-Up Opening At 108.26 In Dollar-Yen
STOCKS
Overall there is lack of directional clarity on major stock indices just now. It is quite possible to see ranged movements in the next few sessions before we get some confirmation of future direction.
Dow (21797.79, +0.06%) is likely to remain above 21600 for the next few sessions, trying to attempt a rise towards 22400 from where some rejection is possible.
Dax (12303.98, +0.06%) had moved up sharply last week and the initial resistance near 12200 has now turned into an important near term support. While above 12200, the index may trade within 12400-12200 region. A break above 12400, if seen could initiate a fresh medium term upmove.
Nikkei (19541.36, +1.38%) could face some rejection from immediate channel resistance at 19600. While below 19750-19600, a test of lower levels of 19000 remains on the cards.
Shanghai (3378.23, +0.39%) could trade sideways for some days as the index needs some base building for the bulls to gather more strength for the long term. While above 3300, Shanghai looks bullish. For the next one week trade within 3400-3300 region is possible.
Nifty (9934.80, +0.05%) may trade within 9850-10000 region over the next couple of days. Sideways consolidation is likely to continue for a few more days before we see a break out on either side to give more directional clarity for the medium term.
COMMODITIES
Gold (1341) moved lower to rectify its overbought condition, however the immediate trading range of 1326-1361 is intact so far. Similarly Silver (17.95) has also moved lower but still within the range of 17.40-18.05. We had told last Friday that "Please maintain caution at higher levels due to overbought nature". In the medium term,both Gold and Silver are out of their short term bearish channel but the supports of 1288 and 16.80-90 should hold to keep the bullish momentum intact.
Finally Copper (3.04) had responded to its short term overbought condition and moved lower. The short term trading range could be 3.00-3.16.
Brent (53.97) is trading within the bullish channel of 53.30-55.60 and we will remain bullish while it is trading above 50 regions on a weekly closing basis. WTI (47.80) has also moved higher and trading within the range of 47-50.
FOREX
Surprising gap-up opening at 108.26 in Dollar-Yen (108.40) today after the Low of 107.29 and Close at 107.78 on Friday. Although follow-through selling at lower levels was not seen on Friday, need to see if the market runs into selling in the 108.70-90 region over today-tomorrow. How the market performs today-tomorrow will set the tone for the week, possibly the month.
The Dollar Index (91.49) has recovered a bit from the low of 91.13 seen on Friday. If the bounce sustains, we may look for a test of 92.00-20 on the upside this week.
Minor profit-taking in the Euro (1.2016) after the high of 1.2092 seen on Friday. That said, the overall uptrend persists, with intra-week Supports seen near 1.1970, 1.1935 and 1.1895. The Euro-Yen (130.28) is likely to trade sideways between 129.40 and 131.00 for now. Overall trend remains bullish while above 129.40-00.
Strong rise in the Pound (1.3180) to a high of 1.3224 on Friday, in line with expectation of 1.3270.
It is a little disappointing that the Aussie (0.8045) saw a spike up to 0.8125 on Friday (we were targeting 0.82) but has not been able sustain the rally. We remain bullish, however, but have to keep an eye on Supports in the 0.8000-7965 region.
A bit of short-covering in Dollar-Yuan (6.5052) from a low just below 6.44. Need to watch a couple of days if the bounce sustains or not. Dollar-Rupee saw a low of 63.77 on Friday and closed low near 63.7850. But it is quoting higher near 63.95 on the NDF, replicating the gap-up move in Dollar-Yen. Need to see if it breaks above 64.00-10-20 over today-tomorrow.
INTEREST RATES
The benchmark US 10Yr yield (2.09%) rebound from its overbought territory. But we will remain bearish on 10Yr Yield while it is trading below 2.16 regions on a weekly closing basis.
EUR/USD moved marginally lower as the The German-US 2 Yr Spread (-2.02%) and the German-US 10Yr Spread (-1.75%) are range bound so far.
Japan 10Yr yield (-0.01%) hovering around near 0.00 levels while the 30Yr (0.81%) and the 5Yr (-0.16%) are trading marginally lower with no directional clarity.
The UK 5Yr and 30Yr Gilt Yields (5Yr 0.42% and 20Yr 1.53%) are trading below their respective supports. The UK 10Yr (0.99%)is also moved lower after it had rejected from 1.06% regions.
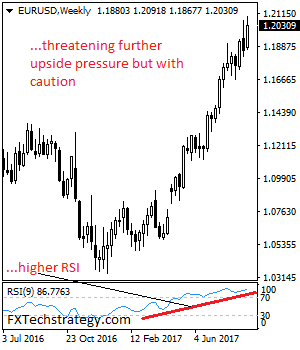
EURUSD – Closes Higher On Bull Pressure But With Caution
EURUSD - With the pair seen closing higher on Tuesday, more recovery is envisaged. Resistance comes in at 1.2100 level with a cut through here opening the door for more upside towards the 1.2150 level. Further up, resistance lies at the 1.2200 level where a break will expose the 1.2250 level. Its daily RSI is bullish and pointing higher suggesting further upside pressure. Conversely, support lies at the 1.2000 level where a violation will aim at the 1.1950 level. A break of here will aim at the 1.1900 level. Below here will open the door for more weakness towards the 1.1850. All in all, EURUSD faces further upside towards its key resistance.
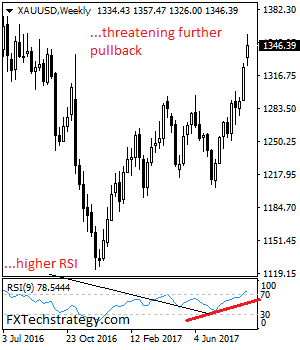
GOLD – Faces Pullback Threats Despite Bull Pressure
GOLD - The commodity looks to weaken further following its Friday price rejection. On the downside, support comes in at the 1,340.00 level where a break will turn attention to the 1,330.00 level. Further down, a cut through here will open the door for a move lower towards the 1,320.00 level. Below here if seen could trigger further downside pressure targeting the 1,310.00 level. Conversely, resistance resides at the 1,350.00 level where a break will aim at the 1,360.00 level. A turn above there will expose the 1,370.00 level. Further out, resistance stands at the 1,380.00 level. All in all, GOLD looks to weaken further.
Difficult FX Trading Conditions
Difficult FX Trading Conditions
The dollar is on a slightly better footing in early trade as the as North Korea( NK) headline risk has cooled a bit from last week’s fevered pitch. With little lack of geopolitical headline escalation over the weekend, traders are nimbly unwinding some NK over hedges in early trade but are still on headline watch.
The weekend headlines have centred on Hurrican Irma as the world’s thoughts and prayers are for the residenters of Florida who are taking a battering from this beast.
Most certainly the swath of devastation both Harvey and Irma have left in their wake will give the Feds cause to pause, however, the rebuilding and recovery will be a massive boost to US growth. Chalk up another issue in the ever expanding Fed Conundrum check list.
Oil prices spilt lower Friday as Florida is the fourth biggest OIL consumer and demand will be muted over the short term
Bloomberg reported that the PBOC would remove reserve requirements on Yuan forwards. Scraping this requirement put in place in October 2015 to curb FX speculation suggests a more liberalised approach to Yuan trading as the PBOC removes some of the defensive mechanism implemented to reduce capital outflow
All in all holding any long term currency position these days remains challenging.
The Chinese Yuan
There was an extraordinary move on USDCNH Friday when the pair dropped from 6.4950to 6.45 level in the blink of an eye. Outside of NK headline risk, the CNH was the real story of last week as on Friday there was record intraday appreciation from the midpoint (smashing the record set on Monday). Other than the weaker USD and lower for longer Fed narrative, there may be some repatriation flows occurring back to the mainland along with the CNH gaining some haven appeal all adding to the bullish sentiment. Although the market is trading above 6.50 USDCNH this morning pre fix, traders will be watching for any push back for the Pboc on the currency strength However the recent currency moves indicate investors optimistic near to view on all things China
Japanese Yen
Led by a collapse in US yields, and Usd Asia was selling off UsdJpy y gave way through 108.00. Nikkei, the worst performer of the Asian indices adding to the woes. With little sabre rattling over North Korean foundation day this weekend, USDJPY has recovered above 108.00, but trader remains very cautious.
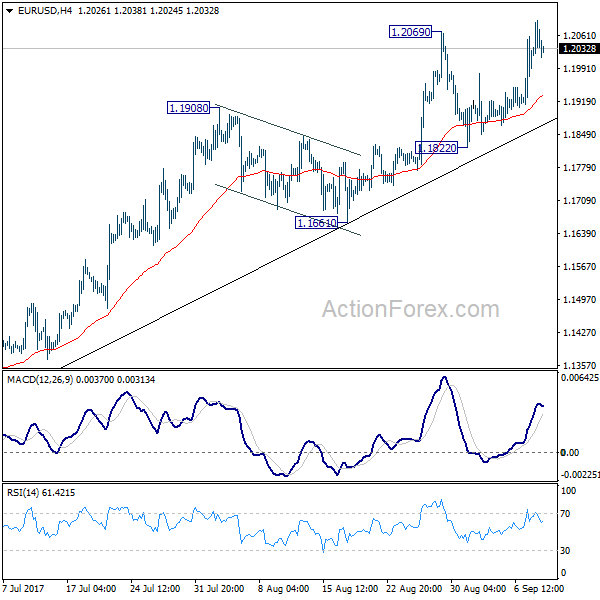
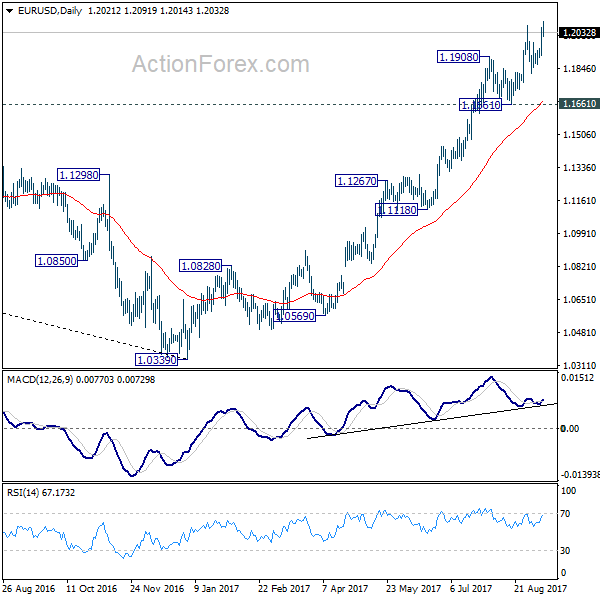
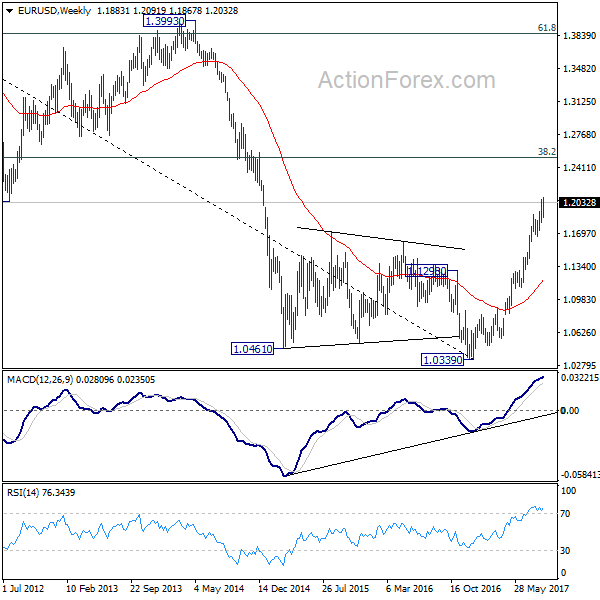
EUR/USD Weekly Outlook
EUR/USD's break of 1.2069 resistance suggests that medium term rise from 1.0339 has resumed. Initial bias remains on the upside this week for further rally. Next target will be next key fibonacci level at 1.2516. On the downside, break of 1.1822 support is needed to indicate short term topping. Otherwise, outlook will remain bullish in case of retreat.
In the bigger picture, rise from medium term bottom at 1.0339 is still in progress for 38.2% retracement of 1.6039 (2008 high) to 1.0339 (2017 low) at 1.2516. However, it should be noted that there is no confirmation of trend reversal yet. That is, such rebound from 1.0399 could be a correction. And the long term fall fro 1.6039 (2008 high) could resume. Hence, we'd be cautious on strong resistance from 1.2516 to limit upside. But after all, break of 1.1661 is needed to indicate medium term topping. Otherwise, outlook will remain bullish in case of pull back.
In the long term picture, 1.0339 is now seen as an important bottom as the down trend from 1.6039 (2008 high) could have completed. It's still early to decide whether price action form 1.0339 is developing into a corrective or impulsive move. But in either case, further rally would be seen to 38.2% retracement of 1.6039 to 1.0339 at 1.2516
USD/JPY Weekly Outlook
USD/JPY's medium decline from 118.65 finally resumed last week and reached as low as 107.31. Initial bias stays on the downside this week for 61.8% retracement of 98.97 to 118.65 at 106.48 first. We'd look for support from there to bring rebound. But firm break of 106.48 will extend the decline to 100% projection of 118.65 to 108.12 from 114.49 at 103.96 or below. On the upside, above 108.45 minor resistance will turn intraday bias neutral first. But outlook will now stay bearish as long as 110.66 resistance holds.
In the bigger picture, rise from 98.97 (2016 low) is now seen as the second leg of the corrective pattern from 125.85 (2015 high). It's unclear whether this this second leg has completed at 118.65 or not. But medium term outlook will be mildly bearish as long as 114.49 resistance holds. And, there is prospect of breaking 98.97 ahead. Meanwhile, break of 114.49 will bring retest of 125.85 high. But even in that case, we don't expect a break there on first attempt.
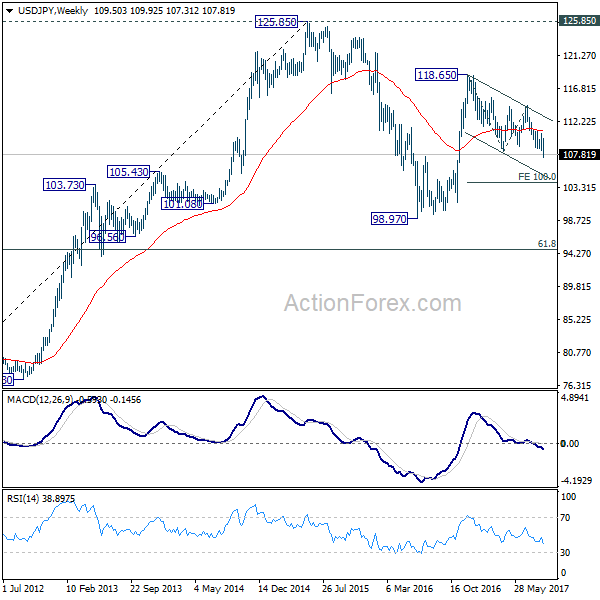
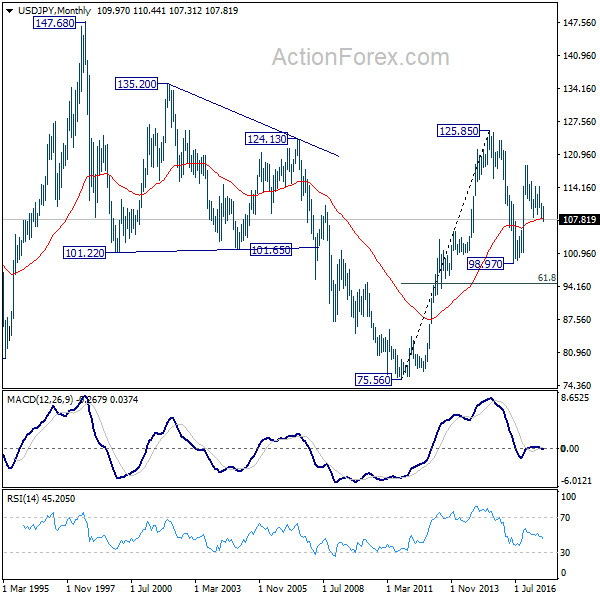
In the long term picture, the rise from 75.56 (2011 low) long term bottom to 125.85 top is viewed as an impulsive move, no change in this view. Price actions from 125.85 are seen as a corrective move which could still extend. In case of deeper fall, downside should be contained by 61.8% retracement of 75.56 to 125.85 at 94.77. Up trend from 75.56 is expected to resume at a later stage for above 135.20/147.68 resistance zone.