
Sample Category Title
Market Update – Asian Session: China CPI Comes In Hot
Asia Summary
Asian equity markets opened higher as North Korea's Founder's day passes without another missile launch. The PBOC set the yuan reference rate at 6.4997, the 11th consecutive stronger setting and the longest streak since 2005. The PBOC also again skipped open market operations (OMO) for the 3rd consecutive session and drained a net CNY40B. Offshore yuan 1-day interbank rate rose 78bp to 2.29433%. Over the weekend China August CPI and PPI came in hotter than expected rising 1.8% on the year and PPI 6.3%, Shanghai Composite remained one of the more modest movers in the day.
USD/KRW fell 0.4% as the market waits for fresh sanctions on North Korea by the UN. North Korea warned that there would be retaliation if the UNSC approves harsher sanctions. On Friday, the PBoC announced its plan to remove reserve conditions for yuan forwards trade; to reduce reserve requirements from 20% to zero; effective Monday, Sept 11th. As a result, the offshore yuan declined 0.3% in Hong Kong offshore market in the premarket. This was confirmed in today session.
NZD/USD weakened around 0.2% after August card spending retail fell m/m for the 4th consecutive month. The Kiwi continued to extend its decline falling as low as 0.7225 after NZ Institute of Economic Research (NZIER) lowered inflation forecast for 2017-18; Cuts 2017/18 inflation (CPI) forecast to 1.1% (vs. 1.5 in June), GDP growth forecast to 2.9% (vs 3.1% in June)
Key economic data
(CN) CHINA AUG CPI Y/Y: 1.8% V 1.6%E; PPI Y/Y: 6.3% V 5.7%E (over the weekend)
(NZ) NEW ZEALAND AUG CARD SPENDING RETAIL M/M: -0.2% V 0.5%E (4th consecutive decline); TOTAL M/M: +0.6% V -0.6% PRIOR
(JP) JAPAN JUL MACHINE ORDERS M/M: 8.0% V 4.1%E; Y/Y: -7.5% V -7.8%E
(CN) China Aug Fiscal Rev CNY1.07T, y/y: 7.2% v 11.1% prior; YTD y/y: 9.8%
Speakers and Press
China
(HK) Hong Kong SFC said to consider revising rules in order to monitor initial coin offerings (ICOs) - HK press
(CN) PBOC confirms have removed reserve requirement on FX forward trading due to market environment change
(CN) China PBOC Shenzhen branch said the city saw large increase in consumer loans for individuals recently and part of the loans may flow into the property market - Chinese press
(CN) According to UOB analyst, China's removal of 20% reserve requirement on fx forwards trading likely to be symbolic as there's little desire for Chinese companies to buy USD now
Korea
(KR) North Korea says closely following US' moves with 'vigilance'; ready and willing to use 'any form of ultimate means' - KCNA
(KR) Follow Up: UN to vote on US drafted sanction on North Korea over nuclear tests Monday afternoon
Japan
(JP) Japan Defense Min Onodera: Will seek to add AEGIS Ashore (missile defense) as soon as possible
Other
(SA) Saudi Arabia Energy Min: The oil min Al-Falih discussed with his Venezuelan and Kazakh counterparts the possible extension of the global oil supply cut pact beyond March 2018
Asian Equity Indices/Futures (00:00ET)
Nikkei +1.4%, Hang Seng +1.0%; Shanghai Composite +0.1%, ASX200 +0.8%, Kospi +0.8%
Equity Futures: S&P500 +0.5%; Nasdaq100 +0.6%, Dax +0.1%, FTSE100 +0.4%
FX ranges/Commodities/Fixed Income (00:00ET)
EUR 1.2039-1.1999; JPY 108.56-107.86; AUD 0.8071-0.8033; NZD 0.7266-0.7225
Dec Gold -0.7% at $1,341/oz; Oct Crude Oil +0.8% at $47.88/brl; Sept Copper +0.4% at $3.05/lb
(AU) Australia buys back A$500M in 2018, 2019 bonds
(AU) Australia sells A$500M in 4.5% 2033 bonds; avg yield 2.9089%; bid-to-cover 2.52x
USD/CNY *(CN) PBOC SETS YUAN REFERENCE RATE AT: 6.4997 V 6.5032 PRIOR (11TH STRAIGHT STRONGER YUAN SETTING, longest streak since 2005)
(CN) PBOC SKIPS OPEN MARKET OPERATIONS (OMO) V SKIPPED PRIOR (3rd straight skip); DRAINS NET CNY40B
(KR) Bank of Korea (BOK) sells KRW670B in 1-yr monetary stabilization bonds at 1.5% v 1.53% prior
(KR) South Korea sells 10-yr Govt bond at 2.245%
Equities notable movers
Australia/New Zealand
SIQ.AU To acquire Aspire Benefits Management (FY18 EPS accretion of ~12%) and assets of RACV Salary Solutions for combined total of A$40.2M; +6%
TAH.AU Says Tatt's independent experts are positive on merger transaction, 2.5%
Hong Kong/China
(CN) China considering setting deadline to ban production and sales of fossil fuel vehicles – press (BYD +6%, SAIC 1%, Geely, +1.8%)
1913.HK Reports H1 Net €115.7M v €143Me, EBITA €279.6M, Rev €1.47B v €1.53Be; -11%
South Korea
023530.KR Exec: Considering options for China supermarkets, including sale; +1.8%
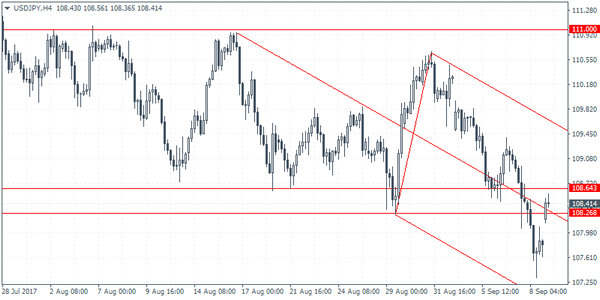
USDJPY Intraday Analysis
USDJPY (108.41): The USDJPY continued to slide as the price fell to session lows of 107.31. Further declines could be expected as the currency pair broke past the support level of 108.64 - 108.26. A minor pullback to this recently breached support level could establish resistance. A reversal off this level will set USDJPY on track to post further losses. In the unlikely event of a breakout above the support level, the bias could be shifting to the upside with 111.00 level of resistance coming into focus.
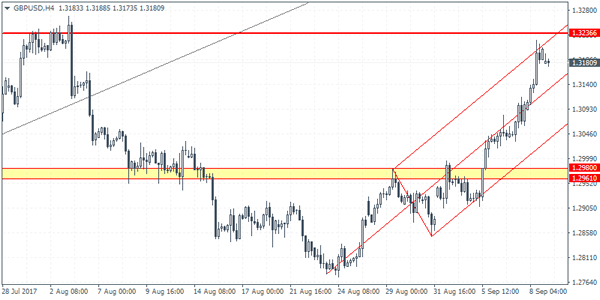
GBPUSD Intraday Analysis
GBPUSD (1.3180): The British pound continued on Friday with strong gains to test the 1.32 handle. The currency gained strength despite the economic data over the week suggesting weakness, especially in the construction and services sector. The week ahead will be intense for the British pound as the inflation, jobs and the BoE meeting will see traders turning cautious on the British pound. Near-term momentum could keep the GBPUSD biased to the upside for a test towards the previously established resistance level of 1.3236. However, a pullback is likely as the support level at 1.2980 - 1.2961 remains in focus.
EURUSD Intraday Analysis
EURUSD (1.2014): The EURUSD posted strong gains last week with the rally being driven partly by the ECB's decision on Thursday and a weaker US dollar. By Friday's close price action was seen pulling back from the 1.20 handle marking a retest of this level for the second time. On the 4-hour chart, we notice that the pullback in the EURUSD will see a retest of the minor support that will be formed at 1.1962. This support could mark the cup and handle pattern that is still evolving. A reversal off 1.1962 will push EURUSD towards 1.2200. Alternately, if the support level at 1.1962 fails, the common currency could slip to the next downside target of 1.1882 which is another strong technical level of interest in the currency pair.

GBPUSD Recovers To 1.32 As USD Weakens
The US dollar continued to ease against most of its peers with Friday's session seeing the US dollar index falling 9.1% on a year to date basis. Besides geopolitics, a dovish Fed alongside the hurricanes in the US has kept the sentiment in the greenback in check.
On the economic front, following a rather busy Thursday, Friday saw the release of UK's manufacturing and construction output. With the exception of manufacturing production, construction output fell 0.9% while industrial production rose a modest 0.2% as expected. Canada's monthly employment report saw the unemployment rate falling to 6.2% while the economy added 22k jobs during the month.
Looking ahead, the economic calendar today is light with no major events to fall back upon. Italian industrial production numbers are due to come out at 0800 GMT followed by housing starts data from Canada later in the afternoon.
Aussie Dollar Trading On A Weaker Footing This Morning
For the 24 hours to 23:00 GMT, the AUD rose 0.07% against the USD and closed at 0.8053 on Friday.
LME Copper prices declined 0.9% or $62.5/MT to $6780.0/MT. Aluminium prices declined 0.1% or $3.0/MT to $2072.0/MT.
Over the weekend, data indicated that in China, Australia's largest trading partner, the consumer price index (CPI) advanced to a seven-month high of 1.8% YoY in August, more than market expectations for a rise of 1.6%. In the prior month, the CPI had advanced 1.4%. Moreover, the nation's producer price index (PPI) climbed more-than-anticipated by 6.3% in August, jumping to a four-month high and following a gain of 5.5% in the preceding month. Markets had anticipated the PPI to increase 5.6%.
In the Asian session, at GMT0300, the pair is trading at 0.8048, with the AUD trading 0.06% lower against the USD from Friday's close.
The pair is expected to find support at 0.8012, and a fall through could take it to the next support level of 0.7977. The pair is expected to find its first resistance at 0.8104, and a rise through could take it to the next resistance level of 0.8161.
Going ahead, market participants will closely monitor Australia's NAB business confidence index for August, due to release in the early hours of tomorrow.
The currency pair is trading below its 20 Hr moving average and showing convergence with its 50 Hr moving average.

German Trade Surplus Narrowed In July
For the 24 hours to 23:00 GMT, the EUR rose 0.08% against the USD and closed at 1.2032 on Friday.
In economic news, Germany’s seasonally adjusted trade surplus narrowed more-than-expected to a level of €19.5 billion in July, as growth in imports outstripped that of exports. The nation had registered a trade surplus of €22.3 billion in the prior month, while market participants were expecting the country’s surplus to narrow to a level of €21.0 billion.
In the US, data indicated that consumer credit increased more-than-expected by $18.5 billion in July, after rising by a revised $11.8 billion in June and compared to market expectations for a rise of $15.0 billion. Further, the nation’s seasonally adjusted final wholesale inventories grew more than initially estimated by 0.6% in July, compared to a flash print indicating a rise of 0.4%. Wholesale inventories had registered a revised similar rise in the previous month.
In the Asian session, at GMT0300, the pair is trading at 1.2018, with the EUR trading 0.12% lower against the USD from Friday’s close.
The pair is expected to find support at 1.1981, and a fall through could take it to the next support level of 1.1943. The pair is expected to find its first resistance at 1.2074, and a rise through could take it to the next resistance level of 1.2129.
With no macroeconomic releases in the Euro-zone today, investor sentiment will be governed by global macroeconomic factors.
The currency pair is trading below its 20 Hr moving average and showing convergence with its 50 Hr moving average

UK’s Manufacturing Production Rebounded For The First Time This Year In July
For the 24 hours to 23:00 GMT, the GBP rose 0.79% against the USD and closed at 1.3200 on Friday, following upbeat economic data from the UK.
Macroeconomic data revealed that Britain's manufacturing production rebounded more-than-expected by 0.5% on a monthly basis in July, rising for the first time in seven months, suggesting that an upturn in the industrial sector was on the cards. Investors had envisaged manufacturing production to rise by 0.3%, after posting a flat reading in the prior month. Moreover, the nation's industrial production climbed 0.2% MoM in July, meeting market consensus and following a gain of 0.5% in the previous month. On the other hand, the nation's construction output fell 0.9% on a monthly basis in July, dipping to its lowest in three months and compared to a drop of 0.1% in the prior month.
Other economic data revealed that UK's total trade deficit surprisingly dropped to a level of £2.87 billion in July, defying market expectations for the nation's deficit to widen to a level of £3.25 billion and following a revised deficit of £2.91 billion in the previous month. Further, NIESR estimated that the nation's gross domestic product (GDP) climbed 0.4% in the three months ended August, compared to a rise of 0.2% predicted in the three months to July.
In the Asian session, at GMT0300, the pair is trading at 1.3183, with the GBP trading 0.13% lower against the USD from Friday's close.
The pair is expected to find support at 1.3115, and a fall through could take it to the next support level of 1.3046. The pair is expected to find its first resistance at 1.3238, and a rise through could take it to the next resistance level of 1.3292.
In absence of any macroeconomic releases in the UK today, investors will look forward to global macroeconomic news for further direction.
The currency pair is showing convergence with its 20 Hr moving average and trading above its 50 Hr moving average.

Japan’s Machinery Orders Sharply Rebounded In July
For the 24 hours to 23:00 GMT, the USD declined 0.55% against the JPY and closed at 107.77 on Friday.
In the Asian session, at GMT0300, the pair is trading at 108.39, with the USD trading 0.58% higher against the USD from Friday's close.
Overnight data indicated that Japan's machinery orders rebounded by 8.0% MoM in July, surpassing market expectations for an advance of 4.2%. In the prior month, machinery orders had recorded a drop of 1.9%.
Earlier today, data revealed that the nation's tertiary industry index rebounded 0.1% in July, in line with market expectations. The index had dropped by a revised 0.2% in the previous month.
The pair is expected to find support at 107.62, and a fall through could take it to the next support level of 106.85. The pair is expected to find its first resistance at 108.86, and a rise through could take it to the next resistance level of 109.33.
Moving forward, traders will eye Japan's flash machine tool orders for August, scheduled to release in a while.
The currency pair is trading above its 20 Hr moving average and showing convergence with its 50 Hr moving average.

Switzerland’s Unemployment Rate Remained Steady In August
For the 24 hours to 23:00 GMT, the USD declined 0.55% against the CHF and closed at 0.9450 on Friday.
On the macro front, Switzerland's seasonally adjusted unemployment rate remained unchanged at 3.2% in August, meeting market expectations.
In the Asian session, at GMT0300, the pair is trading at 0.9490, with the USD trading 0.42% higher against the CHF from Friday's close.
The pair is expected to find support at 0.9439, and a fall through could take it to the next support level of 0.9387. The pair is expected to find its first resistance at 0.9524, and a rise through could take it to the next resistance level of 0.9557.
The currency pair is trading above its 20 Hr moving average and showing convergence with its 50 Hr moving average.
