
Sample Category Title
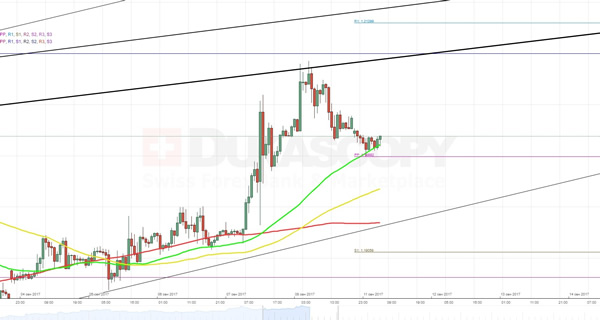
GBPUSD Analysis: Reaches Monthly R1 At 1.3208
Due to positive numbers that were revealed during a release on the UK Manufacturing Production, the Pound caught an upside momentum that helped it to reach the monthly R1 at 1.1320. However, this barrier appeared to be strong enough to prevent the further surge. Given that the southern direction is secured by the 55-hour SMA and the updated weekly PP at 1.3110 as well as the approaching 100- and 200-hour SMAs, an extensive drop is not expected to follow. In contrast, these indicators will motivate the pair to try break to the top. Except for the above monthly R1 the next closest resistance barrier is located only at 1.3310. Yet, these projections can be altered, as the Sterling is expected to be quite heavily affected by a number of data releases this week.
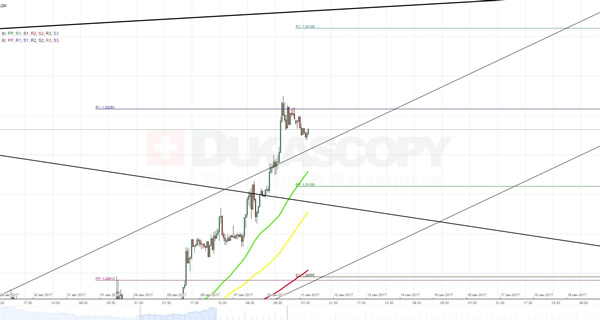
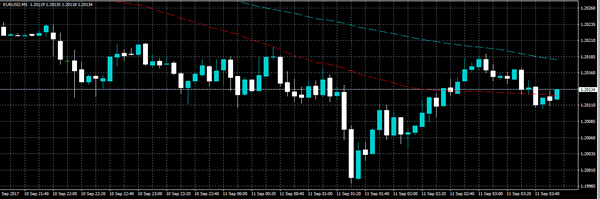
EURUSD Analysis: Slips To Weekly PP At 1.1999
On Friday, the currency exchange rate acted in accordance with one of the scenarios, which suggested that as soon as markets will calm down the buck is going to try restoring some lost positions. Indeed, after failing to jump above the monthly R1 at 1.2099 the pair switched a direction and ended the week near the combined support level set up by the 55-hour SMA and the updated weekly PP at 1.1999. It seems that the turnaround was partially attributed to clash with the upper boundary of a medium-term rising wedge, which can be clearly seen on a daily timeframe. From this larger perspective the rate is expected to continue to gradually slip to the bottom. However, in the short run these attempts most likely will be neutralized by the 100- and 200-hour SMAs.
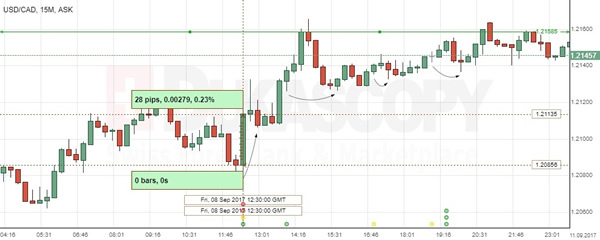
USD/CAD: Employment Change
Better-than-expected reports on the Canadian labour market contributed to slight increase in the USD/CAD exchange rate, though the pair remained near the lowest level in 28 months. The Greenback strengthened against the Canadian Dollar by 0.23% to start an upmove until the 1.2158 mark.
Statistic Canada showed on Friday that the country's unemployment rate dropped surprisingly to 6.2% in August, compared to the 6.3% reading in the prior month. The report also revealed that the Canadian economy added 22K jobs last month. Strong data fuelled expectations for the economy to expand further at a solid pace, underlined by the BoC unexpected decision to raise the key interest rate to 1.0%.
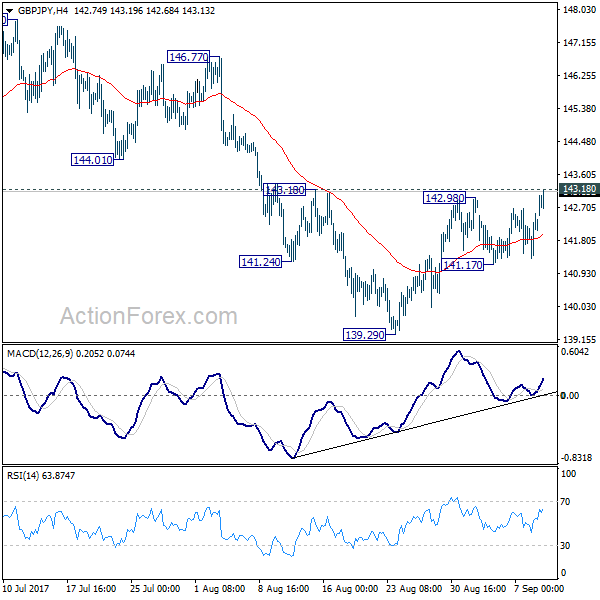
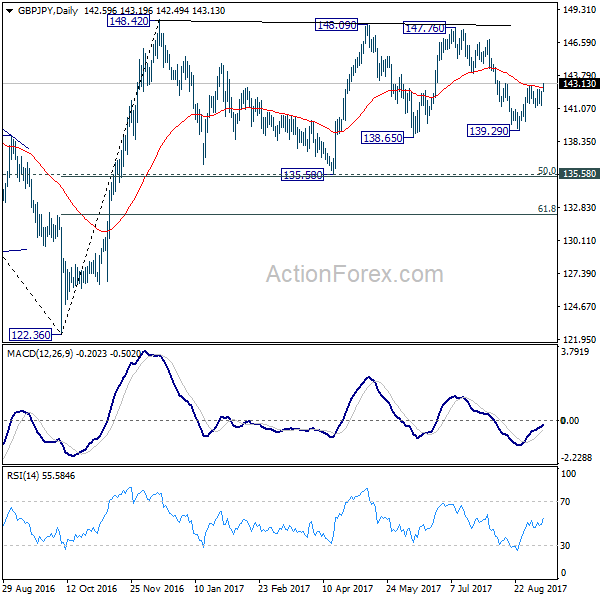
GBP/JPY Daily Outlook
Daily Pivots: (S1) 141.52; (P) 142.03; (R1) 142.73; More
GBP/JPY's rebound from 139.29 resumed today by breaking 142.98. Focus is now back on 143.18 resistance. Decisive break there will indicate short term reversal. That's fall from 147.76 has completed at 139.29. In that case, intraday bias will be turned back to the upside for retesting 147.76/148.42 resistance zone. Overall, price actions from 148.42 are seen as a sideway consolidation pattern. In case of another fall, downside should be contained by 135.58 cluster support to bring rebound.
In the bigger picture, the sideway pattern from 148.42 is still unfolding. In case of deeper fall, we'd expect strong support from 135.58 and 50% retracement of 122.36 to 148.42 at 135.39 to contain downside. Medium term rise from 122.36 is expected to resume later. And break of 38.2% retracement of 196.85 to 122.36 at 150.43 will carry long term bullish implications. However, firm break of 135.58/39 will dampen the bullish view and turn focus back to 122.36 low.
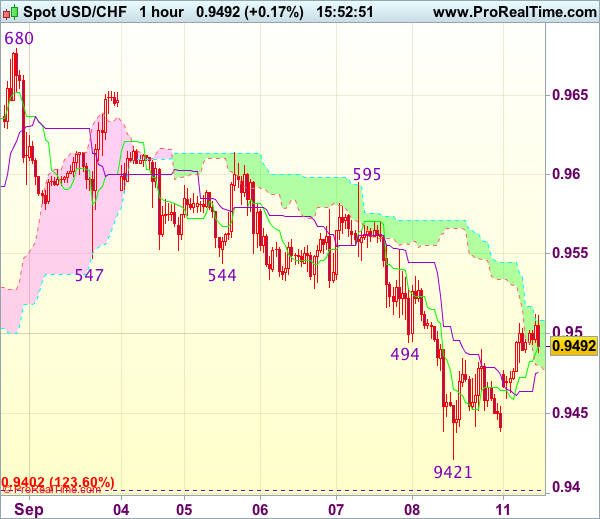
Trade Idea : USD/CHF – Hold long entered at 0.9450
USD/CHF - 0.9491
Most recent candlesticks pattern : N/A
Trend : Down
Tenkan-Sen level : 0.9494
Kijun-Sen level : 0.9476
Ichimoku cloud top : 0.9508
Ichimoku cloud bottom : 0.9479
Original strategy :
Bought at 0.9450, Target: 0.9550, Stop: 0.9415
Position : - Long at 0.9450
Target : - 0.9550
Stop : - 0.9415
New strategy :
Hold long entered at 0.9450, Target: 0.9550, Stop: 0.9420
Position : - Long at 0.9450
Target : - 0.9550
Stop : - 0.9420
As the greenback found support at 0.9439 and has rebounded, retaining our view that low is possibly formed at 0.9421 on Friday and consolidation with mild upside bias remains for retracement of recent decline, hence gain to 0.9520-30 would be seen, however, break of 0.9550-55 is needed to add credence to this view, bring a stronger rebound towards resistance at 0.9595 which is likely to hold from here.
In view of this, we are holding on to our long position entered at 0.9450. Below said support at 0.9421 would risk weakness to 0.9390-00, having said that, further sharp fall below 0.9370-75 should not be repeated and reckon 0.9350 would hold from here, bring rebound later.
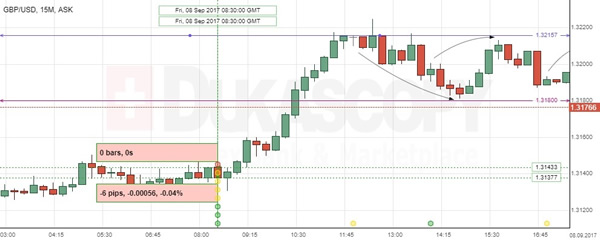
GBP/USD: Manufacturing Production
The GBP/USD currency pair showed modest reaction on the UK economic releases on Friday, as the reports revealed mixed results for July. However, a small impact from British macroeconomic data as well as the weakening US Dollar were not interfering the Sterling to extend gains by the mid-Friday session, where after post-data drop of 0.04% the British Pound rose to the highest level in five weeks to start trading in the 1.318-1.321 area.
The Office for National Statistics stated that the UK manufacturing output increased 0.5% over the month of July, showing the strongest gain this year. Coming along with weaker construction output, data suggested the UK economy to expand at a modest pace in the Q3.
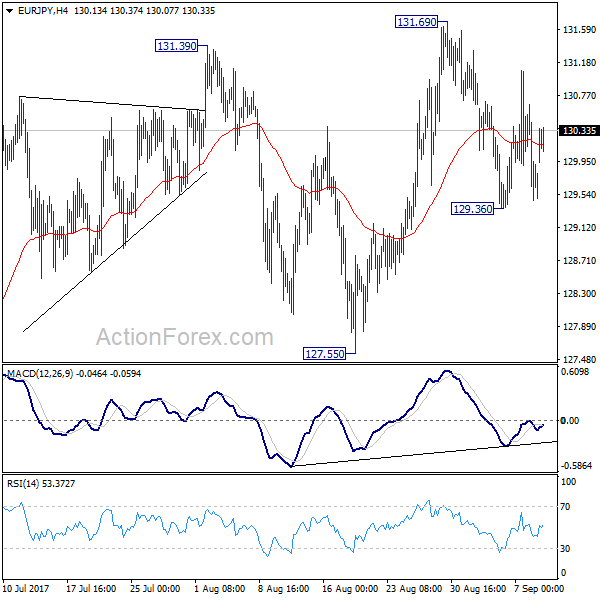
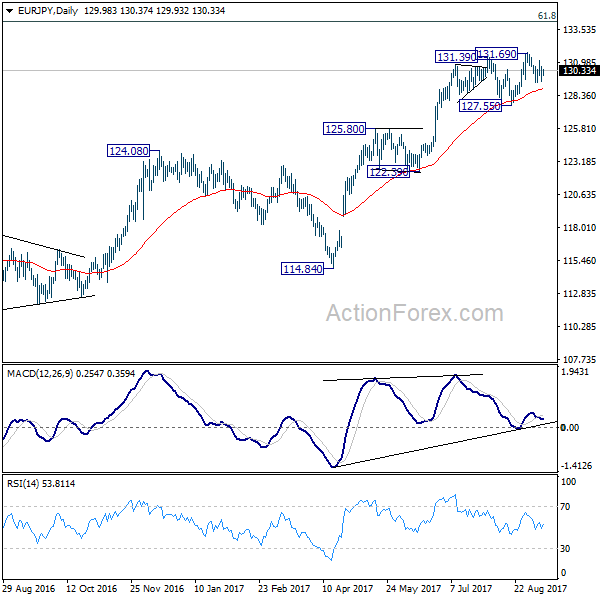
EUR/JPY Daily Outlook
Daily Pivots: (S1) 129.26; (P) 129.96; (R1) 130.45; More...
Intraday bias in EUR/JPY remains neutral for the moment. On the downside, break of 129.36 will turn bias to the downside for 127.55 support first. Firm break there will indicate near term reversal and deeper fall would be seen back to 122.39/125.80 support zone. In any case, we'd expect more corrective trading with risk of another fall, as long as 131.69 holds.
In the bigger picture, current rise from 109.03 is seen as at the same degree as the down trend from 149.76 (2014 high) to 109.03 (2016 low). as long as 124.08 resistance turned support holds, further rise is expected to 61.8% retracement of 149.76 to 109.03 at 134.20. Sustained break there will pave the way to key long term resistance zone at 141.04/149.76. However, firm break of 124.08 will argue that rise from 109.03 is completed and turn outlook bearish.
U.S. Dollar – Further Sell-Off, Or Set For A Rebound?
The dollar's weakness and a surge in safe havens were the central themes in the markets last week. The dollar index fell 1.4% in the past five trading days, taking the overall losses to 10.8% for the year so far. With market expectations of a U.S. rate hike in December falling below 40%, according to CME's FedWatch, it appears that investors believe the tightening course for 2017 is over. Even Bond markets are showing more pessimism, with U.S. 10-year treasury yields dropping to 2.02% on Friday; the lowest since Trump's election.
Despite the extension of the debt ceiling for three months and Fed officials being optimistic about the economy, the greenback still failed to rally. The resignation of the Fed Vice Chair, Stanley Fischer, is likely to be playing a significant role in keeping the dollar under pressure. His departure leaves four of the seven Board of Governors' seats vacant, meaning that Trump can reshape the Fed's policy, if he decided to bring more doves into the central bank. It's probably still too early to start speculating, and we will have to wait a little longer for clarity, when Trump nominates new governors. However, Fischer's resignation will remain a negative factor for the dollar in the weeks and months to come.
Hurricanes Harvey and Irma are now expected to cost the U.S. economy up to $290 billion, according to the latest estimates from AccuWeather. While natural disasters have an immediate negative impact on the economy and will be reflected in Q3 and Q4 GDP figures, the long run will see an uplift in growth due to spending on infrastructure and rebuilding; however, it's difficult to assess the exact short and longterm impact on U.S. growth.
North Korea's decision to hold a celebration instead of launching another nuclear bomb, helped risk assets and the dollar to recover slightly early Monday, with safe havens such as the gold, yen, and the Swiss franc feeling most of the pressure. Comments from North Korea's foreign ministry earlier today, stating that "the forthcoming measures to be taken by the DPRK, will cause the U.S. the greatest pain and suffering it had ever gone through in its entire history," were not taken seriously. However, tensions will likely escalate further, if the U.S. is successful in imposing new sanctions. That's why the gains in the U.S. dollar and fall in safe havens are likely to be limited.
On the U.S. data front, consumer prices and retail sales are of great importance, with the FOMC meeting to follow next week (20 September). Despite interest rates remaining unchanged, and the only new announcement likely to be the beginning of the balance sheet reduction, the CPI figures will shape the expectations for December's meeting. Rising gasoline prices will likely push headline inflation higher, from 1.7% to 1.8% YoY. However, core inflation should be given special attention, as any upside surprise will lift December's rate hike expectations above 50%, thus, providing the dollar short-term relief.
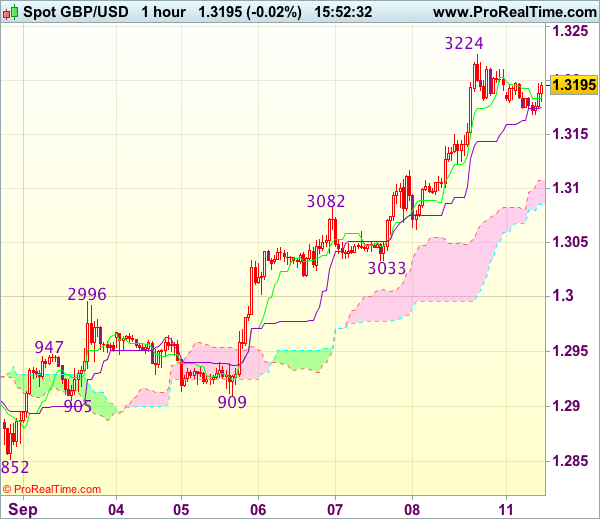
Trade Idea : GBP/USD – Buy at 1.3125
GBP/USD - 1.3188
Most recent candlesticks pattern : N/A
Trend : Near term up
Tenkan-Sen level : 1.3183
Kijun-Sen level : 1.3177
Ichimoku cloud top : 1.3107
Ichimoku cloud bottom : 1.3085
Original strategy :
Buy at 1.3125, Target: 1.3225, Stop: 1.3090
Position : -
Target : -
Stop : -
New strategy :
Buy at 1.3125, Target: 1.3225, Stop: 1.3090
Position : -
Target : -
Stop : -
Last week’s rally to 1.3224 adds credence to our bullish view that recent upmove from 1.2774 is still in progress and upside bias remains for further gain to 1.3225-30, then towards 1.3250, however, loss of near term upward momentum should prevent sharp move beyond latter level and price should falter below recent high at 1.3269, bring retreat later.
In view of this, would not chase this rise at current level and would be prudent to buy cable on subsequent pullback as 1.3120-25 should limit downside. Only below 1.3082 (previous resistance turned support) would abort ad suggest top is possibly formed, risk test of 1.3062 but reckon support at 1.3033 would hold.
EURO Tests 1.2000 Support
The euro has pulled back towards the key 1.2000 level against the U.S dollar, as the greenback opens the week on stronger footing. Price-action has so far moved to test the calculated weekly pivot point, located at the 1.1999 level.
Technical selling is also taking place in EURUSD, after the pair failed to close the week above the former yearly price high, found at the 1.2069 level.
A higher-time frame price close above the 1.2040 level should see a further attempt towards the 1.2092 level, whilst a higher time frame price close below the 1.1845 level should encourage selling towards 1.1665.
Key intraday support for the EURUSD pair is located at the weekly pivot point at 1.1999, the 100-hour moving average, at 1.1958, and the Thursday price low, located at 1.1914.
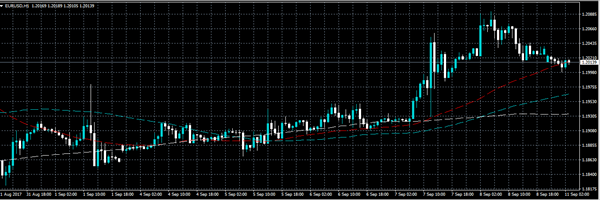
To the upside, key intraday resistance is located at 1.2030, 1.2040, and the former 2017 price high, at 1.2069. Above the 1.2092 level, euro buying should accelerate towards 1.2130 and 1.2160.