Sample Category Title
Forex Technical Analysis: EUR/USD, USD/JPY, GBP/USD
EUR/USD
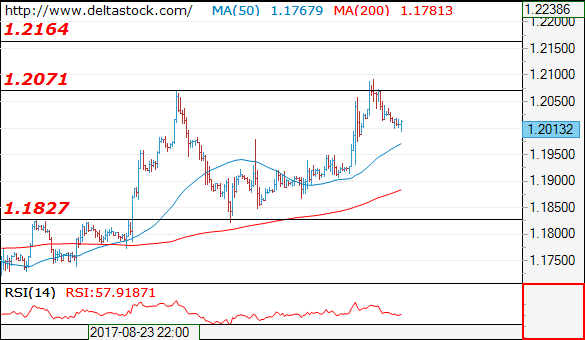
Current level - 1.2013
The bias remains positive above 1.1950, for a rise towards 1.2160 area. Crucial on the downside is 1.1830 static support.
| Resistance | Support | ||
| intraday | intraweek | intraday | intraweek |
| 1.2100 | 1.2160 | 1.1950 | 1.1830 |
| 1.2160 | 1.2500 | 1.1830 | 1.1660 |
USD/JPY
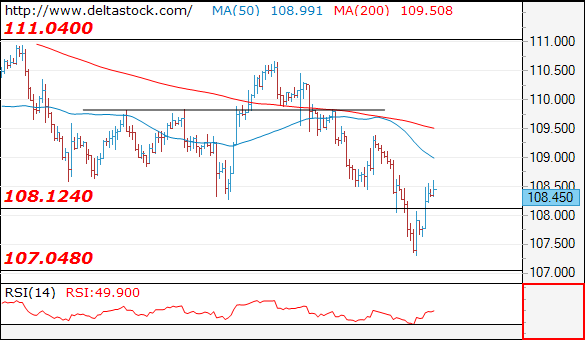
Current level - 108.45
The reversal at 107.30 is a finale of the slide from 110.70, but the there is a lack of information about directional change on the senior frames. Intraday resistance lies at 108.50, followed by 109.50. Crucial on the higher frames is 110.70.
| Resistance | Support | ||
| intraday | intraweek | intraday | intraweek |
| 108.50 | 110.60 | 108.00 | 107.30 |
| 109.50 | 112.20 | 107.30 | 105.50 |
GBP/USD
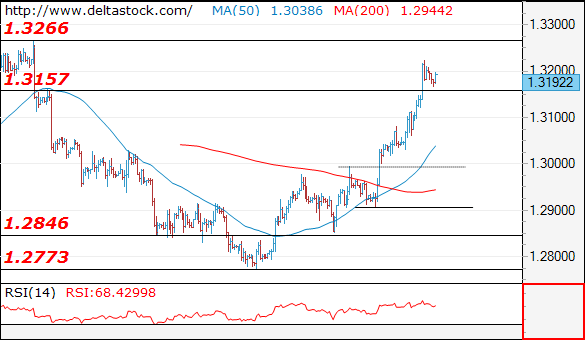
Current level - 1.3192
The bias is positive above 1.3157 support, for a test of 1.3270 peak. Crucial support lies at 1.3110.
| Resistance | Support | ||
| intraday | intraweek | intraday | intraweek |
| 1.3270 | 1.3270 | 1.3157 | 1.2990 |
| 1.3270 | 1.3500 | 1.3110 | 1.2770 |
EUR/USD Elliott Wave Analysis
EUR/USD – 1.2020
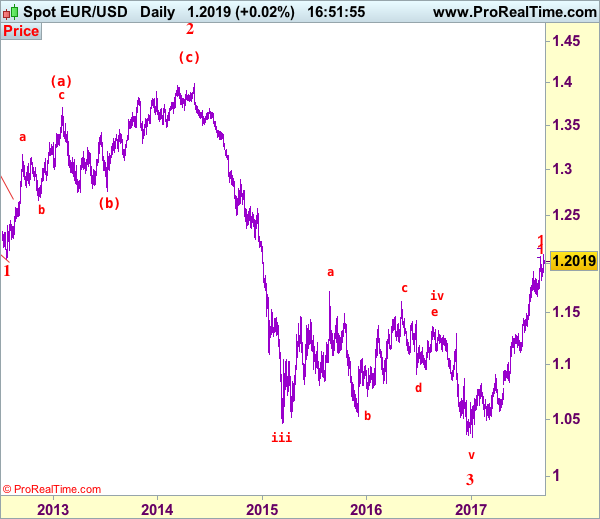
EUR/USD: Wave (c) of 2 ended at 1.3993 and wave 3 of III has commenced for weakness to 1.0411 (1.236 of wave 1), then 1.0000.
Although the single currency did resume recent upmove after finding support at 1.1823 late last month and gain towards 1.2090-00 cannot be rule out, loss of upward momentum should prevent sharp move beyond 1.2150-55 (61.8% projection of 1.1119-1.1910 measuring from 1.1662) and price should falter below 1.2200-10, risk from there remains for a much-needed correction to take place later this month.
Our preferred count on the daily chart remains that a wave (II) from 1.2329 ended at 1.5145 with A-leg ended at 1.4720, followed by wave B at 1.2457, the wave C from there was also a 3 legged move and is labeled as (a): 1.3739, (b): 1.2885, the wave iii of the 5-waver (c) from 1.2885 has ended at 1.4339 and wave iv is a triangle ended at 1.3878 and wave v formed a top at 1.5145. The decline from there is a 5-waver (C) with minor wave (i) of I of (C) ended at 1.4218 with wave (ii) ended at 1.4580, wave (iii) ended at 1.3267 and wave (iv) ended at 1.3692 and wave (v) ended at 1.1876, this is also the low of wave I of (C) and wave II ended at 1.4940, hence wave III is now in progress with a diagonal wave 1 ended at 1.2042, the breach of previous support at 1.1876 (wave I trough) adds credence to our view that the wave 2 has ended at 1.3993, wave 3 has commenced for further weakness to 1.0411, then towards 1.0000.
On the downside, whilst pullback to 1.1980-90 cannot be ruled out, reckon 1.1900-05 would limit downside and bring another rise. Below 1.1865-70 would suggest top is possibly formed, bring test of said support at 1.1823 but only a daily close below this level would add credence to this view, bring retracement of recent upmove to 1.1770, then 1.1740 but price should stay well above previous support at 1.1662 and the single currency shall head north again from there.
Recommendation: Stand aside for this week.
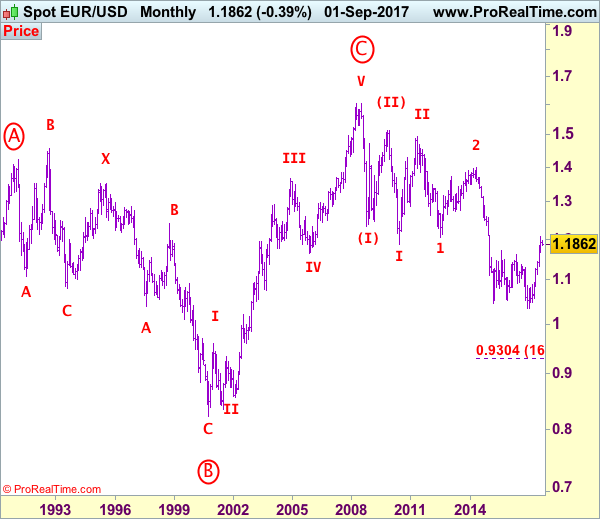
Euro's long-term uptrend started from 0.8228 (26 Oct 2000) with an impulsive structure. The rise from 0.8228 to 0.9593 (5 Jan 2001) is labeled as wave I, the retreat to 0.8352 (6 Jul 2001) is wave II and the rally to 1.3670 (31 Dec 2004) is wave III. Wave IV from there ended at 1.1640 (15 Nov 2005), the subsequent upmove to 1.6040 (July 15, 2008) is treated as wave V, the major selloff from the record high of 1.6040 to 1.2329 (October 27, 2008) signals a reversal has taken place with (I) leg ended at 1.2329 and once (II) ended at 1.5145, wave (III) itself is an extended move with I: 1.1876 and complex wave II ended at 1.4902, wave III has commenced with wave 1 and 2 ended at 1.2042 and 1.3993 respectively, wave 3 of III is now unfolding for weakness towards parity.
Currencies: Dollar Sell-Off To Ease?
Sunrise Market Commentary
- Rates: Risk sentiment takes turn for the better, weighing on core bonds
Risk sentiment improved this morning as a worst case scenario was avoided for several events (North Korea, Hurricanes). The US Note future opened significantly lower, Asian stock markets gain around 1.5% and the dollar stages a cautious comeback. Today's empty eco calendar suggests that global risk sentiment will dominate trading. - Currencies: Dollar sell-off to ease?
Investors adapted positions for all kinds of event risk at the end of last week, weighing on US bond yields and on the dollar. The pressure is slightly easing as sentiment turned risk on in Asia this morning. The dollar might look for a bottom in a session deprived of key eco data.
The Sunrise Headlines
- US equities ended last week nearly unchanged with Nasdaq underperforming (-0.5%). Risk sentiment took a turn for the better overnight as North Korea didn't launch a missile on its founding day and as Irma's force degenerated.
- Hurricane Irma smashed into Florida, leaving more than 3m properties without power. On Sunday afternoon Irma was downgraded from a Category 4 storm to Category 2.
- US officials are pushing the UN Security Council to ban North Korea textile exports, embargo oil sales to the country and prohibit it from renting out its workers abroad.
- The IMF should decide whether it will fund Greece's current bailout programme by the end of the year and help Greece conclude a key bailout review on time, PM Tsipras said.
- Chinese authorities plan to shut down domestic bitcoin exchanges, delivering a final blow to a once-thriving industry of commercial trading for virtual currencies, which took off inside the mainland four years ago.
- NY Fed Dudley said that balance sheet reduction would commence "relatively soon". The next interest rate hike was more uncertain now due soft inflation that is proving less transitory than they originally thought, plus external global factors that are causing risk aversion.
- Today's calendar is empty. The US Treasury starts its mid-month refinancing operation with a $24B 3-yr Note auction. ECB Coeure speaks on monetary policy in non-standard times.
Currencies: Dollar Sell-Off To Ease?
USD sell-off eases
FX markets searched for the right strategy to avoid event risk this weekend or in the near future (storms, North Korea). The dollar was most sensitive of the major currencies. EUR/USD set a new correction high in the high 1.20 area early in the session. The rally stalled later, but there was no sign of any meaningful correction. EUR/USD closed the session at 1.2036. USD/JPY remained below the key 108.13 area and finished at 107.84.
Risk sentiment on Asian equity markets is clearly positive this morning. The damage of Hurricane Irma is very substantial, but markets apparently assume that the impact on the US economy is manageable. The tensions between the US and North Korea remain in the headlines as the US called for a new UN vote on tougher sanctions against North Korea. It is not clear whether this resolution will pass. US bond yields opened higher this morning easing some pressure on the dollar after last week's sell-off. USD/JPY returned north of 108 (currently 108.35). The gains of the dollar against the euro are more modest. EUR/USD trades in the low 1.20 area. The yuan declined this morning after Chinese policymakers removed a cash requirement on forward buying of USD. The move might be an attempt to prevent further yuan gains.
The US eco calendar is empty and the EMU one contains only the BdF industrial sentiment survey for August and Italian production for July. None of these will affect markets. Following some leaks about the discussions inside the ECB last Thursday, we will closely listen to the speech of ECB Executive Board member Coeuré at an ECB workshop (Monetary Policy in non-standard times). The euro could get some support if he indicates that the debate on ECB tapering is already quite well in progress. However, global risk sentiment will probably dominate USD trading. At the end of last week, markets were positioned for a very negative scenario on hurricane Irma and North Korea. Both issues are still developing. Hurricane Irma eases, but its impact on the US economy is still highly uncertain. It is also unclear whether the US's proposal to the UN on North Korean sanctions will be accepted. If China or Russian vetoes the bill, it might prevent further action from North Korea short term. This would be a defeat for the US, but it might temporary ease tensions. Maybe it can be a slight USD supportive
Global context. Last week, the ECB delayed the communication on APP tapering till October and Draghi kept a soft tone. However, the euro remained strong. Markets apparently take the view that ECB policy normalisation will come anyway. At the same time, the dollar continued to lose interest rate support as global uncertainty kept US yields on a downward trajectory. The decline in US yields and of the dollar has probably gone far enough given recent US eco data, which were still fairly good. However, until now this assessment didn't help the dollar short-term. The dollar in the first place needs an improvement in global sentiment and higher yields. US data will probably become noisy due to the impact of the hurricanes. This might cloud the outlook on the Fed strategy and might complicate a sustained USD rebound.
Sentiment on the dollar remains fragile and this is visible in the technical picture of both EUR/USD and USD/JPY. EUR/USD last week set a minor new correction top at 1.2092. A return below 1.1823 would be a technical sign that the EUR/USD rally has run its course short-term. We are not that far yet. USD/JPY tries to regain the previous range bottom at 118.13, but for now, the downtrend remains also intact. So, more confirmation is needed to conclude that the dollar is bottoming.
EUR/USD holds near cycle top. Rally to slow?
EUR/GBP
Sterling rebound continues
There were again plenty of headlines on the stalemate in the Brexit-negotiations last Friday while the UK eco data calendar was well filled. However, those topics played no important role in sterling trading. The rise of the euro took a breather early in Europe and sterling gained momentum against the single currency. UK data were OK, but had little impact on trading. Sterling momentum improved further later in the session. Sterling evidently extended gains against a bleeding dollar, but EUR/GBP resisted the overall strong bid in the euro. EUR/GBP closed the session at 0.9119. Sterling showed remarkable resilience.
The Brexit debate will again dominate the headlines. Today, the UK government tries to find a majority for its Brexit bill that will allow the government to copy EU law into UK law. A positive vote might be a slightly positive for sterling. Even so, last week's price action suggests that sterling is gaining some momentum anyway. This correction might continue as investors further reduce sterling shorts after the Summer sell-off.
From a technical point of view, EUR/GBP cleared 0.8854/80 resistance (top end June), opening the way for further gains. The move was the result of euro strength. Simultaneously, UK price data were soft enough to keep the BoE sidelined. MT, we maintain a buy EUR/GBP on dips approach as we expect the combination of relative euro strength and sterling softness to persist. The 0.9415 ‘flash-crash spike' is the next target on the charts. However, we wait for a correction, e.g. to the technical support in the 0.88/89 area, to sell sterling again versus the euro.
EUR/GBP sterling rebound continues
USD/JPY Elliott Wave Analysis
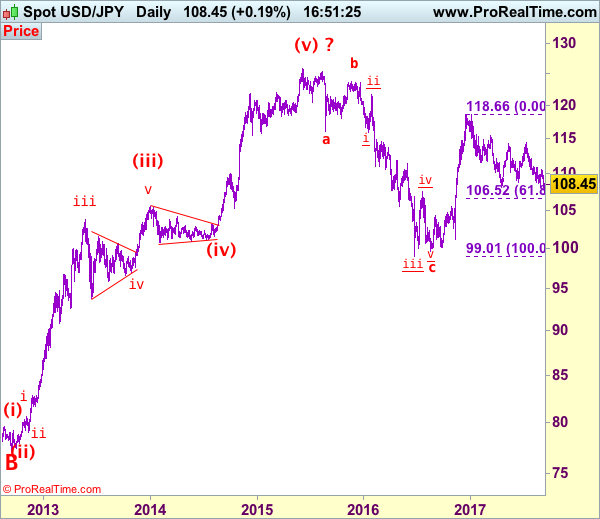
USD/JPY - 108.45
USD/JPY – Wave V of larger degree circle V has possibly ended at 75.31 and major correction has commenced and already met indicated target at 125.00.
Although last week’s breach of support at 108.13 (this year’s low) confirms early decline from 118.66 top has resumed, lack of follow through selling on break of said support and current rebound from 107.32 suggest consolidation above this level would be seen and recovery to 109.00, then 109.40 cannot be ruled out, however, reckon upside would be limited to 110.00 and renewed selling interest should emerge below resistance at 110.67, bring another selloff later this month.
Our preferred count is that, triangle wave IV (with circle) ended at 101.45 and the circle wave V brought dollar down to the record low of 75.31 in 2011 and the subsequent rebound signal major correction has commenced with A leg ended at 84.19, followed by wave B at 77.14 and impulsive wave C is now unfolding (indicated upside target at 125.00 had been met) for gain towards 127.00 level. In the event dollar drops below support at 99.01, this would confirm medium term decline from 125.86 top (2015 high) has resumed for subsequent weakness to 98.00 and possibly 97.00.
Under this count, this wave C is unfolding as impulsive waves with (1) (2), 1 2 ended at 80.67, 79.07, 82.84 and 81.69 respectively, hence the extended wave 3 has ended at 103.74 and wave 4 correction of recent upmove should bring weakness to 92.57, then towards 90.88 but psychological support at 90.00 should limit downside and bring another rally later in wave 5, indicated target at 125.00 had been met and gain to 127.00 cannot be ruled out but reckon price would falter below 130.00.
On the downside, whilst pullback to 107.90.00 cannot be ruled out, reckon downside would be limited to said support at 107.32 and bring another rebound later. A break below said support at 107.32 would signal the aforesaid decline from 118.66 top is still in progress and may extend weakness to 107.00, having said that, reckon 106.50-55 (61.8% Fibonacci retracement of 99.01-118.66) would limit downside and price should stay above 105.00 psychological level.
Recommendation: Stand aside for this week.
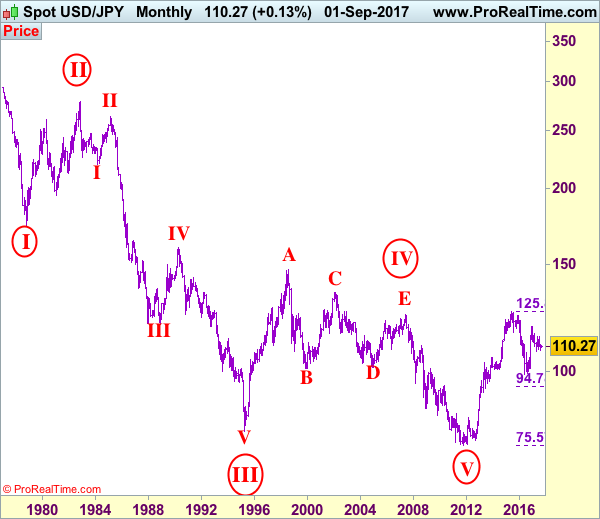
On the monthly chart, we have changed our preferred count that an impulsive wave is unfolding with major wave III with circle ended at 79.75, then followed by wave IV with circle and is labeled as a triangle with A: 147.64 (11 August, 1998), B: 101.25, C: 135.20, D: 101.67 and E leg ended at 124.14 to end the wave IV with circle. Hence, wave V with circle commenced from there and hit a record low of 75.31, however, the subsequent strong rebound signals this circle wave V has possibly ended there, hence gain to (indicated upside target at 122.00 and 125.00 had been met), the retreat from 125.86 suggests wave A of major correction has ended there and wave B correction back to 99.00, then 95.00 would be seen, however, reckon downside would be limited to 90.00, bring another rebound in wave C next year.
Trade Idea: GBP/USD – Buy at 1.3125
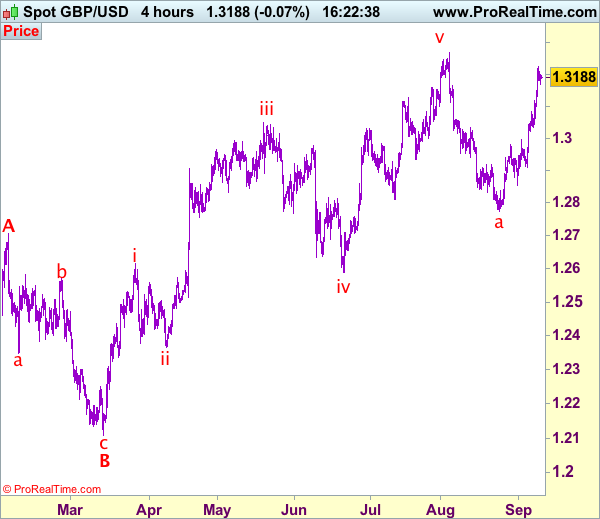
GBP/USD – 1.3127
Original strategy :
Buy at 1.3040, Target:1.3200, Stop: 1.2980
Position: -
Target: -
Stop: -
New strategy :
Buy at 1.3125, Target:1.3300, Stop: 1.3065
Position: -
Target: -
Stop:-
As cable has maintained a firm undertone after last week’s rally, suggesting bullishness remains for the rise from 1.2774 to extend gain towards recent high at 1.3269, however, break there is needed to retain upside bias and signal recent upmove has resumed for headway to 1.3300-10, having said that, overbought condition should prevent sharp move beyond 1.3340-50 and price should falter well below 1.3390-00, bring retreat later.
In view of this, would not chase this rise here and would be prudent to buy sterling on subsequent pullback as 1.3120-25 should limit downside. Below previous resistance at 1.3080-85 would defer and risk test of 1.3030-33 support, however, only break of latter level would signal a temporary top is formed, brig correction to 1.2990-00 first.
Our preferred count on the daily chart is that cable's rebound from 1.3500 (wave (A) trough) is unfolding as a wave (B) with A ended at 1.7043, followed by triangle wave B and wave C as well as wave (B) has ended at 1.7192, the subsequent selloff is the larger degree wave (C) which is still unfolding with minor wave (III) of larger degree wave 3 ended at 1.1986, hence wave (IV) correction is in progress which could either be a triangle wave (IV) of a complex formation but upside should be limited to 1.3500 and price should falter well below 1.4000, bring another decline in wave (V) of 3 for weakness to 1.1500, then 1.1200.
Euro Remains In Crucial Uptrend Vs US Dollar
Key Highlights
- The Euro climbed to 1.2092 this past week against the US Dollar before starting a correction.
- There is a crucial bullish trend line with support at 1.1960 forming on the 4-hours chart of EUR/USD.
- China's Consumer Price Index increased 0.4% in August 2017 (MoM), more than the forecast of +0.3%.
- China's Producer Price Index increased 6.3% in August 2017 (YoY), more than the forecast of +5.6%.
EURUSD Technical Analysis
The Euro is in a major uptrend and recently traded to a yearly high at 1.2092 against the US Dollar. Dips in EUR/USD are likely to find support near 1.1980 and 1.1960 in the near term.
After trading as high as 1.2092, the pair started a short-term correction. Looking at the 4-hours chart of EUR/USD, there is a crucial bullish trend line forming with support at 1.1960.
The pair has moved below the 23.6% Fib retracement level of the last wave from the 1.1823 low to 1.2092 high. However, there are many supports such as 1.1989, 1.1980 and 1.1960 waiting on the downside to stop further declines.
The most important support is around the 50% Fib retracement level of the last wave from the 1.1823 low to 1.2092 high at 1.1957. On the upside, the 1.2040 is an initial resistance, followed by 1.2100.
China's Consumer Price Index
Recently, the Chinese Consumer Price Index for August 2017 was released by the National Bureau of Statistics of China. The market was looking for an increase of 0.3% in the CPI compared with the previous month.
However, the actual result was better than the forecast, as there was a rise of 0.4% in the CPI (MoM). Looking at the yearly change in the CPI, the market was poised for an increase of 1.6%, more than the last +1.4%.
Again, the result was positive, as the yearly change in the CPI was +1.8%. Similarly, the Producer Price Index was forecasted to increase by 5.6% in August 2017 compared with the same month a year ago. The actual was better, as there was a rise of 6.3% in the PPI, more than the last +5.5%.
The overall result was positive for the risk sentiment, and dips in EUR/USD towards 1.1980-60 remains supported.
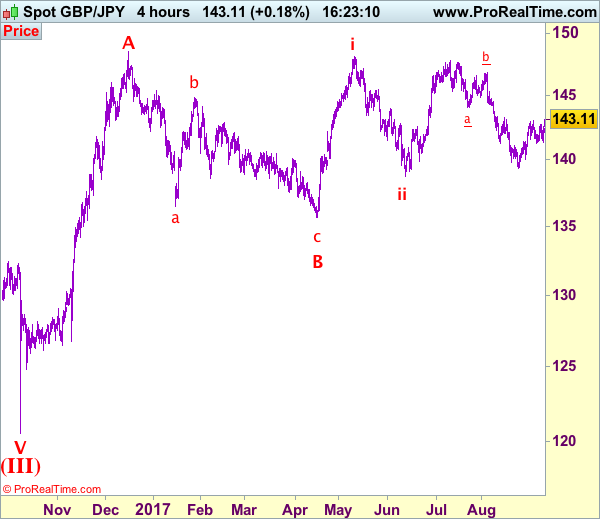
Trade Idea: GBP/JPY – Buy at 142.45
GBP/JPY - 143.10
New strategy :
Buy at 142.45, Target: 144.45, Stop: 141.85
Position: -
Target: -
Stop:-
As sterling opened higher today and broke above previous resistance at 143.00, signaling the rise from 139.35 has resumed and may extend further gain to 143.30-35, break there would encourage for at least a strong retracement of recent decline from 147.75 to 144.00, then 144.45-50, however, near term overbought condition should prevent sharp move beyond 145.00-10 and resistance at 145.30 should remain intact.
In view of this, we are looking to buy sterling on pullback as 142.40-45 should limit downside. Below 142.00 would defer and risk test of 141.80 but only break of 141.30-35 would signal top is formed, bring test of previous support at 141.20 and later towards 140.60-70, however, 140.40 should hold from here.
Our preferred count is that larger degree wave V with circle is unfolding from 251.12 with wave (I) 219.34, (II): 241.38 and wave (III) is subdivided into 1: 192.60, 2: 215.89 (23 Jul 2008) and wave 3 ended at 118.87 earlier in 2009. The correction from there to 162.60 is wave 4 which itself is a double three and is labeled as first a-b-c ended at 151.53, followed by wave x at 139.03, 2nd a ended at 162.60, 2nd b at 146.75 and 2nd c leg of wave 4 ended at 163.00. Therefore, the decline from 163.00 to 116.85 is now treated as wave 5 which also marked the end of larger degree wave (III), hence wave (IV) major correction has commenced for retracement of the wave (III) from 241.38 and upside target at 183.95-00 (50% Fibonacci retracement of the wave (II) from 241.38) had been met, a drop below 160.00 would suggest wave (IV) has ended at 195.85, bring decline in wave (V) for initial weakness to 130 (already met) and 120.
Daily Technical Analysis: EUR/USD Technical Uptrend While Above 1.1945
The EUR/USD retraced from its highs on Friday and currently it is retracing towards the POC zone. The POC (D L4, W L3, EMA89, ATR Pivot, Bullish order block, 61.8) is 1.1970-1.1985 and we could see a bounce. Historical buyers should align with now moment buyers within the zone and the target is 1.2046-1.2068. Only a breakout and/or 4h close above 1.2070 should rally the price towards 1.2103 and 1.2157. Bears could gain the upper hand below 1.1945 and if the price gets below the target is 1.1910.
W L3 - Weekly Camarilla Pivot (Weekly Interim Support)
W H3 - Weekly Camarilla Pivot (Weekly Interim Resistance)
W H4 - Weekly Camarilla Pivot (Strong Weekly Resistance)
D H4 - Daily Camarilla Pivot (Very Strong Daily Resistance)
D L3 – Daily Camarilla Pivot (Daily Support)
D L4 – Daily H4 Camarilla (Very Strong Daily Support)
POC - Point Of Confluence (The zone where we expect price to react aka entry zone)
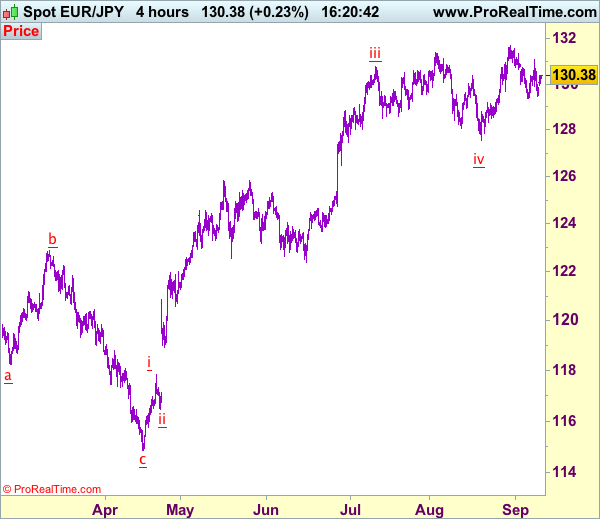
Trade Idea: EUR/JPY – Hold short entered at 130.20
EUR/JPY - 130.44
Original strategy:
Sold at 130.20, Target: 128.20, Stop: 130.80
Position: - Short at 130.20
Target: - 128.20
Stop: - 130.80
New strategy :
Hold short entered at 130.20, Target: 128.20, Stop: 130.80
Position: - Short at 130.20
Target: - 128.20
Stop:- 130.80
Although the single currency opened higher today and has rebounded, as long as resistance at 130.67 holds, mild downside bias remains for another retreat, below 129.80-85 would suggest the rebound from 129.46 has ended, bring another fall to 129.37 support, break there would signal another leg of decline from 131.71 top is underway for retracement of recent rise to 129.10-15, then towards 128.70-75 but support at 128.49 should remain intact.
In view of this, we are holding on to our short position entered at 130.20. Above 130.65-70 would risk another test of said resistance at 131.09, however, only break there would suggest the retreat from 131.71 has possibly ended, then gain to 131.35 would follow, above there would confirm and a retest of said recent high at 131.71 would follow.
Our latest preferred count is that wave (ii) is ABC-X-ABC which ended at 123.33 and wave (iii) is unfolding with wave iii ended at 100.77, followed by wave iv at 111.57 and wave v as well as the wave (iii) has ended at 97.04, followed by wave (iv) at 111.43 and wave (v) has ended at 94.12 which is also the end of the larger degree v, this also implied the major wave (C) has also ended there, hence major correction has commenced from there with (A) leg unfolding in its lower degree wave c which has possibly ended at 145.69. Under this count, A-B-C wave (B) has commenced with A leg ended at 136.23, wave B at 143.79 and wave C has possibly ended at 149.79.
Our larger degree count is that the decline from 139.26 is wave (C) and is sub-divided into a diagonal triangle i-ii-iii-iv-v with wave i - 105.44, wave ii- 123.33, wave iii - 97.03, wave iv - 111.43, followed by the final wave v as well as the end of wave (C) at 94.12, this also mark the bottom of larger degree wave B. Under this count, major rise in wave C has commenced as an impulsive wave with minor wave III ended at 145.69, wave V is still in progress for further gain to 150.00. Having said that, this so-called wave V could well be the first leg of larger degree 5-waver wave C and this wave C should bring at least a retest of wave A top at 169.97 (July 2008).
Gold Holds Bullish Structure But Shifts To Neutral Phase As Uptrend Stalls
Gold peaked at 1357.47 last Friday before retreating. Short-term momentum, as measured by RSI, reached overbought levels above 70 last week, with gold subsequently slipping below 1340 support today.
On the 4-hour chart, RSI has dipped below 50. While this is a bearish signal, the possibility of further upside in gold cannot be ruled out yet. The stochastic fell from 80 to below 20, indicating the market is oversold now. A consolidation phase for gold is expected in the near term.
In the short term, range trading is expected between 1330 and 1340. Continued weakness below the 20-period moving average could see prices head lower. But as long as support at 1330 holds strong, a neutral bias seems the most likely prospect for now.
A break below the 50-period SMA at 1330 would shift the focus towards the key psychological level at 1300. From here, there is scope to slip down to 1280 and 1255.
A successful break above 1340 would increase the prospects for a move higher to re-test the 1357.47 peak. Clearing this top would see the bull trend continue with scope for extending towards the next major peaks at 1367.23 and 1375.13.
For now, momentum is weak, suggesting little impetus for a break out of the range between 1330 and 1340. The short-term picture is neutral to bullish. There are no clear signals for a reversal in the uptrend as the moving averages are positively aligned. A fall below 1280 would change the short-term bullish picture.