Sample Category Title
Trade Idea: AUD/USD – Exit long entered at 0.8050
AUD/USD – 0.8050
Original strategy:
Bought at 0.8050, Target: 0.8200, Stop: 0.7990
Position: - Long at 0.8050
Target: - 0.8200
Stop:- 0.7990
New strategy :
Exit long entered at 0.8050,
Position: - Long at 0.8050
Target: -
Stop:-
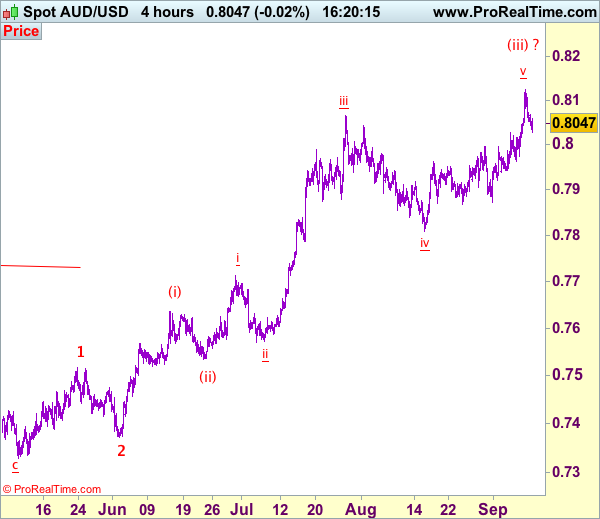
As aussie has retreated quite sharply after rising to 0.8125 on Friday, suggesting a minor top has possibly been formed there and consolidation with mild downside bias is seen and weakness to 0.8000 cannot be ruled out, however, only break of support at 0.7963 would add credence to this view, bring retracement of recent rise to 0.7920-25 but support at 0.7867-71 should remain intact.
In view of this, would be prudent to exit long entered at 0.8050 and stand aside for now. Above 0.8100 would bring retest of said last week’s high at 0.8125, break there would extend recent upmove in wave v of (iii) to 0.8150, then towards 0.8200, however, loss of upward momentum should prevent sharp move beyond 0.8225-30 and price should falter below 0.8250-60, risk from there is seen for a retreat later.
On the 4-hour chart, the move from 0.8066 is the wave 5 with i: 0.8860, ii: 0.8315, wave iii is an extended move ended at 1.0183, iv: 0.9706 and wave v has ended at 1.1081 (also the top of entire wave 5). The subsequent selloff is the major correction which is unfolding as ABC-X-ABC and 2nd A leg has ended at 0.8848, followed by a-b-c wave B which ended at 0.9758, hence, 2nd C wave is now in progress and indicated downside target at 0.7000 and 0.6950 had been met, so further fall to 0.6710-20 cannot be ruled out.
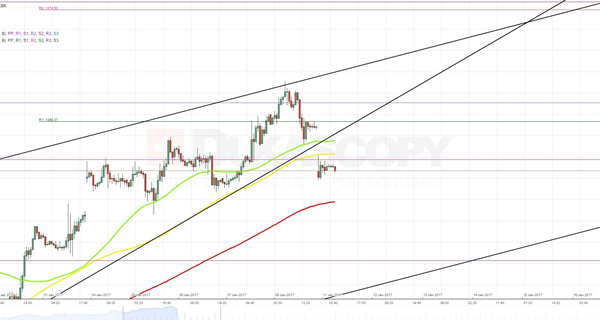
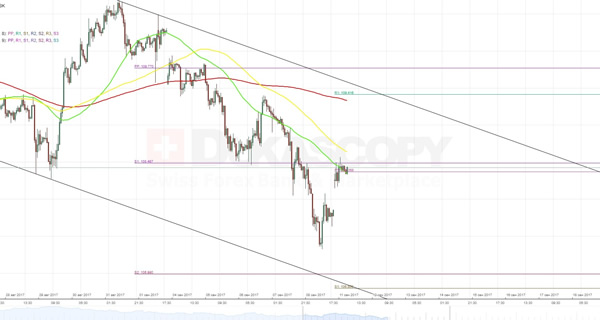
XAUUSD Analysis: Falls Below 1,340.60
The way the exchange rate started new trading week confirmed that previously it was moving in a medium-term rising wedge. Generally, the pair is expected to gradually move to the bottom, trying to reach the lower trend-line of a senior ascending channel. However, in order to do that the rate will have to cross a combined support level formed by the updated weekly S1 at 1,329.68 and the 200- hour SMA. Even though it sounds like a too strong barrier, the path to the north is also well secured. Namely, it consists of the 55- and 100-hour SMAs as well as the weekly PP at 1,343.70. By the way, the bearish scenario is also confirmed on a daily scale, as last Friday the gold made a rebound from an upper trend-line of a longterm ascending channel.
USDJPY Analysis: Encounters Combined Resistance
As it was expected, the new trading week the Greenback started in a recovery against the Yen. A breakout near the 107.40 mark suggests that the pair is moving in a new junior descending channel. If this assumption is correct, the buck is expected to try to surge towards the monthly PP at 109.76. Yet this target might not be reached from the first attempt, as road to the north is obstructed by a combined resistance level that consists of the weekly PP, the monthly S1 as well as the 55- and 100-hour SMAs. From a daily perspective, this barrier also seems too strong to be crossed. In other words, a new descending channel on a larger timeframe points out that the fourth rebound is expected to follow.
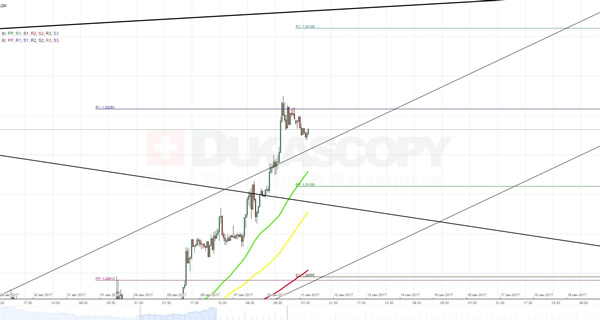
GBPUSD Analysis: Reaches Monthly R1 At 1.3208
Due to positive numbers that were revealed during a release on the UK Manufacturing Production, the Pound caught an upside momentum that helped it to reach the monthly R1 at 1.1320. However, this barrier appeared to be strong enough to prevent the further surge. Given that the southern direction is secured by the 55-hour SMA and the updated weekly PP at 1.3110 as well as the approaching 100- and 200-hour SMAs, an extensive drop is not expected to follow. In contrast, these indicators will motivate the pair to try break to the top. Except for the above monthly R1 the next closest resistance barrier is located only at 1.3310. Yet, these projections can be altered, as the Sterling is expected to be quite heavily affected by a number of data releases this week.
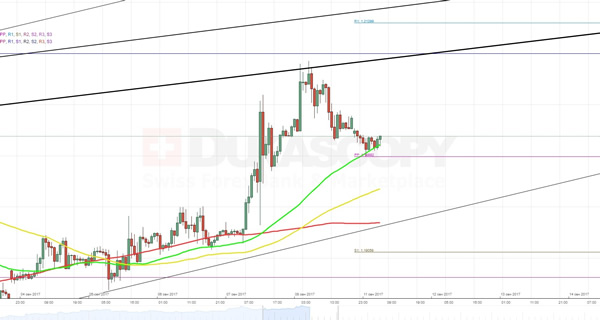
EURUSD Analysis: Slips To Weekly PP At 1.1999
On Friday, the currency exchange rate acted in accordance with one of the scenarios, which suggested that as soon as markets will calm down the buck is going to try restoring some lost positions. Indeed, after failing to jump above the monthly R1 at 1.2099 the pair switched a direction and ended the week near the combined support level set up by the 55-hour SMA and the updated weekly PP at 1.1999. It seems that the turnaround was partially attributed to clash with the upper boundary of a medium-term rising wedge, which can be clearly seen on a daily timeframe. From this larger perspective the rate is expected to continue to gradually slip to the bottom. However, in the short run these attempts most likely will be neutralized by the 100- and 200-hour SMAs.
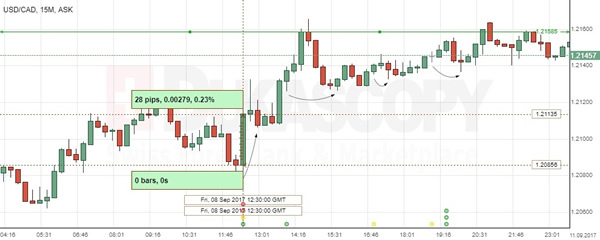
USD/CAD: Employment Change
Better-than-expected reports on the Canadian labour market contributed to slight increase in the USD/CAD exchange rate, though the pair remained near the lowest level in 28 months. The Greenback strengthened against the Canadian Dollar by 0.23% to start an upmove until the 1.2158 mark.
Statistic Canada showed on Friday that the country's unemployment rate dropped surprisingly to 6.2% in August, compared to the 6.3% reading in the prior month. The report also revealed that the Canadian economy added 22K jobs last month. Strong data fuelled expectations for the economy to expand further at a solid pace, underlined by the BoC unexpected decision to raise the key interest rate to 1.0%.
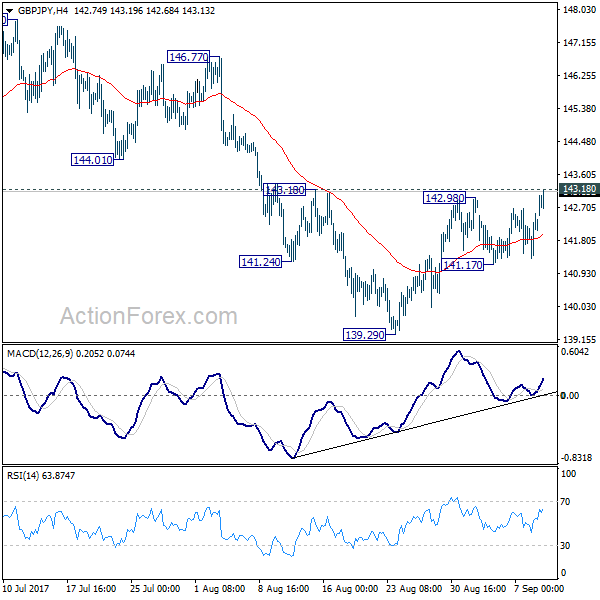
GBP/JPY Daily Outlook
Daily Pivots: (S1) 141.52; (P) 142.03; (R1) 142.73; More
GBP/JPY's rebound from 139.29 resumed today by breaking 142.98. Focus is now back on 143.18 resistance. Decisive break there will indicate short term reversal. That's fall from 147.76 has completed at 139.29. In that case, intraday bias will be turned back to the upside for retesting 147.76/148.42 resistance zone. Overall, price actions from 148.42 are seen as a sideway consolidation pattern. In case of another fall, downside should be contained by 135.58 cluster support to bring rebound.
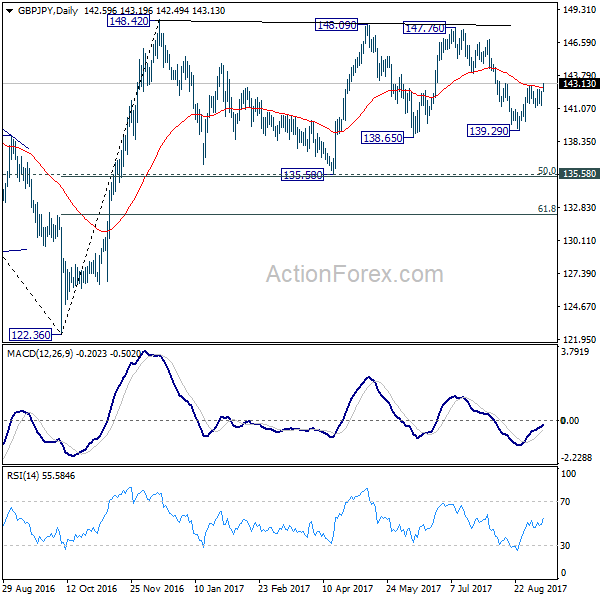
In the bigger picture, the sideway pattern from 148.42 is still unfolding. In case of deeper fall, we'd expect strong support from 135.58 and 50% retracement of 122.36 to 148.42 at 135.39 to contain downside. Medium term rise from 122.36 is expected to resume later. And break of 38.2% retracement of 196.85 to 122.36 at 150.43 will carry long term bullish implications. However, firm break of 135.58/39 will dampen the bullish view and turn focus back to 122.36 low.
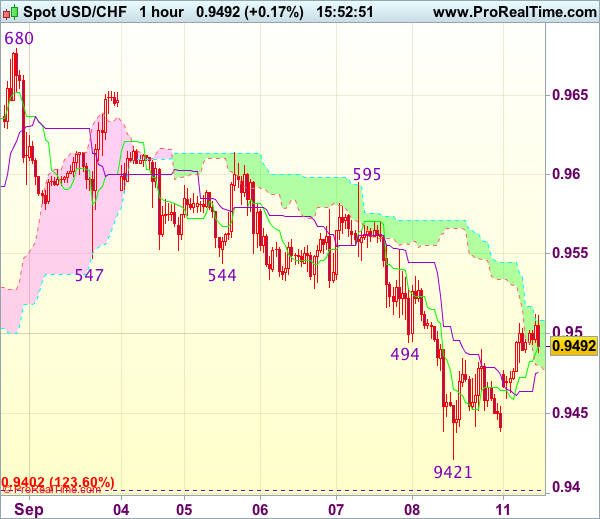
Trade Idea : USD/CHF – Hold long entered at 0.9450
USD/CHF - 0.9491
Most recent candlesticks pattern : N/A
Trend : Down
Tenkan-Sen level : 0.9494
Kijun-Sen level : 0.9476
Ichimoku cloud top : 0.9508
Ichimoku cloud bottom : 0.9479
Original strategy :
Bought at 0.9450, Target: 0.9550, Stop: 0.9415
Position : - Long at 0.9450
Target : - 0.9550
Stop : - 0.9415
New strategy :
Hold long entered at 0.9450, Target: 0.9550, Stop: 0.9420
Position : - Long at 0.9450
Target : - 0.9550
Stop : - 0.9420
As the greenback found support at 0.9439 and has rebounded, retaining our view that low is possibly formed at 0.9421 on Friday and consolidation with mild upside bias remains for retracement of recent decline, hence gain to 0.9520-30 would be seen, however, break of 0.9550-55 is needed to add credence to this view, bring a stronger rebound towards resistance at 0.9595 which is likely to hold from here.
In view of this, we are holding on to our long position entered at 0.9450. Below said support at 0.9421 would risk weakness to 0.9390-00, having said that, further sharp fall below 0.9370-75 should not be repeated and reckon 0.9350 would hold from here, bring rebound later.
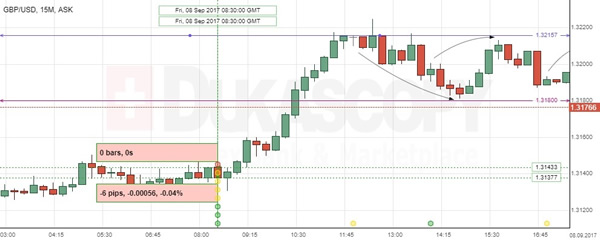
GBP/USD: Manufacturing Production
The GBP/USD currency pair showed modest reaction on the UK economic releases on Friday, as the reports revealed mixed results for July. However, a small impact from British macroeconomic data as well as the weakening US Dollar were not interfering the Sterling to extend gains by the mid-Friday session, where after post-data drop of 0.04% the British Pound rose to the highest level in five weeks to start trading in the 1.318-1.321 area.
The Office for National Statistics stated that the UK manufacturing output increased 0.5% over the month of July, showing the strongest gain this year. Coming along with weaker construction output, data suggested the UK economy to expand at a modest pace in the Q3.
EUR/JPY Daily Outlook
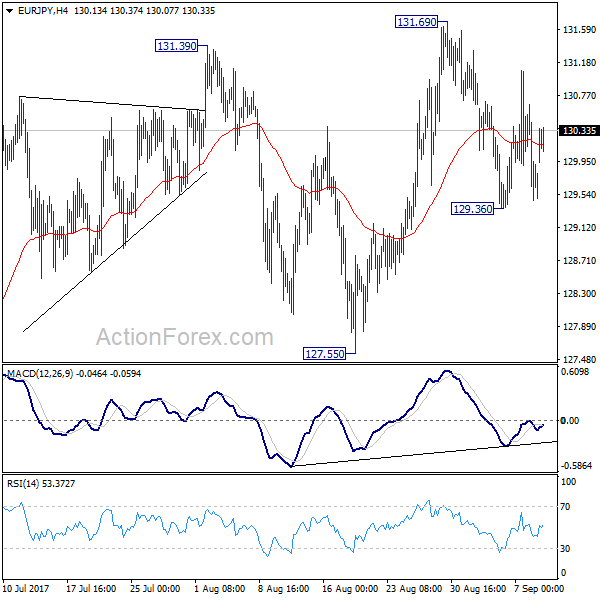
Daily Pivots: (S1) 129.26; (P) 129.96; (R1) 130.45; More...
Intraday bias in EUR/JPY remains neutral for the moment. On the downside, break of 129.36 will turn bias to the downside for 127.55 support first. Firm break there will indicate near term reversal and deeper fall would be seen back to 122.39/125.80 support zone. In any case, we'd expect more corrective trading with risk of another fall, as long as 131.69 holds.
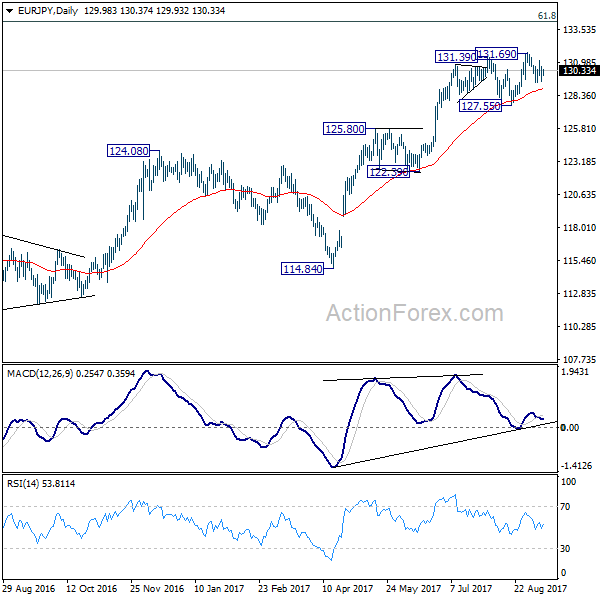
In the bigger picture, current rise from 109.03 is seen as at the same degree as the down trend from 149.76 (2014 high) to 109.03 (2016 low). as long as 124.08 resistance turned support holds, further rise is expected to 61.8% retracement of 149.76 to 109.03 at 134.20. Sustained break there will pave the way to key long term resistance zone at 141.04/149.76. However, firm break of 124.08 will argue that rise from 109.03 is completed and turn outlook bearish.