
Sample Category Title
EUR/GBP Daily Outlook
Daily Pivots: (S1) 0.9084; (P) 0.9143; (R1) 0.9177; More
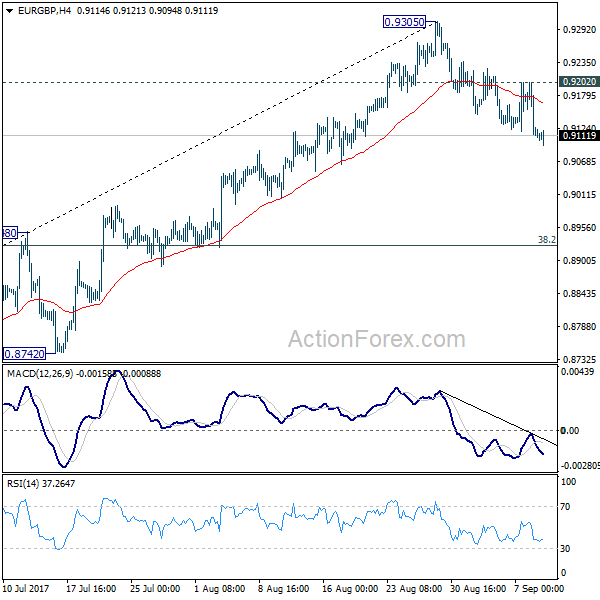
Intraday bias in EUR/GBP remains on the downside for the moment. Fall from 0.9305 should target 55 day EMA (now at 0.9021). Sustained trading below there will likely start the third leg of the consolidation from 0.9304 and target 38.2% retracement of 0.8312 to 0.9305 at 0.8926 first. On the upside, above 0.9202 minor resistance will turn bias back to the upside for 0.9305 resistance instead.
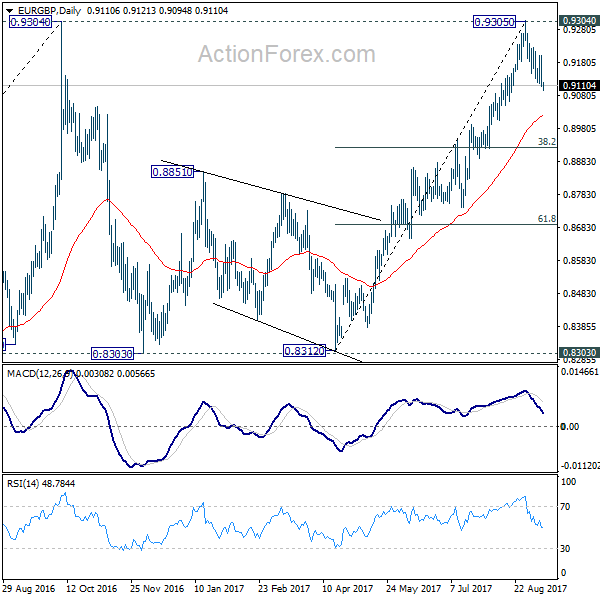
In the bigger picture, price actions from 0.9304 are viewed as a medium term corrective pattern. It's uncertain whether it is finished yet. But in case of another fall, we'd expect strong support from 0.8116 cluster support (50% retracement of 0.6935 to 0.9304 at 0.8120) to contain downside and bring rebound. Whole up trend from 0.6935 is expected to resume after consolidation from 0.9304 completes. Firm break of 0.9799 high will target 61.8% projection of 0.5680 to 0.9799 from 0.6935 at 1.1054.
USDJPY Tests Key Resistance
The USDJPY pair is gaining strength as the new trading week begins, with price-action moving towards key resistance, at 108.56, marking a one-hundred and twenty-five pips rebound from the fourteen-month trading low, set last week, at 107.31.
So far, the yen currency has overlooked stronger than expected domestic economic data out earlier today, which showed an eight-percent monthly increase in Japanese machine orders.
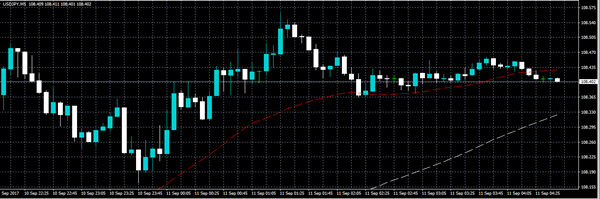
The USDJPY pair remains strongly bearish in the medium and long-term whilst trading below the 111.50 level. In the short-term, the pair remains intraday bullish whilst trading above the 108.37 level.
Key intraday technical support is located at the weekly USDJPY pivot point, at 108.37, the former yearly price low, at 108.13, and the daily pivot point, at 107.80.
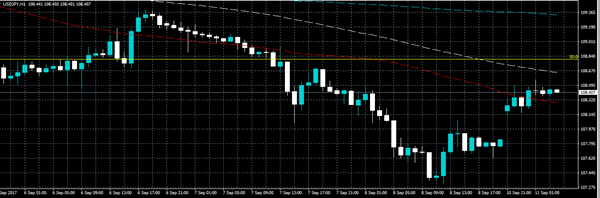
Key USDJPY technical resistance is located at the 100-hour moving average, at 108.60, with further long-term Fibonacci resistance at 108.80.
Above the 108.80 level, buyers may look to target the 109.05 level, and 200-hour moving average, at 109.32.
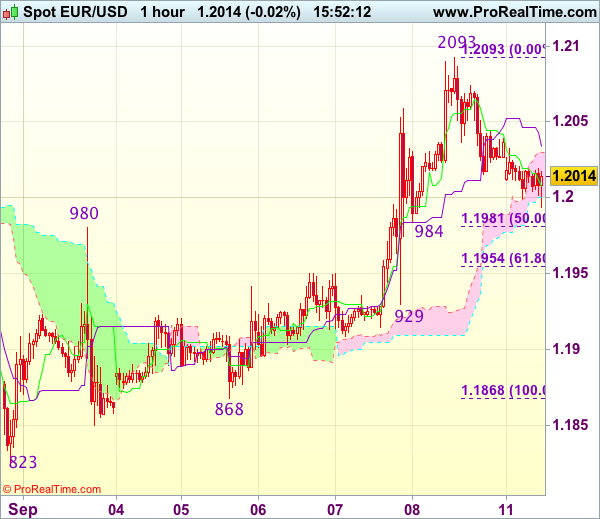
Trade Idea : EUR/USD – Buy at 1.1985
EUR/USD - 1.2014
Most recent candlesticks pattern : N/A
Trend : Up
Tenkan-Sen level : 1.2007
Kijun-Sen level : 1.2034
Ichimoku cloud top : 1.2030
Ichimoku cloud bottom : 1.2000
Original strategy :
Buy at 1.1985, Target: 1.2090, Stop: 1.1950
Position : -
Target : -
Stop : -
New strategy :
Buy at 1.1985, Target: 1.2090, Stop: 1.1950
Position : -
Target : -
Stop : -
Euro’s retreat after rising to 1.2093 late last week suggests consolidation below this level would be seen and pullback to 1.1981-84 (50% Fibonacci retracement of 1.1868-1.2093 and previous minor support) is likely, however, reckon downside would be limited and bring another rise later, above 1.2070-75 would bring retest of said resistance at 1.2093 but break there is needed to extend recent upmove to 1.2130-40, having said that, loss of upward momentum should limit upside to 1.2150-55 (61.8% projection of 1.1119-1.1910 measuring from 1.1662), bring correction later.
In view of this, would be prudent to buy euro on further subsequent pullback as support at 1.1980-84 should limit downside and bring another upmove later. Below 1.1950 (previous resistance turned support) would signal a temporary top is formed instead bring weakness to 1.1925-30 first.
Investors Track Hurricane Irma Amid Quiet Release Schedule
Deadly Hurricane Irma ripped through Florida on Sunday, causing widespread damage to the state. The storm ravaged the Caribbean region last week before making its way north toward the Florida Keys.
The storm, which has been downgraded to a Category 2 hurricane, is expected to cause more than $135 billion in damages. Some estimates show the total damages could reach $200 billion. Irma is expected to make its way through Florida in the coming days en route to Georgia.
US stock futures were surprisingly buoyant amid the storm, with the Dow Jones mini gaining more than 100 points in Asian trading. The US benchmarks finished mixed-to-lower on Friday.
Demand for riskier assets triggered a sharp slide in precious metals on Monday, with gold prices falling 0.7%. Silver was also down more than 1% on the Comex division of the New York Mercantile Exchange.
Gold has been one of the best performers in recent weeks, as geopolitical unrest and a plunging dollar boosted demand for bullion.
The US dollar index (DXY) was up 0.2% at the beginning of the week after crashing to more than two-and-a-half year lows. The DXY basket has shed 10.5% since the start of 2017.
The economic calendar has a light release schedule on Monday. The Japanese government begins the day with its Tertiary Index, which provides a snapshot of the country’s vast services sector. Separately, the Japan Machine Tool Builders’ Association will report on machine orders for the month of August.
In Europe, Portugal will release its latest batch of inflation data at 10:00 GMT. The consumer price index (CPI) fell 0.7% month-on-month in July.
Shifting gears to North America, the Canadian government will report on August housing starts at 12:15 GMT. Currency traders will likely brush off the report.
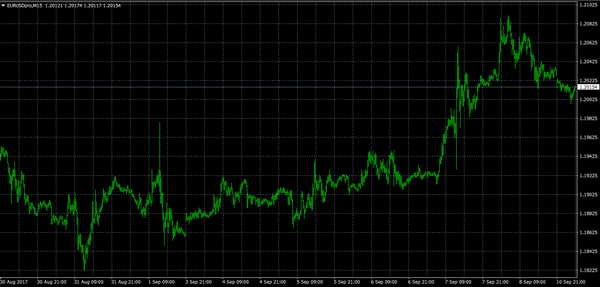
EUR/USD
Europe’s common currency was a chief benefactor of the dollar’s multi-week slump. The EUR/USD pair has come off its recent highs, but continues to trade above 1.2000. The market remains strongly bullish, with long positions aiming for 1.2100.
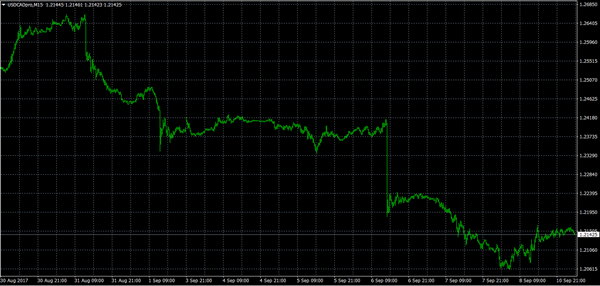
USD/CAD
The USD/CAD retook the 1.2100 handle on Friday after a precipitous decline earlier in the week that was stoked by a surprise rate hike by the Bank of Canada. The pair is holding on to immediate support at 1.2130. While a short-covering rally is expected to continue, the pair could face strong resistance at 1.2200.
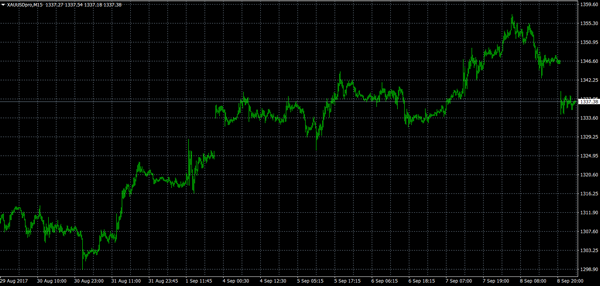
GOLD
Bullion has been on a tear in recent weeks, with prices reaching 12-month highs on the heels of a plunging US dollar. Spot gold prices were last seen trading around $1,337.00 a troy ounce. The precious metal faces immediate resistance at $1,350.00, a level that it failed to penetrate last week. The general trend shows strong support for bullion. However, the path higher is expected to be choppy.
EUR/AUD Daily Outlook
Daily Pivots: (S1) 1.4888; (P) 1.4915; (R1) 1.4967; More....
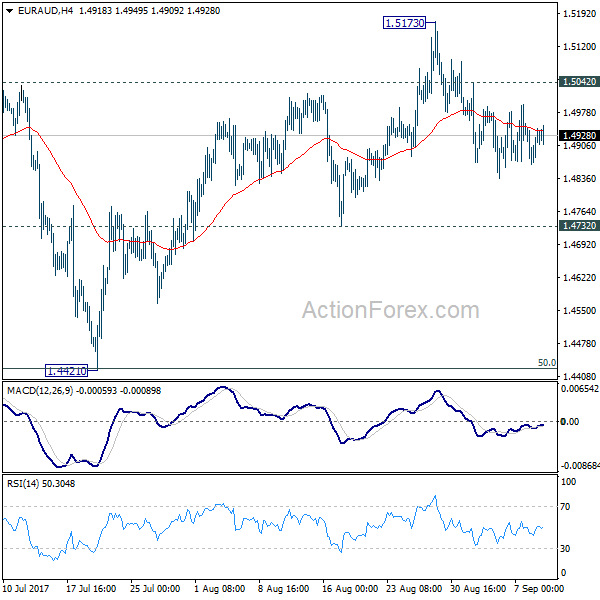
No change in EUR/AUD's outlook. With 1.5042 minor resistance intact, deeper decline is expected to 1.4732 support. Decisive break there confirm that fall from 1.5173 is the third leg of consolidation pattern from 1.5226. In that case, further fall should be seen to 1.4421 again. But we'd expect strong support from there to contain downside and bring rebound. On the upside, above 1.5042 minor resistance will turn bias back to the upside for 1.5173/5226 resistance zone instead.
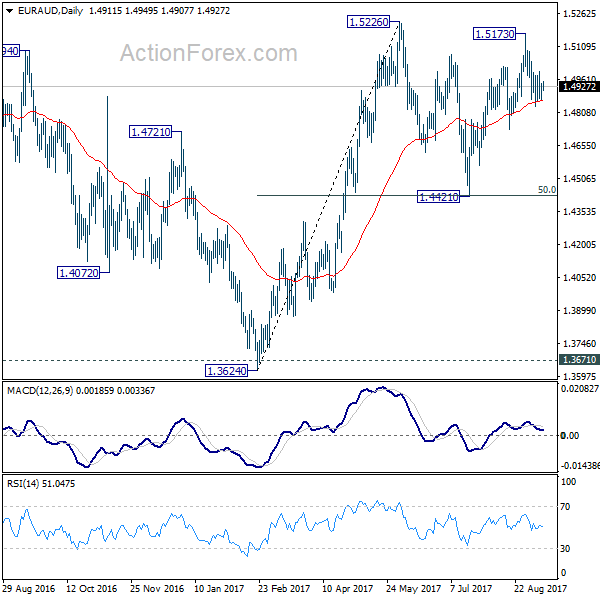
In the bigger picture, we're holding on to the view that corrective decline from 1.6587 medium term has completed at 1.3624. Rise from 1.3624 is expected to extend to retest 1.6587. The corrective structure of the price actions from 1.5226 is affirming this view. Above 1.5226 will target a test on 1.6587 key resistance. However, break of 1.4421 support will dampen our view and would drag EUR/AUD lower to retest key support zone around 1.3624.
EUR/CHF Daily Outlook
Daily Pivots: (S1) 1.1333; (P) 1.1383; (R1) 1.1409; More...
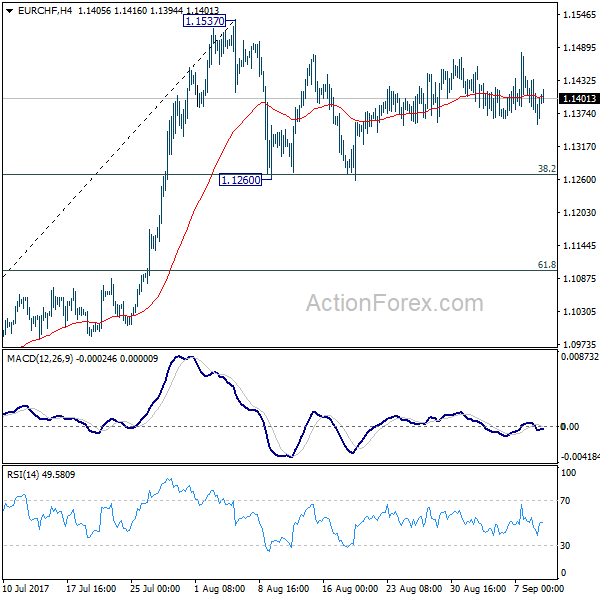
Intraday bias in EUR/CHF remains neutral as consolidation from 1.1537 is still in progress. More sideway trading could be seen. On the upside, break of 1.1537 resistance will confirm resumption of larger rally from 1.0629. In that case, EUR/CHF should target 1.2 key resistance level next. On the downside, firm break of 38.2% retracement of 1.0830 to 1.1537 at 1.1267 will extend the correction to 61.8% retracement at 1.1100 before completion.
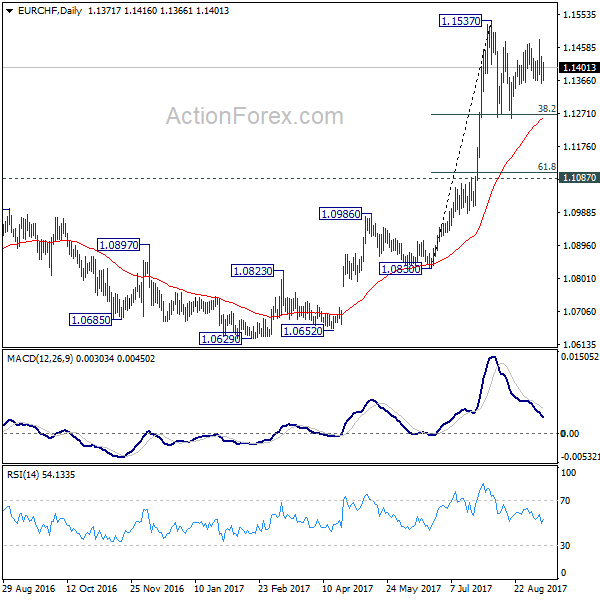
In the bigger picture, long term rise from SNB spike low back in 2015 is still in progress. EUR/CHF should now be heading back to prior SNB imposed floor at 1.2000. For now, this will be the favored case as long as 1.1087 resistance turned support holds.
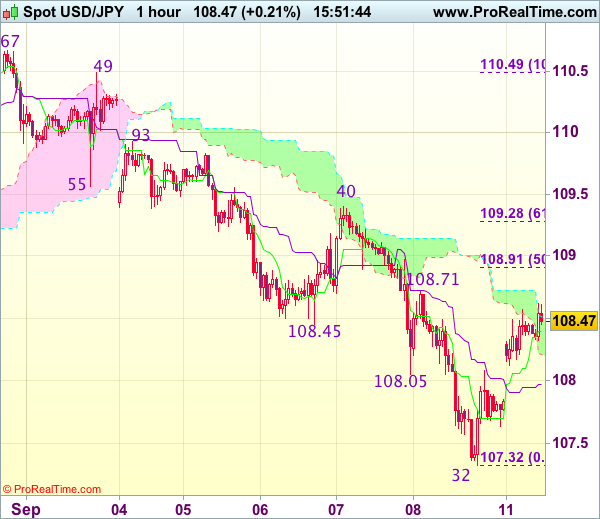
Trade Idea : USD/JPY – Sell at 108.90
USD/JPY - 108.45
Most recent candlesticks pattern : N/A
Trend : Down
Tenkan-Sen level : 108.40
Kijun-Sen level : 107.97
Ichimoku cloud top : 108.51
Ichimoku cloud bottom : 108.21
Original strategy :
Sell at 108.65, Target: 107.65, Stop: 109.00
Position : -
Target : -
Stop : -
New strategy :
Sell at 108.90, Target: 107.70, Stop: 109.25
Position : -
Target : -
Stop : -
As the greenback opened higher today and has edged higher, suggesting near term upside risk remains for the rebound from last week’s low of 107.32 to extend gain to 108.70-75, however, still reckon 108.90-95 (50% Fibonacci retracement 110.49-107.32) would limit upside and bring retreat later, below the Kijun-Sen (now at 107.97) would suggest the rebound from 107.32 has possibly ended but break of 107.60-65 is needed to confirm and bring retest of 107.32.
In view of this, we are still looking to sell dollar on further recovery as 108.90-95 should limit upside. Above 109.10-15 would defer and signal low has been formed, bring test of resistance at 109.40 but price should falter well below resistance at 109.93.
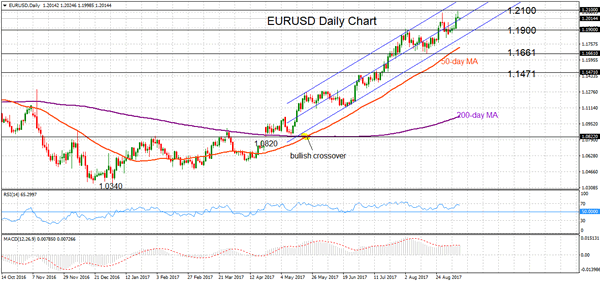
EURUSD Maintains Bullish Technical Picture, Rally Pauses At 1.21
EURUSD maintains its underlying bull trend. The pair has been rising steadily in an ascending channel since April and peaked at 1.2091 on Friday. This was the highest level since December 2014.
The key 1.2100 level will likely be a challenge to break. Prices retreated just ahead of this resistance as upside momentum faded and EURUSD subsequently pulled back. Based on the momentum oscillators, it can be seen that the market’s upward trajectory has slowed over the past couple of weeks.
Both RSI and MACD indicators are moving sideways, although they remain in their respective bullish territory. This suggests there is some risk in the near-term for a corrective move lower which should find support at 1.1900. From here a deeper pull-back is expected to find support at the August 17 low of 1.1661. A break below next support at the July 18 low of 1.1471 would likely increase selling pressure. Focus would shift to the downside for a reversal in the uptrend as a move below this level would result in a more than 50% retracement of the upleg from 1.0820 to 1.2091.
Alternatively, if immediate support holds, then a move higher through resistance at 1.2100 would see a resumption of the uptrend. This would strengthen the bullish outlook with scope for EURUSD to rise to the 1.2200 area before targeting the next major high in the upper-1.2500 zone.
The uptrend appears to be firmly established in both the short and medium-term charts which suggests limited risk for a reversal in the trend for now, especially if the market remains above the key 1.2000 level. The positively aligned 50 and 200-day moving averages are supporting a bullish outlook. Meanwhile, the RSI and MACD are still in bullish territory (above 50 and above zero, respectively).
Dollar Gets Back On Feet As Risk-Off Sentiment Eases, Oil Jumps On Potential Extension Of Supply Cut
On Monday, investors had a bit more appetite for risk in Asia, giving some support to the dollar, as North Korea celebrated the anniversary of its founding without any additional missile tests. In energy markets, oil prices showed some recovery after ministers from Saudi Arabia, Venezuela and Kazakhstan discussed the potential of extending the period of supply cuts ahead of the OPEC meeting in November.
The US was in a state of emergency during the weekend as thunderstorm Irma passed through Florida with powerful winds and turned roads into rivers, forcing the relocation of millions of people and causing serious destructive damage. However, the dollar managed to tick up during the Asian trading hours as fears over further North Korean nuclear tests eased. The isolated regime celebrated its founding day on Saturday by honoring the experts who fired the nuclear weapon last weekend. Yet, tensions remained high on Monday after North Korea threatened that the US will pay a “due price” if it continues pushing for fresh sanctions which are expected to be voted by the UN Security Council later today.
The dollar index, which gauges the dollar’s strength against a basket of trade-weighted major currencies edged up by 0.14% to 91.49, slightly up from the 32-month low reached on Friday.
The safe-haven yen and swiss franc retreated against the dollar as risk-off sentiment was reduced, giving the dollar some room for improvement. Dollar/yen rose by 0.69% to 108.56, while dollar/swissie increased by 0.70% to 0.9509.
The gold price, which tends to gain in times of political and economic uncertainties, moved 0.84% down to $1,334.60 per ounce.
Euro/dollar extended its losses made on Friday after an attempt to break above 1.21 failed, falling to 1.2015, while pound/dollar was hovering around 1.3190.
The kiwi managed to bounce up during Asian trading after New Zealand’s electronic retail sales’ growth more than doubled on a yearly basis in August. The figure rose by 4.4% y/y compared to 2.0% seen in July.
Looking at energy markets, oil prices settled higher after the Saudi Arabian Energy Minister, Khalid al-Falih met his Venezuelan and Kazakh counterparts separately on Sunday in an effort to extend the period of oil supply cuts by at least three months beyond March 2018, which was initially agreed among OPEC members and Russia. Non-OPEC Kazakhstan agreed to limit its output, aiming for a stand-alone deal with OPEC, while OPEC member Venezuela also positively considered the option of extension. Note that OPEC members are launching their next meeting on November 30 in Vienna.
WTI crude rose by 0.80% to $47.86 per barrel, while London-based Brent was up by 0.43% at $54.01 after a deep fall on Friday when Baker Hughes drilling counts showed a marginal increase in the number of US drilling rigs.
The commodity-linked loonie gained slightly against the greenback amid increasing oil prices with dollar/loonie falling by 0.14% to 1.2135.
USD Stabilizes
Hurricane Irma has, reportedly, inflicted less damage on the US mainland than was originally predicted, thereby reducing the economic impact of the devastation it was expected to cause. The hurricane caused flooding and tidal surges that knocked out power to 4 million homes and businesses in Florida.
Meteorologists are now predicting that Irma will weaken to a tropical storm as it travels into northern Florida and Southern Georgia.
Markets had been concerned that another North Korean missile test would occur over the weekend, but such fears were allayed – such concern saw a flight to safe havens last week and a broad USD decline. There is still a concern, as the markets are now awaiting the UN Security Council's vote later this week regarding further sanctions being imposed on the regime and how North Korea will respond. North Korea's state run news agency stated on Monday that 'North Korea is closely following the moves of the US with vigilance'.
Markets are also awaiting next week's Federal Reserve policy meeting, which will likely focus on economic growth following Harvey and Irma. In an interview with CNBC last week, NY Fed President Dudley commented that he had 'marked down' his Q3 growth estimate 'a touch' and further commented that US interest rates 'are going to move gradually higher over time'. The markets will now focus on US inflation data later this week.
EURUSD is unchanged from Friday's close – currently trading around 1.2015.
USDJPY is 0.2% higher in early trading, to currently trade around 108.38.
GBPUSD is little changed over the weekend and currently trades around 1.3180.
Gold is virtually unchanged and currently trade around $1,338.
WTI edged higher, by 0.6%, in early Monday trading, following reports that the Saudi Oil Minister has discussed extending a pact to cut global oil supplies beyond March 2018 with Venezuela & Kazakhstan. WTI is currently trading around $48.35pb.
At 13:15 BST, the Canadian Mortgage and Housing Corporation will release Canadian Housing Starts (YoY) for August. A robust Canadian economy led to the recent hike in rates by the Bank of Canada, so markets will be looking to see if the housing market is keeping up with demand by improving on the previous release of 222.3K.