Sample Category Title
Dollar Selling Picked Up Again on Geopolitical Tensions, Trump and Fed Uncertainties
Dollar ended the weak as the weakest major currency as weighed down by a number of factors. Judging from the fact that Yen and Swiss Franc were the strongest ones, risk aversion was a key factor in driving the greenback down. There is so far no resolution to the geopolitical tension between the US and North Korea yet. While US is calling for United Nations Security Council to vote on fresh sanctions against North Korea, it's effectiveness is in heavy doubt. There were also fears that North Korea will launch another missile to celebrate its foundation day on September 9, that is today. Also, not long after hurricane Harvey left, another one Irma is expected to land this weekend too. Some estimated the dame of Irma to be as much as USD 200b, topping Katrina that slammed into New Orleans back in 2005.
Geopolitical tensions, Trump, and Fed uncertainty to weigh down Dollar
In addition to geopolitical tensions and hurricanes, the greenback is also weighed down by falling treasury yield and fading chance of another rate hike by Fed this year. Talking about Fed, the surprised announcement of early resignation of Fed Vice Chair Stanley Fischer also raised doubts on what the group of Fed officials would become next year. Fed Chair Janet Yellen's term will expire next February and she could follower her closest ally Fischer and leave. It's reported that top contender, White House economic advisor Gary Cohn, is already out of the race. So, who's going to lead Fed next? It's question probably US President Donald Trump cannot answer himself.
Meanwhile, Trump just signed legislation on Friday to suspend the debt limit and that would keep the government running through December 8. USD 15.25b of hurricane relief funding will also be provided. However, it should be noted that it's a deal that was struck between Trump and Democrats. 90 Republicans have indeed voted in opposition in the House. Trump also overruled his treasury secretary, Steven Mnuchin, who's in the middle of a proposal for long term fix to the debt ceiling problem. Mnuchin was left to explain the deal to furious House Republicans before the vote. The handling of debt ceiling issue is another indication of Trump's disagreements with his own party Republicans. And this just add more to the doubt on whether Trump is able to push through the long awaited tax reforms and infrastructure spending.
The negative factors will continue to weigh on the greenback and any interim rebound would be temporary, until we see some fundamental changes in the situation.
So far, there is no change in the expectation that Fed is going to announce the plan to unwinding its USD 4.5T balance sheet on September 20. Comments from Fed officials last week regarding further rate hike were quite balanced. But the markets were simply getting more unconvinced Fed fund futures are now pricing in only 27.3% chance of a 25bps hike in December. A month ago, that was close to 50%.
TNX and DXY extended decline
10 year yield was dragged down by both safe haven flow as well as fading change of Fed hike. TNX extend the correction from 2.621 to as low as 2.034 last week. Near term outlook will remain bearish as long as 2.167. Further decline should be seen through 2.000 handle to 50% retracement of 1.336 to 2.621 at 1.978 next.
Some support was seen in the dollar index around 91.91/3 cluster support (38.2% retracement of 72.69 to 103.82 at 91.93). But that was brief and weak. The decline from 103.82 extend last week as dollar met fresh selling. As noted before, such decline is seen as corrective whole up trend from 72.69 (2011 low) to 103.82 (2017 high). Further fall is now expected as long as 94.14 support holds to 50% retracement at 88.25. It's a bit early to judge. But further downside acceleration could drag the index to next key cluster support at 84.75 (61.8% retracement at 84.58) before turning it into sustainable rebound.
Loonie support by BoC hike and job data
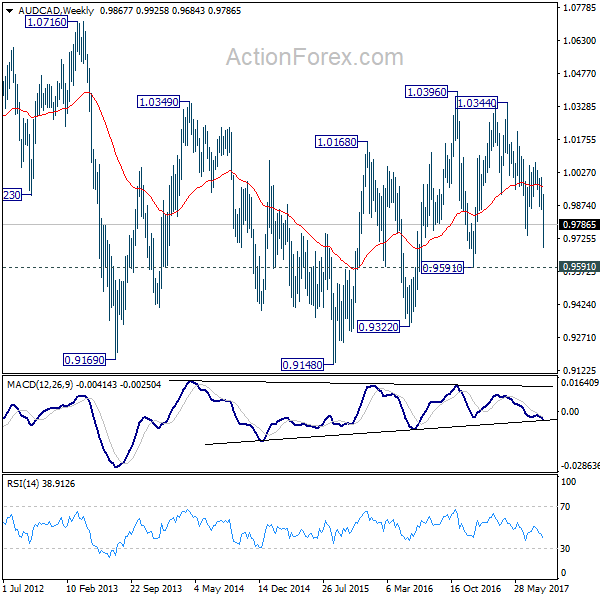
While risk aversion dragged down Aussie and Kiwi to some extents, against other major currencies, Canadian Dollar survived and ended as the third strongest one. The loonie was given a strong boost by the surprised interest rate hike by BoC. More in BOC Surprisingly Hikes Rate For Second Consecutive Meeting. Canadian was also supported by solid employment data released on Friday. USD/CAD could be losing some downside momentum as it approaches long term fibonacci level at 1.2048. But Canadian dollar is still looking bullish against other commodity currencies. For example, AUD/CAD's break of 0.9735 support indicates that fall from 1.0344 has resumed and deeper decline should be seen to 0.9591 support in near term at least.
Euro mixed after ECB meeting
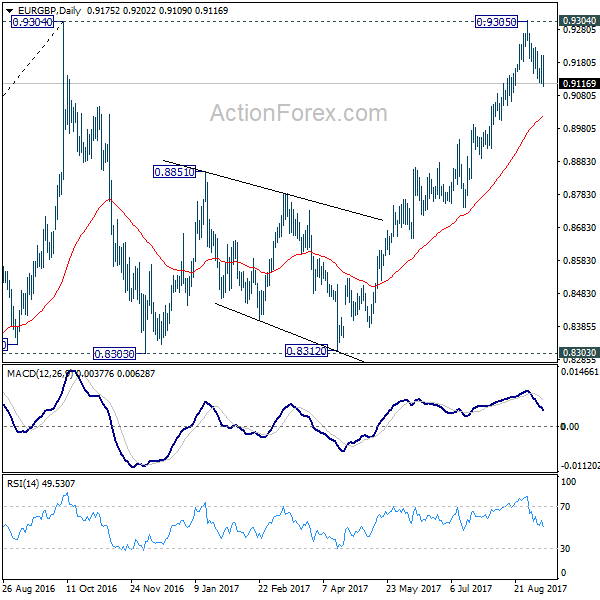
Euro was lifted against dollar last week after ECB meeting. ECB President Draghi indicated that the decision on "calibration" of the QE program will likely be made in October. More in Draghi Showed "Disaffection" Over Subdued Inflation, Admitted Discussions on QE Tapering. However, it should be noted that Euro has indeed ended the week down against, Yen, Swiss Franc, Canadian as well as Sterling. In particular, EUR/GBP's rejection from 0.9304 key resistance will likely extend lower in near term and that would limit rally attempt in the common currency against others.
A bit week for GBP with BoE and CPI
Talking about Sterling, the upcoming week will be an important one in UK. CPI will be released on Tuesday, followed by job data on Wednesday and BoE rate decision on Thursday. There is little chance for BoE to hike interest rate this time. The focus will stay on vote splits. Hawks Michael Saunders and Ian McCafferty are staying as hawks based on recent comments. But markets would be interested to see if they change their mind if CPI data disappoints again. In addition to that, rhetorics regarding Brexit will heat up again and UK and EU officials are preparing for the fourth round of talk to start on September 18. SNB will also meet this week but we're not expecting any surprise there.
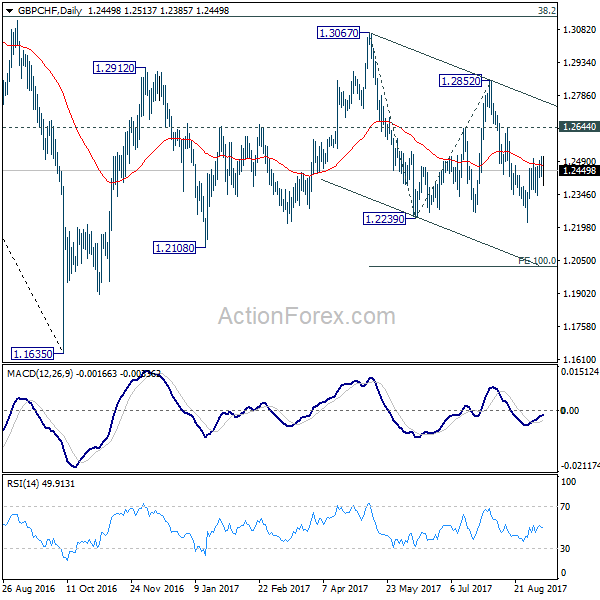
GBP/CHF continued to engage in medium term consolidation that started back at 1.1635. It's usually very hard to trade this kind of sideway medium to long term sideway patterns, especially during the very middle phase. For now, despite recent rebound, near term outlook stays bearish in GBP/CHF for deeper fall. The decline from 1.3067 could extend to 100% projection of 1.3067 to 1.2239 from 1.2852 at 1.2024 before completion.
Trading strategies
Regarding trading strategies, our EUR/USD long (bought at 1.1846) was closed at market at 1.1880 last week, making 34pts profits. That was before EUR/USD eventually surged to as high as 1.2091. While it looks a wrong decision to close that early, the concepts behind was not wrong at all. Euro has indeed ended the week mixed, as dragged down by the decline in EUR/GBP and EUR/JPY. EUR/AUD was, to a certain extent, weak, too. Nonetheless, admittedly, we didn't expect that Dollar was that weak. Meanwhile, we bought CAD/JPY at market at 88.10 last week, but was stopped out quickly at 87.90, losing 20 pts. . Similar, not long after we're stopped out, CAD/JPY surged to as high as 87.53.
Given that we don't know what North Korean leader Kim Jong-Un would do in the big Foundation Day, we'll refrain from giving any strategy first.
USD/JPY Weekly Outlook
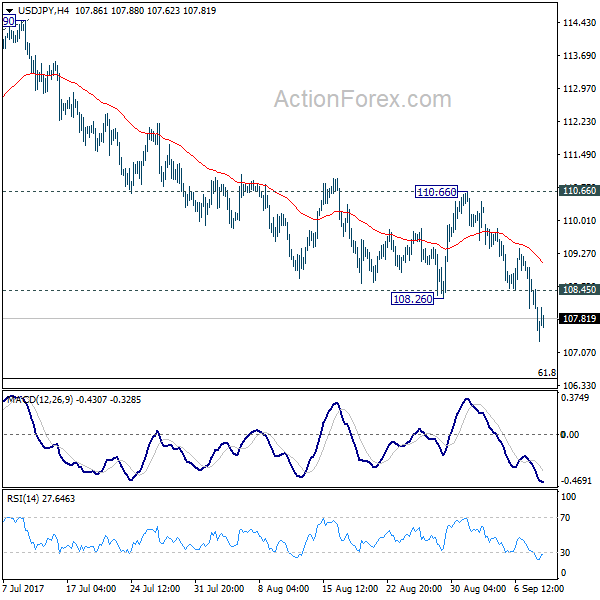
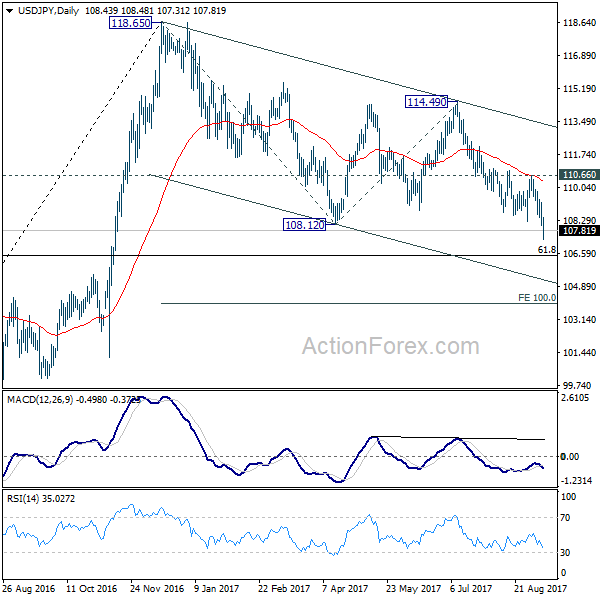
USD/JPY's medium decline from 118.65 finally resumed last week and reached as low as 107.31. Initial bias stays on the downside this week for 61.8% retracement of 98.97 to 118.65 at 106.48 first. We'd look for support from there to bring rebound. But firm break of 106.48 will extend the decline to 100% projection of 118.65 to 108.12 from 114.49 at 103.96 or below. On the upside, above 108.45 minor resistance will turn intraday bias neutral first. But outlook will now stay bearish as long as 110.66 resistance holds.
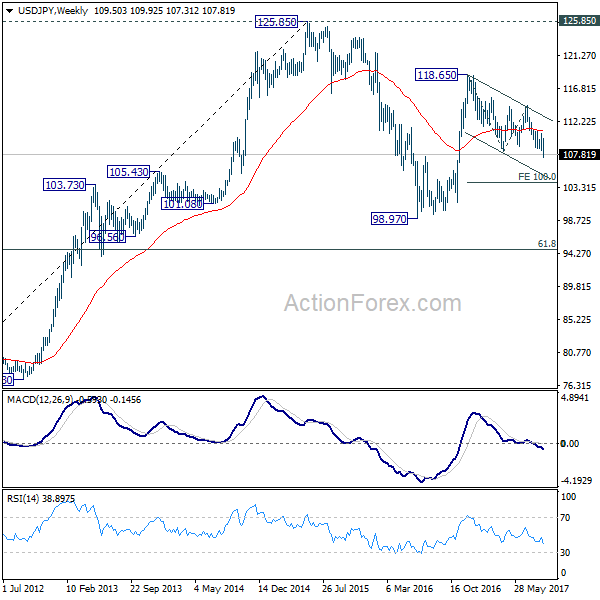
In the bigger picture, rise from 98.97 (2016 low) is now seen as the second leg of the corrective pattern from 125.85 (2015 high). It's unclear whether this this second leg has completed at 118.65 or not. But medium term outlook will be mildly bearish as long as 114.49 resistance holds. And, there is prospect of breaking 98.97 ahead. Meanwhile, break of 114.49 will bring retest of 125.85 high. But even in that case, we don't expect a break there on first attempt.
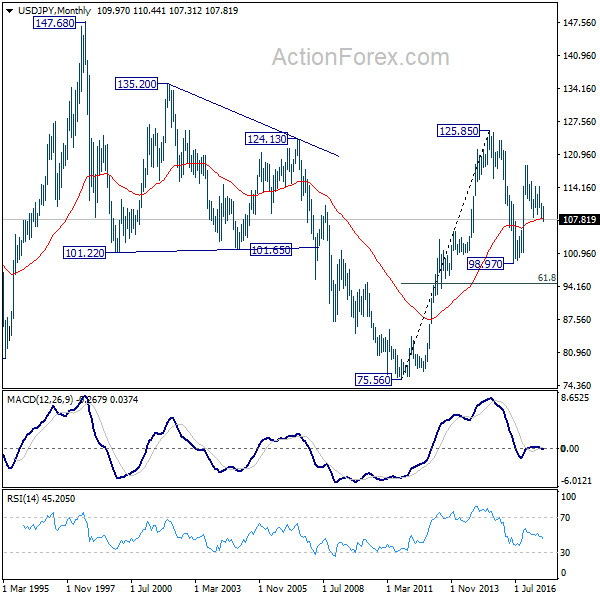
In the long term picture, the rise from 75.56 (2011 low) long term bottom to 125.85 top is viewed as an impulsive move, no change in this view. Price actions from 125.85 are seen as a corrective move which could still extend. In case of deeper fall, downside should be contained by 61.8% retracement of 75.56 to 125.85 at 94.77. Up trend from 75.56 is expected to resume at a later stage for above 135.20/147.68 resistance zone.
Eco Data 9/15/17
[php_everywhere] [/php_everywhere]
Eco Data 9/14/17
[php_everywhere] [/php_everywhere]
Eco Data 9/13/17
[php_everywhere] [/php_everywhere]
Eco Data 9/12/17
[php_everywhere] [/php_everywhere]
Eco Data 9/11/17
[php_everywhere] [/php_everywhere]
Summary 9/11 – 9/15
Monday, Sep 11, 2017
[php_everywhere] [/php_everywhere]
Tuesday, Sep 12, 2017
[php_everywhere] [/php_everywhere]
Wednesday, Sep 13, 2017
[php_everywhere] [/php_everywhere]
Thursday, Sep 14, 2017
[php_everywhere] [/php_everywhere]
Friday, Sep 15, 2017
[php_everywhere] [/php_everywhere].
Weekly Economic and Financial Commentary: Here Comes the Story of the Hurricane(s)
U.S. Review
That's Great it Starts With an Earthquake
- The economy took a backseat to the simultaneous approach of three hurricanes in the Atlantic basin and a magnitude 8.1 earthquake off the coast of Mexico. The influence of the storms is starting to soak into the economic data.
- Perhaps the most impactful economic news of the week came from the (pre-storm) factory orders report. While not typically a headlining economic indicator, it offered an indication of stronger business spending in July. Later in the week we learned that the ISM non-manufacturing index also improved, suggesting the momentum carried into August.
Here Comes the Story of the Hurricane(s)
Before the waters have fully receded in Houston, national attention has turned to the approach of Hurricane Irma barreling toward Florida and the southeastern United States. Our primary concern of course is for the people in the Caribbean who are still coming to grips with the devastation and that of our neighbors in Irma's path who are still in harm's way. In a recent special report "Impact of Hurricane Harvey" we consider the economic implications of the still undetermined damage in Houston.
The first hard-data reflection of the storms was manifested in this week's report on first-time claims for unemployment insurance. Jobless claims jumped to 298K from 236K in the prior week. The Labor Department reported an unadjusted increase of roughly 52K claims in Texas. The top chart show initial claims for the past 20 years and you can see the spike in 2005 related to Hurricane Katrina (circled in red), and the subsequent drop-off in claims that followed. The most important point though is that claims were only briefly affected at that time.
Using Katrina as a proxy, we can reasonably expect claims to continue to rise in coming weeks. That said, it is too early to tell yet what impact the storms will have on other measures of economic growth, but we will be monitoring the situation and will provide some thoughts where we can offer analysis rather than conjecture. In the meantime, we can unpack what this week's economic indicators tell us about the current condition of the expansion, starting with the factory orders report.
Shipments of core capital goods orders increased 1.2 percent in July, lifting the 3-month annualized growth rate to 5.4 percent. This is consistent with our forecast for gradual firming in equipment investment in the third quarter.
In a positive sign for future spending prospects, core capital goods orders also increased in July, growing 1.0 percent, which puts the 3-month annualized rate for that series at 5.1 percent. After having been a drag on growth in 2015 and 2016 when low oil and commodity prices acted as a damper on spending plans, equipment outlays have been gradually firming and added to topline growth for three-straight quarters.
Speed it up a Notch
As the bottom chart shows, during the 2015-2016 period, activity in the service sector handily outpaced activity in the factory sector. Both measures are in expansion territory today and we learned this week that the service-sector measure improved to 55.3 from 53.9 previously.
In a bit of role-reversal, the past few months have been characterized by activity in the manufacturing sector outpacing that of the service sector. ISM non-manufacturing tends to be a useful proxy of future core retail sales growth.
On that basis, our forecast for firming equipment spending in the second half and a softening in the pace of retail sales growth is consistent with what the survey data are signaling at present.
U.S. Outlook
CPI • Thursday
Consumer price growth remained subdued in July. Both headline and core CPI rose 0.1 percent on the month and 1.7 percent over the year. July's monthly figure was an improvement from the previous two months, however, as prices declined in May and were flat in June. Energy prices were a drag on the headline over the past three months, which we can expect to reverse in coming months as gas prices reflect the damage from Hurricane Harvey on the heart of the domestic energy sector. Retail gasoline prices surged around September 1, so August headline CPI is likely in the clear.
Looking to the trend, we expect below-target inflation to continue into next year. We expect only two rate increases by the FOMC in 2018—not the three the FOMC has currently projected, as the outlook for core inflation remains modest.
Previous: 0.1% Wells Fargo: 0.3% Consensus: 0.3% (Month-Over-Month)
Industrial Production • Friday
Industrial output rose 0.2 percent in July, though the increase was entirely due to mining and utilities output. Manufacturing output has been up one month and down the next, with July falling in the latter, down 0.1 percent. The sawtooth pattern is consistent with our forecast for continued modest, but steady growth. Taking a longer view, manufacturing output is up 0.8 percent, year to date.
Industrial production data are likely to be affected by Hurricane Harvey in coming months, as the storm knocked out utilities and mining operations. The shutdown of petrochemical plants and other key nodes in the domestic supply chain may extend the impact to longer than just one month, though IP recovered rather quickly following Katrina in 2005. Hurricane Irma may also have repercussions on manufacturing production operations that lay in its path this weekend, though to a smaller extent as it is not currently aiming at the heart of U.S. oil production.
Previous: 0.2% Wells Fargo: 0.2% Consensus: 0.1% (Month-Over-Month)
Retail Sales • Friday
July marked a strong start to the third quarter for retail sales, which rose 0.6 percent while June's decline was revised to a gain. Personal consumption expenditures in Q2 GDP also received an upward revision, pushing growth to 3.0 percent. Revisions show the domestic consumer was on solid footing in Q2 and had good momentum at the start of Q3. The strong showing for control group sales, which enters into the GDP calculation, gives more credence to our call for a strong consumer for the rest of the year.
Retail sales are also a series likely impacted by Harvey and Irma, though it is difficult to predict whether Hurricane Harvey will show in next week's advanced estimate for August. The impact will likely be more apparent in the revisions. September will also likely be skewed by both Harvey and Irma, and Florida's missed tourism dollars may weigh on year-over-year sales in subsequent months.
Previous: 0.6% Wells Fargo: 0.1% Consensus: 0.1% (Month-Over-Month)
Global Review
Strong Growth Leads Bank of Canada to Hike Rates
- The Bank of Canada surprised many analysts this week by announcing its second 25 bps rate hike since July. The Bank cited strong economic growth as a reason for hiking rates. The Canadian dollar rose to a two-year high against the U.S. dollar this week.
ECB Remains on Hold, For Now
- The ECB did not make any changes to its policy stance this week. However, the expansion in the Eurozone is becoming increasingly self-sustaining, and we look for the Governing Council to announce a further reduction in the monthly pace of its bond purchases at its next policy meeting on October 26.
Strong Growth Leads Bank of Canada to Hike Rates
The Bank of Canada (BoC) surprised many analysts this week by hiking its main policy rate by 25 bps, the second rate hike since mid-July (see graph on front page). The rate hike brings the main policy rate back to 1.00 percent, the level that prevailed in January 2015 before the Canadian economy slid into a mild recession. In announcing the rate hike, the BoC said that "recent economic data have been stronger than expected" and that growth "is becoming more broad-based and self-sustaining." That said, the BoC noted that the outlook is subject to a number of risks and that future policy moves "are not predetermined."
The Canadian dollar, which is up more than 10 percent vis-à-vis the U.S. dollar since the beginning of the year, rallied in the immediate aftermath of the surprise rate hike and rose to a twoyear high versus the greenback (top chart). We look for the BoC to hike rates twice in 2018. Our currency strategy group expects the loonie will continue to trend higher versus the greenback going forward, albeit not as rapidly as in recent months.
ECB Remains on Hold, For Now
The European Central Bank also held a policy meeting this week. Unlike the BoC, the ECB Governing Council decided to keep its policy rates on hold, which was widely expected. The Governing Council also decided to keep the flow of its quantitative easing (QE) program unchanged at €60 billion per month, which was also widely expected.
In the policy statement that followed the meeting, the Governing Council acknowledged that the economic expansion in the euro area "continues to be solid and broad-based across countries and sectors." Indeed, the year-over-year rate of GDP growth in Q2, which was originally reported as 2.2 percent, was revised up this week to a six-year high of 2.3 percent.
There is not much "hard" data out of the third quarter yet, but the purchasing managers' indices remain well above the demarcation line separating expansion from contraction. Industrial production (IP) in Germany was flat in July relative to the previous month, but the year-over-year rate of growth remained buoyant at 4.0 percent (bottom chart). French IP rose 0.5 percent in July relative to the previous month, bringing the year-over-year growth rate up to a two-year high of 3.7 percent.
The ECB has had a QE program in place for more than two years, which has led to a doubling in the size of its balance sheet over that period (middle chart). In March, the Governing Council announced that it would dial back its monthly purchase rate of bonds from €80 billion per month to €60 billion per month, where it has subsequently been maintained. With the expansion becoming increasingly self-sustaining, we look for the Governing Council to announce a further reduction in its monthly purchase rate at its October 26 meeting. By the middle of next year, we expect that the ECB will cease buying bonds altogether. However, the Governing Council does not appear to be in any hurry to hike rates. With CPI inflation well below 2 percent at present, we look for the ECB to keep rates on hold until the end of 2018.
Global Outlook
Eurozone Industrial Prod. • Wednesday
The Eurozone grew at a relatively healthy clip in Q2 2017, up 0.6 percent seasonally adjusted (not annualized) and by an upwardly revised 2.3 percent year-over-year rate. Furthermore, we have seen some forward momentum on the Markit manufacturing PMI, which printed 57.4 in August, matching the highest reading for the series recorded in June of this year. At the same time the ECB kept monetary policy unchanged (read more on this on our Global Review section on the previous page).
With this information in the background, the industrial production index declined 0.6 percent in June after a very strong month in May, up 1.2 percent. Thus, markets will be anticipating if the industrial production index recovers in July to see if the economy kept its momentum at the start of the third quarter.
Previous: -0.6% Consensus: 0.0% (Month-Over-Month)
China Industrial Prod. • Wednesday
The year-over-year uptick in the Chinese industrial production index compared to last year has not gone unnoticed by the rest of the global economy with industrial production and export growth improving across the globe. Thus, when the Chinese industrial production index for August hits the airwaves on Wednesday it could impact markets. Consensus expectations call for the index to have improved from 6.4 percent for the year ending in July to 6.6 percent year-on-year in August, a marginal increase but positive nonetheless. At the same time, consensus expects the index to have increased 6.8 percent on a year-to-date basis in August.
Also on Wednesday we get Chinese retail sales for August and markets are also looking for a slight increase for the year-over-year measure, from 10.4 percent in July to 10.5 percent in August.
Previous: 6.4% Consensus: 6.8% (Year-Over-Year)
Brazil Economic Activity Index • Thursday
Although the Brazilian political corruption crisis continues to amaze friends and foes alike almost on a daily basis, the Brazilian economy seems to have finally detached from the travails of its political malaise and is primed for a continuation of growth. Of course, the political risks could still potentially, once again, derail the current recovery. However, the recovery is sustained by the economic collapse of the last several years. That is, economic numbers are coming from such a low base that it will be difficult for the economy not to continue to show improvement.
Case in point will be the release on Thursday of the monthly economic activity index for July. Although the index has not been consistently positive on a month-on-month or even on year-over year basis, the economic activity index has improved considerably compared to the last several years.
Previous: -0.6% (Year-Over-Year)
Point of View
Interest Rate Watch
Slower Reflation, Slower Tightening?
The FOMC is likely to lay out a more gradual path for inflation in its next set of projections, due after the committee wraps up its Sep. 19-20 meeting.
As of its June meeting, FOMC members expected headline PCE inflation to reach 1.6 percent by year end. That continues to look reasonable due to the jump in gasoline prices expected for September, but expectations for core inflation will likely be revised lower. In June, the median forecast for core inflation was 1.7 percent. To be achieved, monthly inflation readings for the remainder of the year would need to average 0.2 percent a month—twice the pace of gains so far this year. That could be a tall order, especially since core inflation has tended to post smaller gains in H2.
Reaching 2.0 percent by the end of 2018, the current median FOMC estimate, also looks tougher. While recent base effects will not need to be factored in to officials' 2018 estimates, the soft patch in core inflation since the Spring has some Fed officials questioning the traditional emphasis on resource slack. At the July FOMC meeting, participants discussed the efficacy of such framework. This week Fed Governor Lael Brainard highlighted the disconnect between inflation and an economy operating near full employment, casting doubt on resource utilization as a reason for low inflation.
As Fed officials go through a rethink, we expect to see a shallower path of inflation laid out. While resource utilization still plays an important role in inflation, the weakness of recent months have highlighted it is not the only driver. Expectations, influenced by the recent trend in inflation, remain key and are still at historically low levels. As a result, it may be harder for services inflation to break out of its current trend channel despite further tightening in the labor market. Core goods prices should get a boost from a weaker dollar and rising inflation abroad. The lift, however, will be limited by declining prices for autos. The question for Fed officials in the coming months will be whether the slowdown is significant enough to warrant a slower pace of future rate hikes.
Credit Market Insights
The Beige Book Credit Outlook
The Fed's most recent Beige Book conveyed healthy economic conditions throughout the twelve Federal Reserve Districts. Credit conditions appear to be broadly stable throughout the United States. In its August 2017 report the Fed noted, "business and consumer loan demand grew at a modest pace in most districts, with a number of banks reporting rising competition from both other banks and non-bank lenders."
There were modest changes in loan demand across the districts. Richmond and Chicago reported slight growth in loan demand, and both the Philadelphia and Dallas districts reported a faster pace of demand compared to the previous reporting period. There was steady loan demand reported in New York, Cleveland, and Kansas city.
Modest loan growth has been attributed to an increase in competition among banks and non-banking institutions, and the uncertain political climate. The limited supply of homes for sale has caused mortgage activity to slow in some districts. Several districts also reported concerns regarding the decline in auto lending, attributed to a slowdown in auto demand. Delinquency rates appear low to moderate across the districts. Loan portfolios were considered healthy, with no significant signs of concern.
The modest growth depicted in the Beige Book has left sentiments about future business activity and loan demand largely positive.
Topic of the Week
Fischer to Leave Fed in October
Stanley Fischer, who has served as the Vice-Chairman of the Federal Reserve Board since May 2014, announced this week that he would be resigning "on or around October 13." Before joining the Fed, Fischer did stints as a Professor of Economics at MIT, Chief Economist of the World Bank, Deputy Managing Director of the IMF, and Governor of the Bank of Israel. He is widely respected due to his deep knowledge of economics and monetary policymaking.
There currently are only four members on the sevenmember Board of Governors, and the headcount will fall to three once Fischer leaves. His departure will complicate matters a bit for the Fed, but it will not hamstring the organization. The Board can still have a quorum as long as a majority of members are present. In a three-member Board, two members would need to be present to have a quorum. Besides, President Trump nominated Randal Quarles to fill one of the vacant board seats in July, and the Senate has already held confirmation hearings. Assuming Quarles is confirmed by the Senate, the number of board members would increase again to four. Marvin Goodfriend, the former research director at the Richmond Fed, has been rumored to be in line for a Fed board seat but Trump has not yet formally nominated him.
Fischer's announcement brought back into focus the question of who will be the next Fed Chair once Janet Yellen's term expires in February 2018. Gary Cohn, the current Director of the National Economic Council, was seen as the frontrunner, but the Wall Street Journal reported this week that Cohn has recently lost favor with Trump. Other potential candidates include Yellen, Larry Lindsey, Kevin Warsh and John Taylor. Lindsey and Warsh both have Fed experience, and Taylor is a wellrespected academic economist. President Trump will need to make a decision by the end of the year. For further reading see "The Contenders: Prospects for the Next Fed Chair" which is posted on our website.
Dollar Staggers Ahead of Inflation Data
USD to face inflation and retail sales
The USD is lower across the board against majors as geopolitical turmoil at home and abroad, natural disasters and an uncertain fate for rate hikes have left the currency adrift. The US Federal Reserve members remain divided on the pace of rate hikes. Inflation has been low in the United States and is putting no pressure on the central bank to keep raising interest rates. The Bureau of Labor Statistics will release the consumer price index (CPI) on Thursday, September 14 at 8:30 am EDT. Consumer prices account for the majority of inflation with the core reading released at the same time removing the more volatile items: food and energy.
Low inflation has been a problem for most major economies, but the Brexit debacle has increased inflationary pressures in the United Kingdom. The Office for National Statistics will release its annual CPI on Tuesday, September 12 at 4:30 am EDT. Later in the week the Bank of England (BoE) will publish its monetary policy summary on Thursday, September 14 at 7:00 am EDT. The British benchmark interest rate is expected to remain unchanged but the minutes and policy member votes will be highlights as the UK economy is losing momentum while Brexit talks are ongoing.
US and UK events will dominate the economic calendar this week with the Swiss National Bank libor rate announcement on Thursday, September 14 at 3:30 am EDT another big highlight. The approach of Hurricane Irma to the United States will also have energy traders on alert as well as Saturday's celebration of North Korea's Foundation Day .
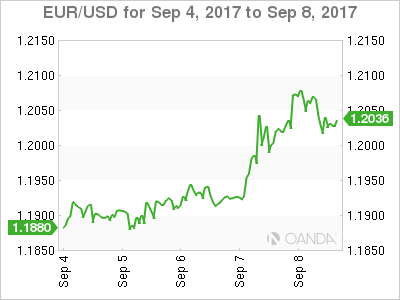
The EUR/USD rose 1.238 percent in the last week. The single currency is trading at 1.2046 after breaking above 1.20 with the release of the European Central Bank (ECB) monetary policy statement and press conference with President Mario Draghi puts a tapering announcement firmly on the October agenda. There were few US economic indicator releases and the geopolitical and natural storms took a toll on the dollar. There was some relief as the second round of NAFTA and the debt ceiling were pushed back for later and the Trump administration is pushing hard for tax reforms. The situation in North Korea will continue to trigger a flight to safety benefiting the EUR.
Dovish Fed members earlier in the week suggested the central bank slow down its rate hiking pace. The U.S. Federal Reserve is expected to announce the timeline for its balance sheet reduction in its September 20 meeting, leaving some room if it wants to hike in December (which could be Fed Chair Janet Yellen's last major decision as her term ends in February). The lack of clear candidate to replace Yellen is another strike on the Trump Administration. Economics adviser Gary Cohn was a strong candidate until falling out with Trump over the official response to Charlottesville.
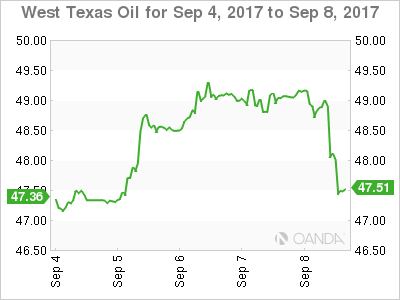
West Texas Intermediate rose 0.607 percent in the last five days. US crude is trading at 47.44 as Texan refineries are coming back online albeit slowly. Hurricane Harvey had a big impact on refineries creating a glut of crude but a shorter supply of gasoline. That situation is getting better, but with Hurricane Irma threatening oil platforms in the Gulf the situation could be reversed going into the weekend.
Despite the recovery of prices during the week oil posted a drop on Friday as the tropical storm is headed towards Florida which could affect demand for energy. Oil rig counts continue to be unaffected and added to the US crude stocks report there is ample supply of crude, also pushing down prices. Rumours out of China for lower demand and new estimates on how fast Texan refineries could be out has also limited the recovery of oil prices.
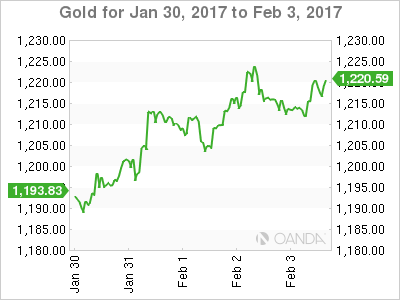
Gold rose 1.711 in the past five days. The yellow metal is trading at $1346.99, its highest price in twelve months. Geopolitical turmoil in particular regarding the situation with North Korea and the problems within the White House to put together a strong tax reform, debt ceiling and NAFTA renegotiation while at the same time responding to another approaching Hurricane have forced investors to look for safe havens.
The USD is struggling to regain momentum and with the Fed facing concerns about a third rate hike, the precious metal has advanced. The release of US inflation indicators could do more damage to the probabilities of a December rate hike than to the price of gold as an inflation hedge.
Market events to watch this week:
Tuesday, September 12
- 4:30 am GBP CPI y/y
Wednesday, September 13
- 4:30 am GBP Average Earnings Index 3m/y
- 8:30 am USD PPI m/m
- 10:30 am USD Crude Oil Inventories
- 9:30 pm AUD Employment Change
- 10:00 pm CNY Industrial Production y/y
Thursday, September 14
- 3:30 am CHF Libor Rate
- 3:30 am CHF SNB Monetary Policy Assessment
- 4:30 am GBP Retail Sales m/m
- 7:00 am GBP MPC Official Bank Rate Votes
- 7:00 am GBP Monetary Policy Summary
- 8:30 am USD CPI m/m
- 8:30 am USD Core CPI m/m
- 8:30 am USD Unemployment Claims
Friday, September 15
- 8:30 am USD Core Retail Sales m/m
- 8:30 am USD Retail Sales m/m
*All times EDT
The Weekly Bottom Line: More Stormy Weather And Volatile Data On The Horizon
U.S. Highlights
- Investors had lots to digest this week, with the lineup including communication from central banks, natural disasters and growing geopolitical tensions. The dynamics weighed on equities, while sending gold and Treasuries higher. Economic data remained largely positive, but diverging views among Fed officials point to some uncertainty.
- The October departure of Vice Chair Fischer is likely to add to that uncertainty.
- Economic data is likely to sustain some volatility due to the effects of Hurricane Harvey and the impending Hurricane Irma. Today's swift deal in Congress to extend the government's funding and borrowing limit until Dec. 8th, along with a $15.25 bn. relief package, should nonetheless provide some solace for the economy.
Canadian Highlights
- The GDP print was enough to sway the Bank of Canada to hike rates for the second consecutive meeting, with the move sending the loonie 2.4% higher on the week, 5% on the month, and 13.5% from its early-May trough.
- The stronger loonie has hampered exports which declined for the second time in July, with more weakness likely. Alongside the net export drag, residential investment is also likely to remain weak as Ontario markets cool-off.
- While not without blemishes, the employment report was a good one with the economy adding 22k jobs and the jobless rate down 0.1pp to 6.2%. The eroding labour market slack led to a pick-up in wage growth to 1.8% from a year-ago, providing some comfort for the Bank of Canada, with another hike still likely before the year is out.
U.S. - More Stormy Weather And Volatile Data On The Horizon
Despite this being a holiday-shortened week, investors had lots to digest, with the lineup including communication from central banks, natural disasters and growing geopolitical tensions. The latter was the dominating factor at the start of the week, with markets opening on a dour note as investors poured into safe haven assets. The dynamic sent gold and Treasuries higher, while also benefitting crude oil. Conversely, long-term yields and the trade-weighted U.S. dollar sustained their downward trends – the latter falling to early 2015 levels.
Nonetheless, the theme of synchronized economic growth leading to a removal of monetary stimulus was back on display this week. An improved performance of the Eurozone and Canadian economies, which have been growing at rates significantly above potential lately, inspired more hawkish stances among their central banks. In this vein, the BoC hiked its key interest rate for the second time in two months, while the ECB began having 'very preliminary discussions' about how to scale back its €60 bn/month asset purchase program, with the process likely to start next year.
U.S. economic data was similarly positive. The trade deficit remained largely unchanged in July, and net exports are on track to contribute positively to economic activity for the third consecutive quarter. At the same time, the ISM non-manufacturing index followed its manufacturing counterpart and rebounded in August. The renewed vigor in both ISM metrics points to economic growth gaining momentum, with an upbeat tone in the Beige Book echoing a similar narrative. What is more, the prices paid components of both indices continued to point to rising price pressures (Chart 1). While we are yet to see these manifest in inflation metrics, the trend should still provide some comfort to the Fed as it meets to discuss monetary policy in two weeks' time.
Ahead of that meeting, a number of speeches from Fed officials took place throughout the week. The most significant were those of voting members Brainard and Dudley. Brainard's speech, which suggested treading carefully over low inflation, was decisively dovish. Meanwhile, Dudley retained a more hawkish tone, but did acknowledge his 'surprise' to the shortfall in inflation and suggested that 'structural' factors may be at play. The diverging views point to some uncertainty as to the near-term path of interest rates. The October departure of Vice Chair Fischer, at a time when the Fed Board already has three vacancies, is likely to add to that uncertainty.
This comes at a time when economic data is bound to go through some volatility due to the effects of Hurricane Harvey and the impending Hurricane Irma. Case in point, the weak August auto sales report has already been followed by a spike in jobless claims this week (Chart 2). The theme also played out in the Beige Book which, despite its upbeat tone, highlighted Harvey-related disruptions ahead. We expect these transitory effects to leave economic growth largely unchanged over the medium-term, but they will likely weigh on near-term economic activity. Today's swift deal in Congress to extend the government's funding and borrowing limit until Dec. 8th, along with a $15.25 bn. relief package, should nonetheless provide some solace.
Canada - BoC Hikes On Strong Data, With More To Come
It was another busy week in Canadian markets. Last week's blowout second quarter GDP number rapidly increased the chances of a near-term rate hike, and the Bank of Canada delivered. Since the chances of a hike were effectively a coin-toss, the rate rise drove bond yields up and lit a fire under the loonie. The Canadian dollar looks to finish the week 2.4% higher, marking a fourth consecutive week of gains vis-à-vis the greenback with the cumulative gain some 5% on the month. The loonie's strength extends further than that, with robust Canadian data, and some broad-based weakness in the greenback, leaving the Canadian dollar a whopping 13.5% higher since its early-May trough.
The currency strength has begun to manifest on economic data. It has likely kept inflation down by about 0.2pp in recent months and has made Canadian exports more expensive on world markets. Trade data for July indicated a second consecutive decline with exports 1.6% lower July after a 3.0% decline in June. Moreover, the currency's strength over August and September (so far) indicates that further weakness in exports is likely (see Chart 1), with trade likely to subtract from GDP over the third quarter, and perhaps even into the last quarter of the year. The trade numbers could be further affected by the persistent uncertainty related to the ongoing NAFTA renegotiations.
Another sector that's likely to remain weak in the third quarter is residential investment. Monthly data from regional real estate boards this week indicated that both the Toronto and Vancouver markets saw sales pick-up in August from the previous month, ending four and three months of declines, respectively. However, third quarter sales activity is likely to remain very weak and together with lower prices will weigh on residential investment during the quarter.
Despite the softening in some sectors, much of the economy remains on a good course. The LFS employment report indicated that the jobless rate fell 0.1 pp to 6.2% – its lowest level since October 2008 – as the Canadian economy added a robust 22,200 jobs in August (Chart 2). It bears noting that this gain was due entirely to increases in part-time work. But, that caveat aside, the strength of job creation is beginning to show up in wage gains. The average hourly wage rose 0.5% on the month, and accelerating to 1.8% relative to a year ago.
The Bank of Canada's most recent policy statement highlighted concerns over the "subdued" wage and price pressures. To that end, the acceleration in the wage growth in the August employment report is likely to provide some comfort with the hopes that wage growth will help lift inflation higher. The BoC will also likely discount any near-term weakness in inflation given the transitory effects of currency appreciation on consumer prices (also likely to be offset by Hurricane Harvey related impacts on gasoline prices). Lastly, the Bank is unlikely to be surprised by a slowdown in economic growth over the second-half of the year, which it fully expects according to the policy statement. As such, we believe another hike is very much possible before the year is out.
U.S.: Upcoming Key Economic Releases
U.S. Consumer Price Index - August
Release Date: September 14, 2017
Previous Result: 0.1% m/m, core 0.1% m/m
TD Forecast: : 0.4% m/m, core 0.2% m/m
Consensus: 0.3% m/m, core 0.2% m/m
We expect headline CPI inflation to pick up to 1.9% y/y in August, with prices up 0.4% m/m. Energy prices will be a significant boost this month following Hurricane Harvey, which shuttered about a quarter of the nation's refinery output. We expect gasoline prices up nearly 6% m/m, with an even stronger increase in September. That would leave headline inflation on track to breach 2% y/y by October. In the core, we look for a return to a 0.2% m/m print (the first in six months) though unfavorable base effects leave the y/y rate lower at 1.6%. August gains should largely be driven by a rebound in hotel prices, which plunged in the prior two months. In addition, some further stabilization in core goods prices, led by apparel and presaged by higher import prices, along with steady strength in OER and rents should drive the pickup and offset a likely persistent drag from past categories of weakness, namely vehicle prices and wireless services. That said, we proceed with caution in the near term and continue to see risks skewed to the downside as the uncertain retail landscape suggests scope for more disappointment ahead. Further downside realized in core prices—in the form of 0.1% m/m prints in core CPI—will likely drive greater caution among Fed policymakers over future rate hikes.
U.S. Retail Sales - August
Release Date: September 15, 2017
Previous Result: 0.6%, ex-auto 0.5%
TD Forecast: -0.1%, ex-auto 0.5%
Consensus: 0.1%, ex-auto 0.5%
We expect retail sales to fall 0.1% in August, led by a drop in motor vehicle sales. Light weight auto and truck sales disappointed at a 16.0m annual rate last month, in part due to the aftermath of Hurricane Harvey that hit Houston—the second largest auto market in the US. The August sales figure came in lower than analyst expectations, pointing to weaker Q3 real PCE closer to a mid to low 2% pace. Offsetting the August drop in auto sales are gasoline station receipts, reflecting a significant jump in gasoline prices. This should leave ex-auto sales up 0.5% and we also see scope for a healthy 0.3% increase in the control group (excluding auto, gasoline station, food services and building material sales). As such, the details will be more upbeat than the headline reading.
Canada: Upcoming Key Economic Releases
Canadian Housing Starts - August
Release Date: September 11, 2017
Previous Result: 222k
TD Forecast: 195k
Consensus: 215k
Housing starts should slow to an annualized 195k in August from the 222k pace the prior month. Since May, residential construction has bucked the downward trend in the wider housing market due to the strength of multi-unit starts. While much of the slowdown in housing has been contained to the Greater Toronto Area (GTA), we think this uncertainty coupled with the Bank of Canada's decision to begin raising rates will start to weigh on the sentiment of developers. This was partially reflected in July building permits, where the value of permit issuance for multi-unit projects fell by 7.4% due to a sharp pullback in Toronto. As such, we expect most of the slowdown in residential construction to be concentrated in the multi-unit segment while single family construction could see a more modest deceleration towards 60k units.