
Sample Category Title
UK’s Service Sector Growth Slowed To Nearly 1-Year Low Level In August
For the 24 hours to 23:00 GMT, the GBP rose 0.88% against the USD and closed at 1.3041, as investors brushed-off disappointing UK services sector report.
Data indicated that Britain's Markit services PMI declined more-than-expected to a level of 53.2 in August, dipping to an eleven-month low level and suggesting that the nation's services sector, which initially withstood the shock of the Brexit vote, is losing momentum. Markets were anticipating the PMI to fall to a level of 53.5, compared to a reading of 53.8 in the previous month.
In the Asian session, at GMT0300, the pair is trading at 1.3036, with the GBP trading a tad lower against the USD from yesterday's close.
The pair is expected to find support at 1.2949, and a fall through could take it to the next support level of 1.2861. The pair is expected to find its first resistance at 1.3084, and a rise through could take it to the next resistance level of 1.3131.
In absence of any macroeconomic releases in the UK today, investor sentiment will be governed by global macroeconomic news.
The currency pair is trading above its 20 Hr and 50 Hr moving averages.

Japanese Yen Trading On A Weaker Footing This Morning
For the 24 hours to 23:00 GMT, the USD declined 0.98% against the JPY and closed at 108.62.
In the Asian session, at GMT0300, the pair is trading at 108.71, with the USD trading 0.08% higher against the JPY from yesterday’s close.
The pair is expected to find support at 108.29, and a fall through could take it to the next support level of 107.87. The pair is expected to find its first resistance at 109.34, and a rise through could take it to the next resistance level of 109.97.
Moving ahead, market participants will look forward to Japan’s flash leading and coincident indices for July, due to release tomorrow.
The currency pair is trading below its 20 Hr and 50 Hr moving averages.

Swiss Economy Grew Weaker-Than-Expected In 2Q 2017
For the 24 hours to 23:00 GMT, the USD declined 0.46% against the CHF and closed at 0.9539.
Macroeconomic data indicated that Switzerland's seasonally adjusted gross domestic product (GDP) rose less-than-expected by 0.3% on a quarterly basis in the second quarter of 2017, compared to a revised rise of 0.1% in the prior quarter, while markets were anticipating GDP to rise 0.5%. Moreover, the nation's consumer price index (CPI) remained flat on a monthly basis in August, meeting market expectations and compared to a drop of 0.3% in the prior month.
In the Asian session, at GMT0300, the pair is trading at 0.9549, with the USD trading 0.1% higher against the CHF from yesterday's close.
The pair is expected to find support at 0.9517, and a fall through could take it to the next support level of 0.9486. The pair is expected to find its first resistance at 0.9597, and a rise through could take it to the next resistance level of 0.9646.
The currency pair is trading below its 20 Hr and 50 Hr moving averages.

Loonie Trading Lower, Ahead Of BoC’s Interest Rate Decision
For the 24 hours to 23:00 GMT, the USD declined 0.36% against the CAD and closed at 1.2367.
In the Asian session, at GMT0300, the pair is trading at 1.2383, with the USD trading 0.13% higher against the CAD from yesterday's close.
The pair is expected to find support at 1.2343, and a fall through could take it to the next support level of 1.2302. The pair is expected to find its first resistance at 1.2417, and a rise through could take it to the next resistance level of 1.2450.
Ahead in the day, market participants will keep a close watch on Bank of Canada's interest rate decision, scheduled later in the day..
The currency pair is trading above its 20 Hr moving average and showing convergence with its 50 Hr moving average.

EUR/USD Daily Outlook
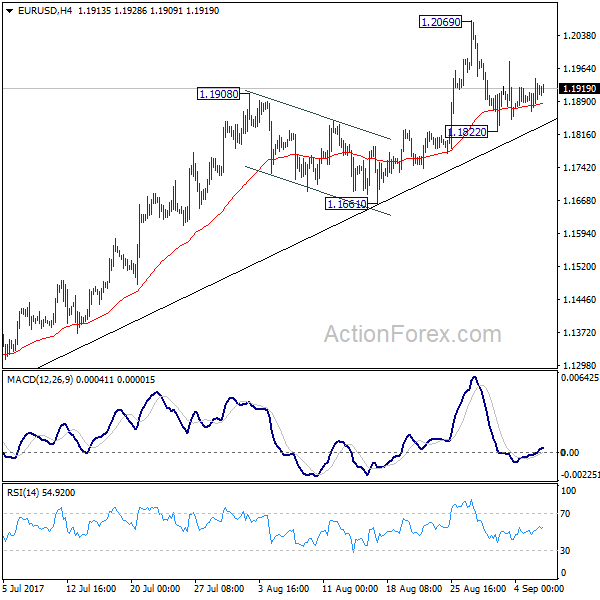
Daily Pivots: (S1) 1.1873; (P) 1.1906 (R1) 1.1946; More...
Intraday bias in EUR/USD remains neutral as it's still bounded in consolidation below 1.2069. Below 1.1822 will bring deeper fall. But after all, there is no clear sign of trend reversal yet. Outlook will remain bullish as long as 1.1661 holds. Break of 1.2069 will extend larger rise from 1.0339 to next key fibonacci level at 1.2516. Nonetheless, break of 1.1661 will bring much lengthier consolidation first.
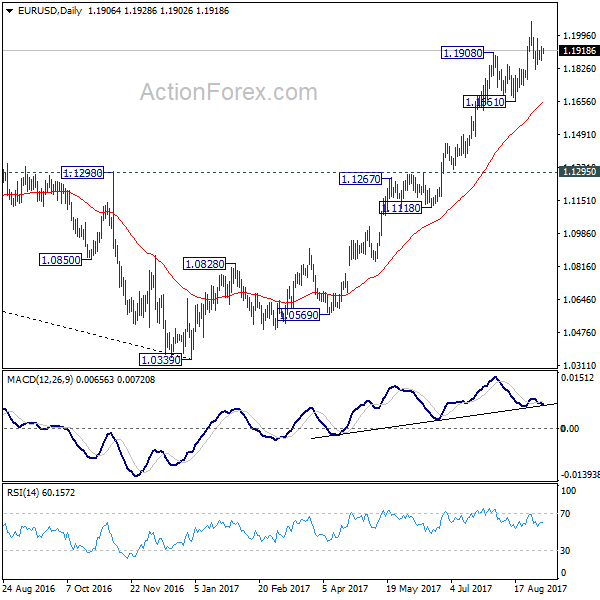
In the bigger picture, an important bottom was formed at 1.0339 on bullish convergence condition in weekly MACD. Sustained trading above 55 month EMA (now at 1.1774) will pave the way to key fibonacci level at 38.2% retracement of 1.6039 (2008 high) to 1.0339 (2017 low) at 1.2516. While rise from 1.0339 is strong, there is no confirmation that it's developing into a long term up trend yet. Hence, we'll be cautious on strong resistance from 1.2516 to limit upside. For now, medium term outlook will remain bullish as long as 1.1295 support holds, in case of pull back.
GBP/USD Daily Outlook
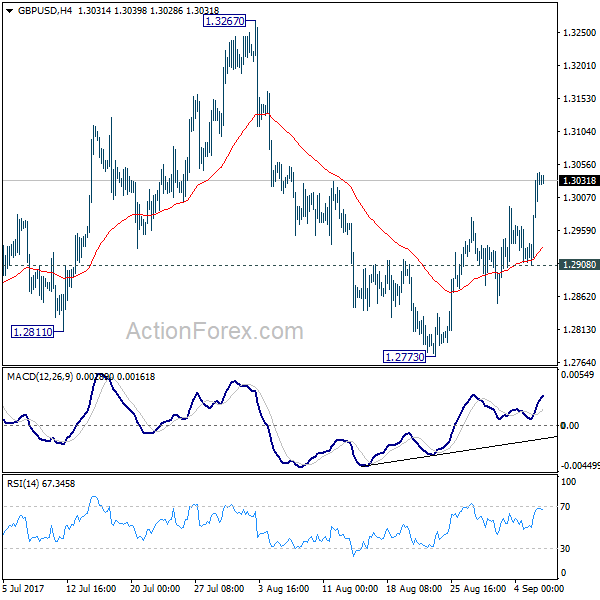
Daily Pivots: (S1) 1.2945; (P) 1.2993; (R1) 1.3079; More...
The break of 1.3030 minor resistance argues that pull back from 1.3267 has completed at 1.2773 already. Intraday bias is turned back to the upside for 1.3267 resistance. Break will target 1.3444 key resistance level next. Price actions from 1.1946 are still seen as a corrective pattern. Hence, we'd expect strong resistance from 1.3444 to limit upside to bring larger down trend reversal eventually. On the downside, below 1.2908 minor support will turn bias back to the downside for 1.2773.
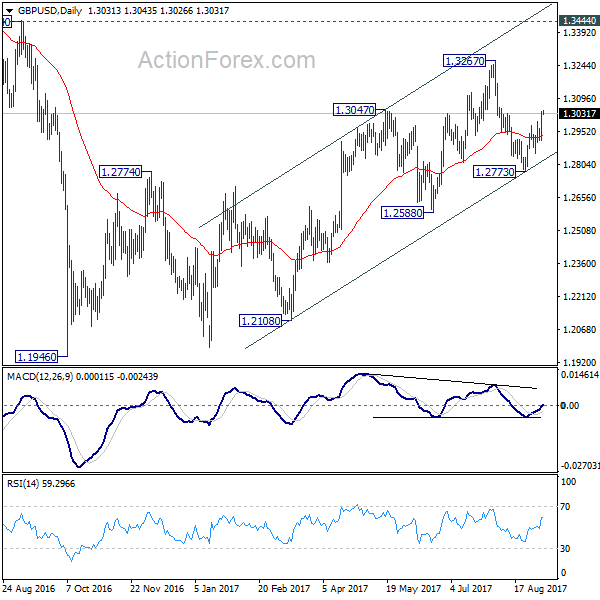
In the bigger picture, overall, price actions from 1.1946 medium term low are seen as a corrective pattern. While further rise cannot be ruled out, larger outlook remains bearish as long as 1.3444 key resistance holds. Down trend from 1.7190 (2014 high) is expected to resume later after the correction completes. And break of 1.2588 will indicate that such down trend is resuming.
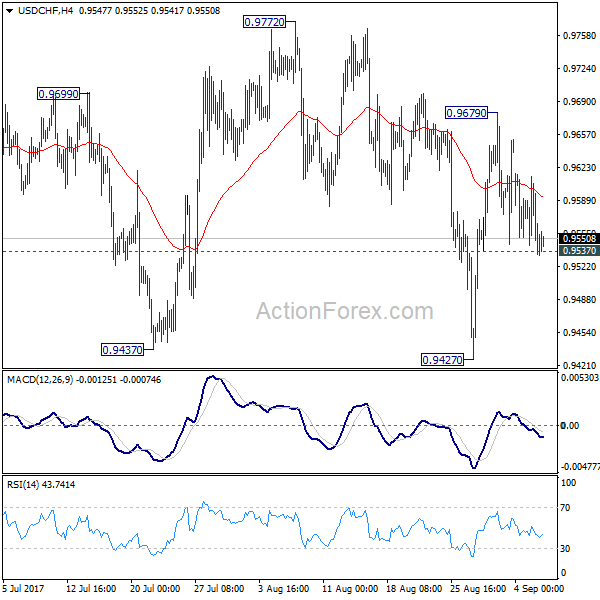
USD/CHF Daily Outlook
Daily Pivots: (S1) 0.9520; (P) 0.9566; (R1) 0.9599; More....
Intraday bias in USD/CHF remains neutral for the moment. On the downside, break of 0.9537 minor support will turn bias back to the downside for retesting 0.9427 first. Break of 0.9427 will resume whole decline from 1.3042. Meanwhile, considering it's close to to 0.9443 key support, consolidation from 0.9427 might extend further. But still, break of 0.9772 resistance is needed to confirm near term reversal. Otherwise, outlook stays bearish for another decline.
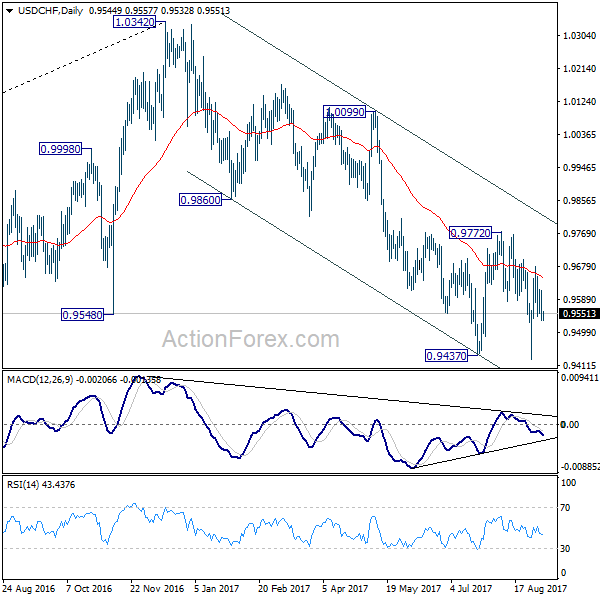
In the bigger picture, current development suggests that 0.9443 key support (2016 low) could be taken out firmly as down trend form 1.0342 extends. There are various interpretation of the price actions. But in any case, medium term outlook will stay bearish as long as 0.9772 resistance holds. Current down trend could extend to 38.2% retracement of 0.7065 (2011 low) to 1.0342 (2016 high) at 0.9090. However, break of 0.9772 will indicate that USD/CHF has successfully defended 0.9443 again and turn outlook bullish for 1.0099 resistance.
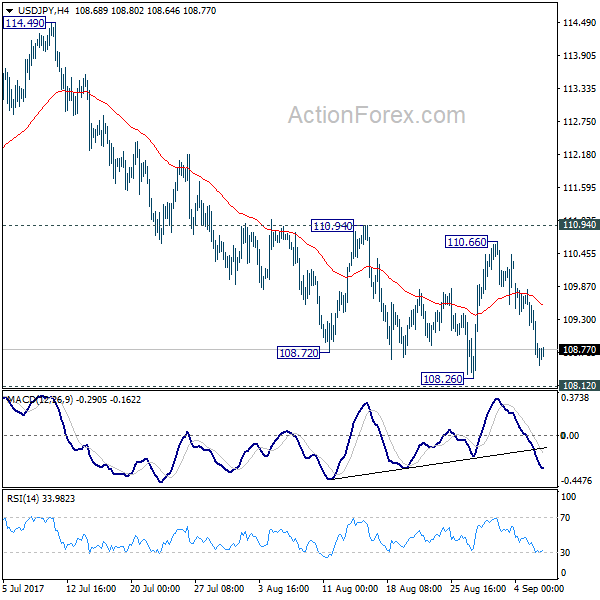
USD/JPY Daily Outlook
Daily Pivots: (S1) 108.34; (P) 109.09; (R1) 109.54; More...
No change in USD/JPY's outlook. Intraday bias remains on the downside for 108.12/26 support zone. Decisive break there will resume the whole corrective decline from 118.65. Next target will be 61.8% retracement of 98.97 to 118.65 at 106.48. In any case, outlook will remain cautiously bearish as long as 110.94 resistance holds.
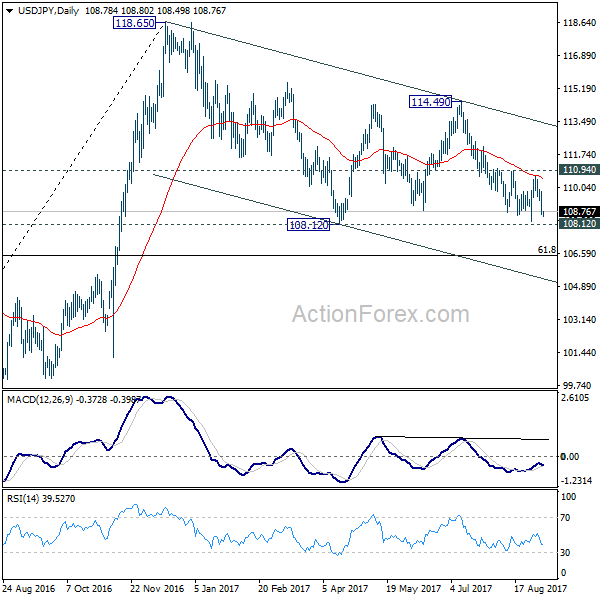
In the bigger picture, the corrective structure of the fall from 118.65 suggests that rise from 98.97 is not completed yet. Break of 118.65 will target a test on 125.85 high. At this point, it's uncertain whether rise from 98.97 is resuming the long term up trend from 75.56, or it's a leg in the consolidation from 125.85. Hence, we'll be cautious on topping as it approaches 125.85. If fall from 118.65 extends lower, downside should be contained by 61.8% retracement of 98.97 to 118.65 at 106.48 and bring rebound.
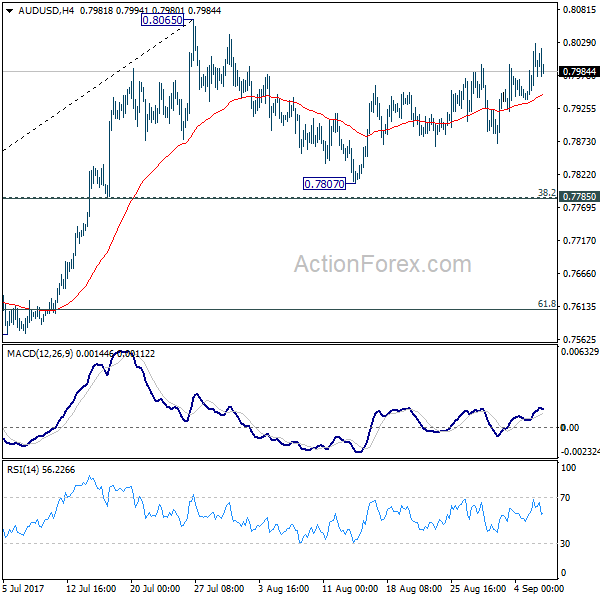
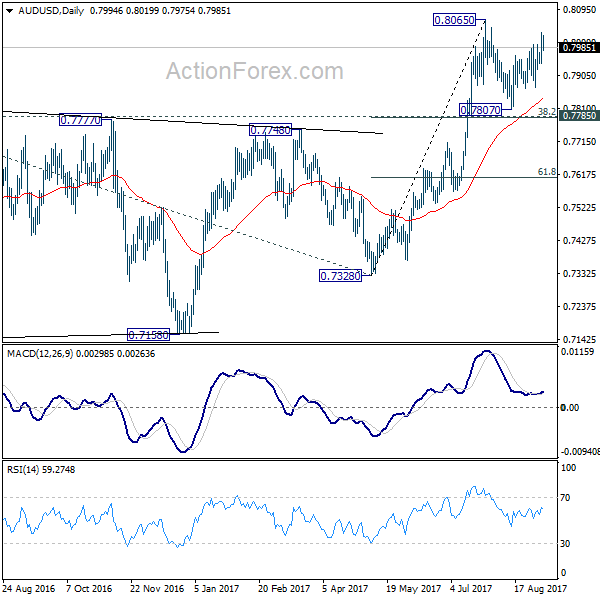
AUD/USD Daily Outlook
Daily Pivots: (S1) 0.7949; (P) 0.7989; (R1) 0.8035; More...
Intraday bias in AUD/USD remains neutral as it's staying in consolidation from 0.8065. In case of another fall, downside should be contained by 0.7785 cluster support (38.2% retracement of 0.7328 to 0.8065 at 0.7783) to bring rebound. On the upside, break of 0.8065 will resume the medium term rise and target 100% projection of 0.6826 to 0.7833 from 0.7328 at 0.8335.
In the bigger picture, rise from 0.6826 medium term bottom is still in progress. At this point, there is no confirmation of trend reversal yet and we'll continue to treat such rebound as a corrective pattern. But in any case, break of 55 month EMA (now at 0.8087) will target 38.2% retracement of 1.1079 to 0.6826 at 0.8451. Break of 0.7328 support is needed to confirm completion of the rebound. Otherwise, further rise is now in favor.
Dollar Talked Down By Dovish Fed Officials, Canadian Dollar Awaits BoC for Guidance
Dollar is trading as the weakest major currency for the week. Dovish comments from Fed officials are weighing on the greenback. Also stocks and yield played catch up after holding and suffered notable lost. DOW closed down -1.07% at 21753.31. 10 year yield dropped through last week's low, losing -0.087 to close at 2.070. 2.0 handle is starting to look vulnerable as recent decline extends.
Japanese Yen is trading as the strongest major currency for the week on mild risk aversion. USD/JPY, despite the selloff, is holding above last week's low at 108.26 so far. More notable move is seen in EUR/JPY, which drops through 129.65 minor support, which suggests more near term weakness. But that was mainly due to Euro's softness ahead of ECB meeting. That can also be seen in EUR/GBP which is extending near term fall from 0.9305.
In other markets, Gold turned into consolidation after hitting 1349.7 and is yet to take out 1350 handle firmly. WTI crude oil jumped to as high as 48.98 so far. But strength in oil is not transferred to Canadian Dollar yet as BoC rate announce looms.
Past Fed hike could have hurt the economy
Minneapolis Fed President Neel Kashkari, a known dove, warned that "it's very possible that our rate hikes over the past 18 months are leading to slower job growth, leaving more people on the sidelines, leading to lower wage growth, and leading to lower inflation and inflation expectations." And, these "premature rat hikes" are "not free". He criticized that Fed might be making "one of two fundamental mistakes". Firstly, Fed is "overestimating how tight the labor market is". secondly, Fed "allowed inflation expectations to drift lower".
Dallas Fed President Robert Kaplan while hurricane Harvey was a "significant" event, it doesn't change his view on the timing about unwinding Fed's USD 4.5T balance sheet. He maintain that Fed should start it "as soon as possible". But regarding another rate hike, Kaplan said that "I actually believe we should be patient here". Fed Governor Lael Brainard also said that Fed should be " cautious about tightening policy further until we are confident inflation is on track to achieve our target." She also noted that "there is a high premium on guiding inflation back up to target so as to retain space to buffer adverse shocks with conventional policy." And she emphasized that " it is important to be clear that we would be comfortable with inflation moving modestly above our target for a time."
Sufficient progress unlikely for Brexit negotiation before October
In UK, Brexit Secretary David Davis told the parliament that UK and EU continues to have "significant differences" over the divorce bill. And two sides have "very different legal stances" on the amount. Davis also said that "time pressure as a pressure point to put up against Britain". But he warned that it is "a pressure tactic to make us pay". Sabine Weyand, EU's deputy Brexit negotiator, told the Bundestag that she doesn't seen the chance of making sufficient progress for EU leaders to give a go to move on to trade agreement in October. The fourth round of talk is scheduled to being on September 18.
A draft document on UK's plan for post-Brexit immigration system was leaked to the Guardian and published. The proposals in the document are to be endorsed by ministers and subject to negotiation with EU. But it's also triggered much controversies as some believed that it targets low skilled EU migrants. Some MPs reacted furiously to the document as criticized it as a "mean and cynical approach". Chair of the home affairs select committee Yvette Copper said the document "seems to contradicts the home secretary's decision just over a month ago". Meanwhile, German MEP Elmar Brok, who's one of European Parliament's Brexit officials, warned that the proposal will " increase the lack of credibility and deepen mistrust". It would make it even harder to reach agreement on divorce by October.
BoC to stand pat and wait for October
The focus today is on the BoC meeting. Recent strong dataflow from Canada has raised bets for a rate hike this month. Real GDP growth accelerated to 4.5% in 2Q17, form 3.7% in the prior quarter. The improvement was significantly better than expected. However, inflation has stayed way below target. It would also be prudent for BoC to be more cautious over tightening the monetary policy as NAFTA talks remain highly uncertain. We expect policymakers to keep the policy rate unchanged at 0.75%, while a rate hike would be implemented in October. The surprisingly strong second quarter GDP growth would also lead the central bank to upgrade its economic forecasts at the October meeting.
Elsewhere
Japan labor cash earnings dropped -0.3% yoy in July. Australia GDP grew 0.8% qoq in Q2, in line with expectation. German factory orders and Eurozone retail PMI will be release in European session. Canada labor productivity and trade balance will be featured in US session. US will release trade balance, ISM services and Fed's Beige Book economic report.
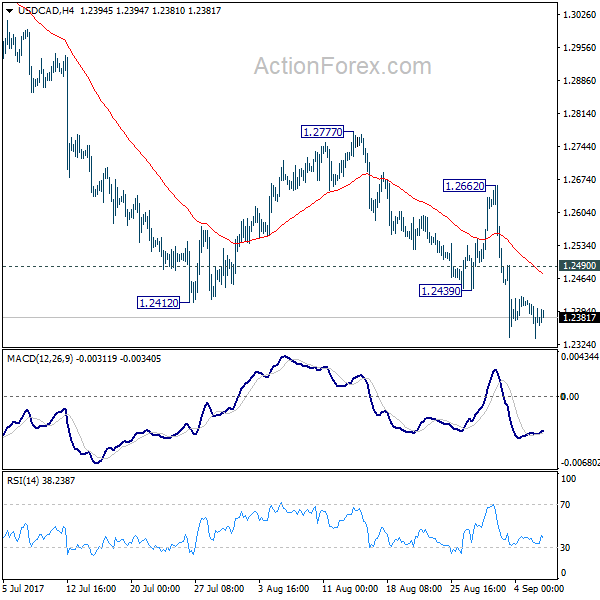
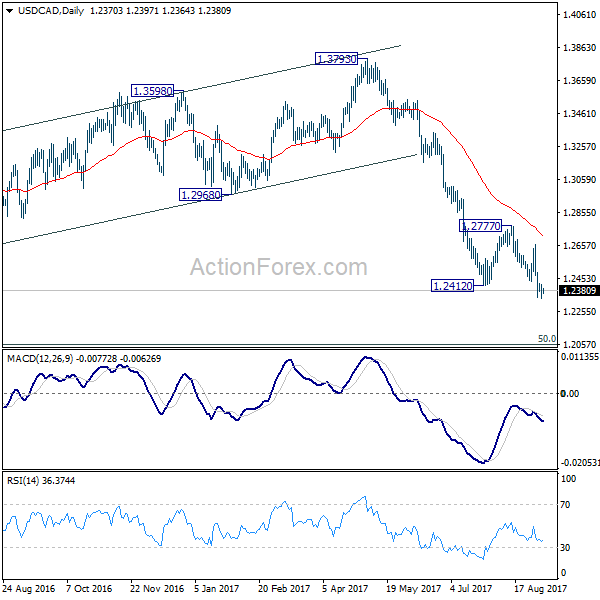
USD/CAD Daily Outlook
Daily Pivots: (S1) 1.2333; (P) 1.2375; (R1) 1.2415; More....
USD/CAD is losing some downside momentum as seen in 4 hour MACD. But still, with 1.2490 minor resistance intact, intraday bias stays on the downside. Current decline from 1.3793 (and 1.4689) is expected to continue and target next long term fibonacci level at 1.2048. On the upside, above 1.2490 will turn focus back to 1.2662. Break there will be the first sign of near term reversal.
In the bigger picture, price actions from 1.4689 medium term top are seen as a correction pattern. Such corrective fall is expected to extend to 50% retracement of 0.9406 to 1.4869 at 1.2048. At this point, we'd look for strong support from there to contain downside and bring rebound. Break of 1.2777 resistance will indicate reversal and turn outlook bullish for 1.3793 key resistance. However, sustained break of 1.2048 will carry larger bearish implications and bring deeper decline.
Economic Indicators Update
| GMT | Ccy | Events | Actual | Forecast | Previous | Revised |
|---|---|---|---|---|---|---|
| 0:00 | JPY | Labor Cash Earnings Y/Y Jul | -0.30% | 0.50% | -0.40% | |
| 1:30 | AUD | GDP Q/Q Q2 | 0.80% | 0.80% | 0.30% | |
| 6:00 | EUR | German Factory Orders M/M Jul | 0.20% | 1.00% | ||
| 8:10 | EUR | Eurozone Retail PMI Aug | 51 | |||
| 12:30 | CAD | Labor Productivity Q/Q Q2 | 1.40% | |||
| 12:30 | CAD | International Merchandise Trade (CAD) Jul | -3.8B | -3.6B | ||
| 12:30 | USD | Trade Balance Jul | -44.6B | -43.6B | ||
| 13:45 | USD | US Services PMI Aug F | 56.9 | 56.9 | ||
| 14:00 | CAD | BoC Rate Decision | 0.75% | 0.75% | ||
| 14:00 | USD | ISM Services/Non-Manufacturing Composite Aug | 55.5 | 53.9 | ||
| 18:00 | USD | Federal Reserve Beige Book |