
Sample Category Title
Dollar Talked Down By Dovish Fed Officials, Canadian Dollar Awaits BoC for Guidance
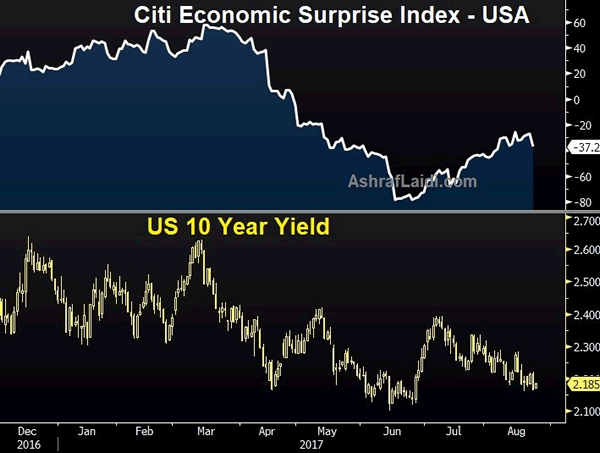
Dollar is trading as the weakest major currency for the week. Dovish comments from Fed officials are weighing on the greenback. Also stocks and yield played catch up after holding and suffered notable lost. DOW closed down -1.07% at 21753.31. 10 year yield dropped through last week's low, losing -0.087 to close at 2.070. 2.0 handle is starting to look vulnerable as recent decline extends.
Japanese Yen is trading as the strongest major currency for the week on mild risk aversion. USD/JPY, despite the selloff, is holding above last week's low at 108.26 so far. More notable move is seen in EUR/JPY, which drops through 129.65 minor support, which suggests more near term weakness. But that was mainly due to Euro's softness ahead of ECB meeting. That can also be seen in EUR/GBP which is extending near term fall from 0.9305.
In other markets, Gold turned into consolidation after hitting 1349.7 and is yet to take out 1350 handle firmly. WTI crude oil jumped to as high as 48.98 so far. But strength in oil is not transferred to Canadian Dollar yet as BoC rate announce looms.
Past Fed hike could have hurt the economy
Minneapolis Fed President Neel Kashkari, a known dove, warned that "it's very possible that our rate hikes over the past 18 months are leading to slower job growth, leaving more people on the sidelines, leading to lower wage growth, and leading to lower inflation and inflation expectations." And, these "premature rat hikes" are "not free". He criticized that Fed might be making "one of two fundamental mistakes". Firstly, Fed is "overestimating how tight the labor market is". secondly, Fed "allowed inflation expectations to drift lower".
Dallas Fed President Robert Kaplan while hurricane Harvey was a "significant" event, it doesn't change his view on the timing about unwinding Fed's USD 4.5T balance sheet. He maintain that Fed should start it "as soon as possible". But regarding another rate hike, Kaplan said that "I actually believe we should be patient here". Fed Governor Lael Brainard also said that Fed should be " cautious about tightening policy further until we are confident inflation is on track to achieve our target." She also noted that "there is a high premium on guiding inflation back up to target so as to retain space to buffer adverse shocks with conventional policy." And she emphasized that " it is important to be clear that we would be comfortable with inflation moving modestly above our target for a time."
Sufficient progress unlikely for Brexit negotiation before October
In UK, Brexit Secretary David Davis told the parliament that UK and EU continues to have "significant differences" over the divorce bill. And two sides have "very different legal stances" on the amount. Davis also said that "time pressure as a pressure point to put up against Britain". But he warned that it is "a pressure tactic to make us pay". Sabine Weyand, EU's deputy Brexit negotiator, told the Bundestag that she doesn't seen the chance of making sufficient progress for EU leaders to give a go to move on to trade agreement in October. The fourth round of talk is scheduled to being on September 18.
A draft document on UK's plan for post-Brexit immigration system was leaked to the Guardian and published. The proposals in the document are to be endorsed by ministers and subject to negotiation with EU. But it's also triggered much controversies as some believed that it targets low skilled EU migrants. Some MPs reacted furiously to the document as criticized it as a "mean and cynical approach". Chair of the home affairs select committee Yvette Copper said the document "seems to contradicts the home secretary's decision just over a month ago". Meanwhile, German MEP Elmar Brok, who's one of European Parliament's Brexit officials, warned that the proposal will " increase the lack of credibility and deepen mistrust". It would make it even harder to reach agreement on divorce by October.
BoC to stand pat and wait for October
The focus today is on the BoC meeting. Recent strong dataflow from Canada has raised bets for a rate hike this month. Real GDP growth accelerated to 4.5% in 2Q17, form 3.7% in the prior quarter. The improvement was significantly better than expected. However, inflation has stayed way below target. It would also be prudent for BoC to be more cautious over tightening the monetary policy as NAFTA talks remain highly uncertain. We expect policymakers to keep the policy rate unchanged at 0.75%, while a rate hike would be implemented in October. The surprisingly strong second quarter GDP growth would also lead the central bank to upgrade its economic forecasts at the October meeting.
Elsewhere
Japan labor cash earnings dropped -0.3% yoy in July. Australia GDP grew 0.8% qoq in Q2, in line with expectation. German factory orders and Eurozone retail PMI will be release in European session. Canada labor productivity and trade balance will be featured in US session. US will release trade balance, ISM services and Fed's Beige Book economic report.
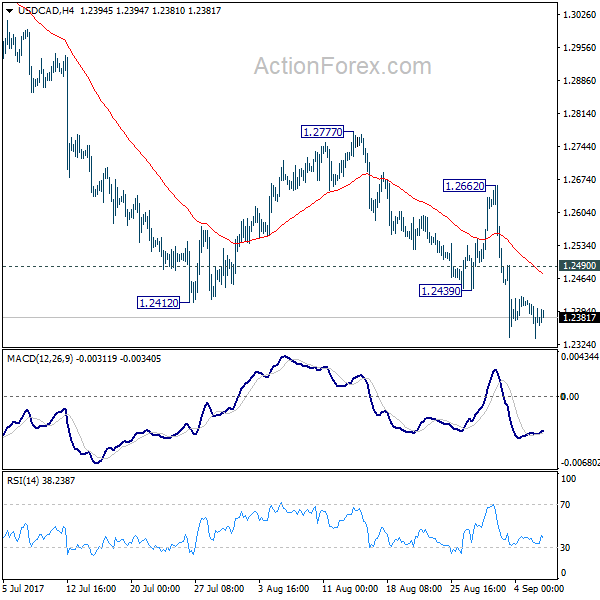
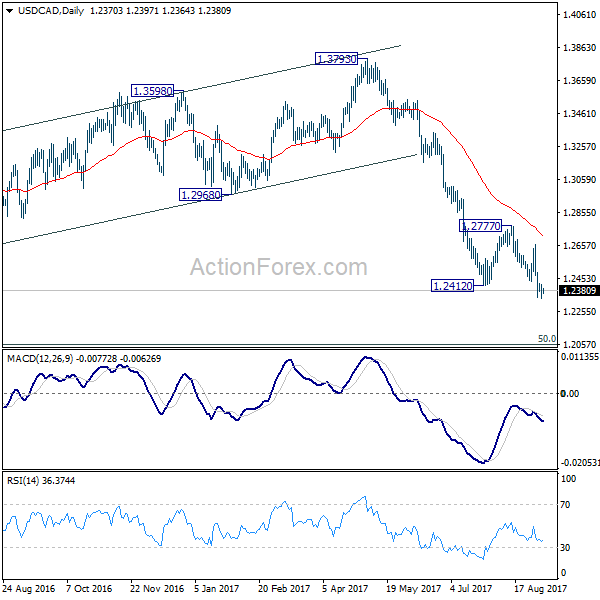
USD/CAD Daily Outlook
Daily Pivots: (S1) 1.2333; (P) 1.2375; (R1) 1.2415; More....
USD/CAD is losing some downside momentum as seen in 4 hour MACD. But still, with 1.2490 minor resistance intact, intraday bias stays on the downside. Current decline from 1.3793 (and 1.4689) is expected to continue and target next long term fibonacci level at 1.2048. On the upside, above 1.2490 will turn focus back to 1.2662. Break there will be the first sign of near term reversal.
In the bigger picture, price actions from 1.4689 medium term top are seen as a correction pattern. Such corrective fall is expected to extend to 50% retracement of 0.9406 to 1.4869 at 1.2048. At this point, we'd look for strong support from there to contain downside and bring rebound. Break of 1.2777 resistance will indicate reversal and turn outlook bullish for 1.3793 key resistance. However, sustained break of 1.2048 will carry larger bearish implications and bring deeper decline.
Economic Indicators Update
| GMT | Ccy | Events | Actual | Forecast | Previous | Revised |
|---|---|---|---|---|---|---|
| 0:00 | JPY | Labor Cash Earnings Y/Y Jul | -0.30% | 0.50% | -0.40% | |
| 1:30 | AUD | GDP Q/Q Q2 | 0.80% | 0.80% | 0.30% | |
| 6:00 | EUR | German Factory Orders M/M Jul | 0.20% | 1.00% | ||
| 8:10 | EUR | Eurozone Retail PMI Aug | 51 | |||
| 12:30 | CAD | Labor Productivity Q/Q Q2 | 1.40% | |||
| 12:30 | CAD | International Merchandise Trade (CAD) Jul | -3.8B | -3.6B | ||
| 12:30 | USD | Trade Balance Jul | -44.6B | -43.6B | ||
| 13:45 | USD | US Services PMI Aug F | 56.9 | 56.9 | ||
| 14:00 | CAD | BoC Rate Decision | 0.75% | 0.75% | ||
| 14:00 | USD | ISM Services/Non-Manufacturing Composite Aug | 55.5 | 53.9 | ||
| 18:00 | USD | Federal Reserve Beige Book |
USD/CAD Daily Outlook
Daily Pivots: (S1) 1.2333; (P) 1.2375; (R1) 1.2415; More....
USD/CAD is losing some downside momentum as seen in 4 hour MACD. But still, with 1.2490 minor resistance intact, intraday bias stays on the downside. Current decline from 1.3793 (and 1.4689) is expected to continue and target next long term fibonacci level at 1.2048. On the upside, above 1.2490 will turn focus back to 1.2662. Break there will be the first sign of near term reversal.
In the bigger picture, price actions from 1.4689 medium term top are seen as a correction pattern. Such corrective fall is expected to extend to 50% retracement of 0.9406 to 1.4869 at 1.2048. At this point, we'd look for strong support from there to contain downside and bring rebound. Break of 1.2777 resistance will indicate reversal and turn outlook bullish for 1.3793 key resistance. However, sustained break of 1.2048 will carry larger bearish implications and bring deeper decline.
Market Morning Briefing: Strength In The Yen
STOCKS
Dow (21753.31, -1.07%) fell sharply, in line with our doubts as mentioned yesterday. The effort to rise towards 22000 in the last 4-sessions has been invalidated in a single session yesterday, the most important issue being the geopolitical tensions with North Korea. However, the index may not break below 21675 just now and could see some recovery in the coming sessions. A break below 21675 would be an indication of a fresh fall for the medium term.
Dax (12123.71, +0.18%) tested 12200 on the upside but came off from there to close at 12123. Note that 12200-12300 region could be a decent resistance that could push the price back towards 12000 or lower in the near term.
Nikkei (19312.25, -0.38%) is trading at lower levels. There is a fair chance of eventually moving down towards 19100-19000 levels in the next few sessions. Near term looks bearish while the US-Japan 10YR differential (2.05%) is headed lower towards 1.9%. Dollar Yen could also continue to ove down if Nikkei and the yield spread falls sharply.
Shanghai (3366.17, -0.54%) could be trading within 3385-3350 levels for a few sessions, continuing to consolidate sideways.
Nifty (9952.20, +0.40%) was almost stable yesterday and as mentioned yesterday, could be trading within 9850-10050 region in the near term. Unless we see a break below 9800-9750, we remain bullish for the medium term.
COMMODITIES
Gold (1344) moved marginally higher as Dollar index failed to hold 92.50 levels and came down at 92.29 regions. Immediate trading range for Gold is 1280-1350 with an interim support at 1335. Gold is overbought in near term thus we are doubtful on the sustainability beyond 1350-55 regions . Similarly Silver (18.00) has also broken its resistance of 17.95 and heading towards 18.25 and 18.50 regions respectively, but it might face some rejection at 18.25 due to overbought condition. In the medium term, both Gold and Silver are out of their short term bearish channel but the supports of 1280 and 16.90 should hold to keep the bullish momentum intact.
Copper (3.138) moved marginally lower but it is still trading above its immediate support of 3.11-12 levels . The only concern in the short term overbought condition which could be resulted short term profit taking anywhere between 3.12-3.26 levels. But we will remain bullish on copper while it is trading above 2.88 levels in the medium term time frame.
Oil Price moved higher but both Brent (53.14) November contract at ICE and WTI (48.56) October contract at COMEX are trading within the ranges of 50-53.47 and 45.60-50.40 respectively. We will be bullish on the energy pack while Brent and WTI are trading above 52 and 48 regions respectively. We have U.S. Weekly oil inventory tomorrow which may add some more clarity into the price action.
FOREX
Dollar Index (92.31) is a stones's throw away from our target of 92.00. But, watch Resistance at 92.67 and 93.00 now. The downtrend since December could start unraveling if these are broken.
Although the chances of the Euro (1.1913) rising to 1.20 are still valid, the strength of the upmove could be waning. We have to keep an eye on Support at 1.1870-50 now. Need some carefulness here. Dovishness from Draghi tomorrow could lead to some Euro weakness.
The Euro-Yen (129.50) has come down to our target of 129.45. Now we need to see if the medium-term Support at 129.00 cited yesterday holds good or not. If it holds, we may see a fresh rise towards 131+ going into next week. But, there will be trouble if this Support breaks.
Strength in the Yen (108.70) emanates from the ongoing North Korean issue, which is also reflected in Gold rising to 1344. At the same time, there can be a hope of a rebound in Dollar-Yen if and while the horizontal Support region of 108.25-15 holds. Break thereof, however could be quite bearishness. Need to be very careful here also.
Sharp rise in the Pound (1.3035), breaking out of the indecisive range it has been in over the last few days. This could be significant. A Week Close above 1.30 could lead to a rise to 1.33.
Satisfying rise in the Aussie (0.7994), which saw a high of 0.8028 yesterday. Chances of eventual rise to 0.81 remain valid while above Support at 0.7950 now.
A bit of consolidation coming in on the Chinese Yuan (USDCNY = 6.5321) which bounced a bit from a low of 6.5150 yesterday. Dollar-Rupee (64.1225) may trade between 64.10-20 for some more time, but weakness in Equities could pull it abover 64.20. Be careful.
INTEREST RATES
Contrary to our yesterday's view, US T Bond yields moved lower along with the benchmark US 10Yr yield (2.06%) yesterday. the 10Yr yield might touch 1.97% as it is trading below 2.08 regions.
EUR/USD is hovering around 1.1900 levels as the German yields has been dipped along with U.S, keeping The German-US 2 Yr Spread (-2.10%)is stable at current levels.We have ECB press conference tomorrow at 6.00 pm IST, which may add some clarity towards the future price action in Euro.
Although not much movement has happened on the German-US 2Yr (-2.08%), the German-Us 10Yr (-1.73%) has risen sharply from channel support and looks strongly bullish just now. In case the spread continues to rise towards -1.70% or higher, it could pull Euro along to higher levels too. Watch the 10Yr spread closely.
Japan 10Yr yield (0.02%) has risen sharply by 2bps while the 30Yr (0.80%) and the 5Yr (-0.14%) are almost stable ust now with no directional clarity.
The US-Japan 10Yr differential (2.05%) has fallen sharply from interim resistance levels, in line with our expectation mainly due to fall in the US 10Yr yield. The spread could head towards 1.9% in the coming sessions indicating a fall in Dollar Yen and Nikkei too in the next few sessions.
The UK 5Yr and 30Yr Gilt Yields (5Yr 0.46% and 30Yr 1.62%) are maintaing their bullish momentum sice last few days.The UK 10Yr (1.07%) is also hovering around its crucial resistance of 1.07-08% levels and a close above that could open up 1.25 levels in medium term time frame.
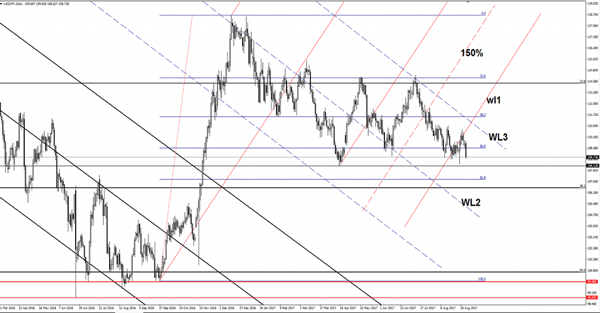
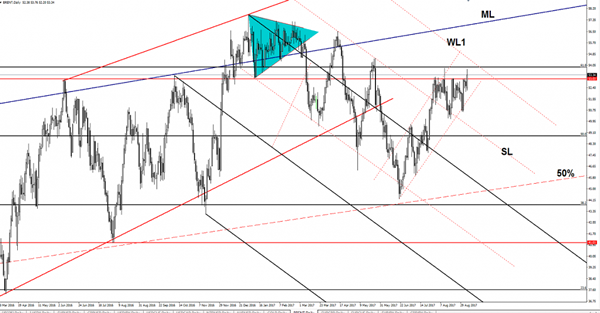
USD/JPY Too Heavy To Be Stopped
Price drops like a rock after the failure to stabilize above the warning line (wl1). The next downside target is at the 108.12 horizontal obstacle, but most likely will take this out as the Nikkei is under immense selling pressure. Should approach and reach the 61.8% retracement level and the long term 38.2% retracement level.
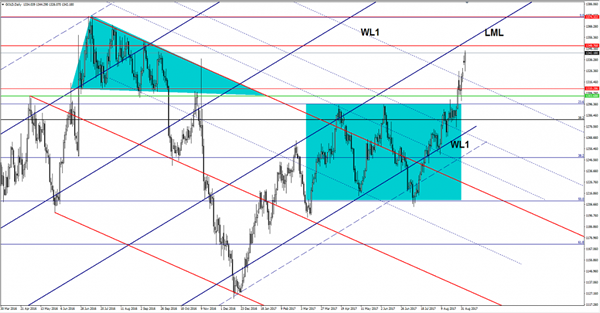
Gold Surges Thanks To Weaker Dollar
The yellow metal rallied in the US session and climbed much above the 1339 Monday’s high. You can see on the Daily chart that has failed to close the former gap up, signaling that the bulls are very strong. Should reach the $1348 per ounce and the lower median line (LML) of the major ascending pitchfork.
Brent Oil Crucial Breakout Underway
Brent Oil rallied and erased the last two day's losses. Is strong bullish on the daily chart also because the USD/CAD has touched fresh new lows on Tuesday. Technically should climb much higher on the short term after a false breakdown.
Brent has taken advantage of a weaker USD, as you already know, a weaker greenback makes the oil much cheaper for the international customers from outside the United States. The USD/CAD drop helped the oil to climb much higher, but we still need a confirmation that will resume this upside momentum.
You should be careful in the afternoon during the Canadian data release, the Trade Balance could drop further to -3.8B, while the Labor Productivity could increase by 0.9%. The main event will be the release of the Overnight Rate, the BOC is expected to leave the monetary policy unchanged, only a surprise could shake the price.
Price rallied and has managed to climb above the 53.03 major horizontal resistance, but failed once again to reach and retest the 61.8% retracement level. Now has retreated a little and could retest the broken static resistance before will climb much higher. Only a false breakout will signal a reversal on the short term.
Brent continues to move higher within the ascending channel, so it should climb towards new peaks in the upcoming period. However, only a valid breakout above the warning line (wl1) and above the 61.8% retracement level will confirm an increase towards the major upside target from the median line (ML).
Bank Of Canada Expected To Hold Steady
USD struggling with geopolitical, political and natural storms
The USD is lower against most majors after disappointing economic data, political turmoil at home and abroad and dovish rhetoric from Fed members. Markets are now pricing in close to 100 percent chance of the interest rate staying at 100–125 basis points in September and 31.3 percent of a rate hike December, in early August that probability was 42.81 percent.
The Canadian dollar touched a 26 month high versus the US dollar ahead of the Bank of Canada (BoC) meeting. The Bank of Canada (BoC) will be publishing a rate statement on Wednesday, September 6 at 10:00 am EDT. While no rate change is expected, a hawkish statement could be present as Canadian economic indicators have been stronger than forecasted. Canadian GDP for the second quarter destroyed expectations with a 4.5 percent quarterly growth. The strength of the economy has put a second rate hike to the Canadian benchmark rate firmly on the table but with timing issues that would make the October meeting more suitable for that type of announcement.
Central banks will feature prominently this week with the Reserve Bank of Australia (RBA) already keeping rates on hold on earlier today. In what has been an overriding theme for all major central banks the RBA mentioned weak wage growth and low inflation, but with growth still on target for this year. After the BoC on Wednesday, the next major central bank to hold court will be the European Central Bank (ECB) on Thursday.
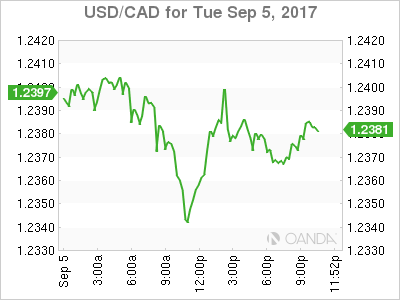
The USD/CAD fell 0.21 percent in the last 24 hours. The currency pair is trading at 1.2387 ahead of the interest rate decision on Wednesday by the Bank of Canada (BoC). The Canadian central bank is not expected to raise rates at this meeting, but there is growing probability that they will do so before the end of the year, most likely in October.
The timing of the monetary policy decision is down to uncertainty on what other central banks will do in September. This month could prove crucial for the Fed if it announces the start date of its balance sheet reduction plan. Despite the internal debates about rate increases, all Fed members seem to agree on lowering the size of the balance sheet. The only delay could come if policy makers see no chance of a rate hike in December and instead leave the start of reducing the bond repurchases until the end of the year.
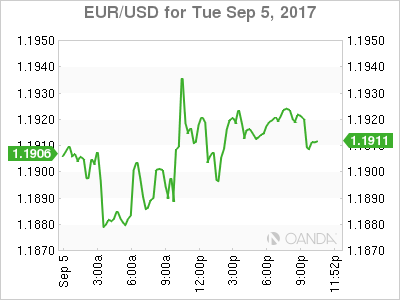
EUR/USD rose 0.088 on Tuesday. The single currency is trading at 1.1912 after North American markets restarted after the labor day holiday. The USD lost ground versus the EUR after political turmoil, soft data and dovish comments from Fed members took a toll on the currency.
Safe haven flows saw the USD back to an oversold position as traders are weighing all the factors in the market and for now the resulting picture is not a positive one for the greenback. A weak US jobs report on Friday and comments from known doves Brainard and Kashkari has put a giant question mark around another rate hike form the Fed this year.
The European Central Bank (ECB) will be front and center this week as it could announce the schedule for its quantitative easing program tapering. Sources from within the central bank came out right after the release of the U.S. non farm payrolls (NFP) stopped the rise of the currency pair above 1.20 by saying the tapering could happen until the end of the year.
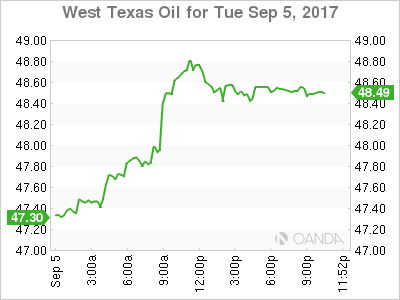
West Texas Intermediate rose 2.586 percent in the last 24 hours. The price of WTI crude is trading at 48.55 after refineries that were hit by Hurricane Harvey are slowly coming back online. With higher refinery capacity available crude prices recovered and gasoline prices have come down. The tropical storm at one point closed down about a quarter of the US refining capacity.
Next on the storm watch is Hurricane Irma which could hit Gulf platforms near Florida, which could hurt US supply of crude acting as a catalyst for higher prices if its a substantial disruption.
Market events to watch this week:
Wednesday, September 6
8:30 am CAD Trade Balance
10:00 am CAD BOC Rate Statement
10:00 am CAD Overnight Rate
10:00 am USD ISM Non-Manufacturing PMI
9:30 pm AUD Retail Sales m/m
9:30 pm AUD Trade Balance
Thursday, September 7
7:45 am EUR Minimum Bid Rate
8:30 am EUR ECB Press Conference
8:30 am USD Unemployment Claims
11:00 am USD Crude Oil Inventories
Tentative CNY Trade Balance
Friday, September 8
4:30 am GBP Manufacturing Production m/m
8:30 am CAD Employment Change
Dollar Wobbles Like A Bop Bag
Dollar Wobbles like a Bop Bag
A further escalation of the North Korea set of circumstances as another missile test looms coupled with both Russia and China expressing little appetite to concede to strong sanctions, has left the global markets engulfed by geopolitical turmoil and in a state of heightened risk aversion.
US traders returning from the labour day weekend wasted little time to catch up on the weekend N.Korea headlines driving both US equities and bond yields lower. Predictably this had a spillover effect on the FX markets, as traders continued to take shelter under the JPY and CHF umbrellas. Without question, it was the Trump Tweet :
– 'I am allowing Japan & South Korea to buy a substantially increased amount of highly sophisticated military equipment from the United States.'
That sparked the initial bid on US Treasuries and started the ball rolling south on USDJPY, but it was Lael Brainard that left the dollar wobbling and as prone as bop bag. While traders have grown accustomed to Brainard overly dovish banter but it was her unwavering comments regarding inflation or the lack thereof that caught the most attention.
– ' We have been falling short of our inflation objective not just in the past year, but over a longer period as well. My view is that we should be cautious about tightening policy further until we are confident inflation is on track to achieve our target.'
While the risk aversion play is certainly weighing on USDJPY, it’s impossible to factor in just how much geopolitical risk should be priced into the current calculus given that recent headline flare ups have ended quickly, but an unabashedly dovish Fed Brainard was unquestionably the reason for the deeper USDJPY move into the 108’s.
Fed members will continue to roll out this week, Kaplan on Tuesday and Meister on Thursday but it will likely be up to Dudley on Friday to do the heavy lifting for the interest rate normalisation crowd.
The powerful New York Fed President Dudley is part of the Fed troika including Yellen, Fischer and is widely considered a key member of the Fed’s inner sanctum so that traders will side with his speech as the most significant of the lot. But whether he does provide some solace for both the rates and USD market is questionable after his decidedly guarded August 10 delivery.
Euro
The Euro remains a bit of a sideshow to the broader risk aversion narrative, and ECB uncertainty over the balance sheet taper timing is keeping bulls at bay.The pair remains in consolidation mode ahead of Thursdays key ECB.
Japanese Yen
Brainard’s dovish delivery has slid the buy on dip bids down to the all important 108.25-45 support levels as dwindling support remains for some Fed relief for the rates markets. However, with the geopolitical overhang keeping short term trader selling on rallies, the top side should remain limited in today’s APAC session.
Australian Dollar
Markets ignored the RBA statement as expectedly there was little new on offer but with both the stronger Q2 exports and a buoyant China PMI fresh in traders minds, Brainards dovish lean was all it took to send the AUD ripping higher.
But somehow this sense of deja vu is setting in with Copper and base metals prices looking elongated and with a consistent RBA policy that likely remains on hold indefinitely, there will be some wood to chop to take out the key .8050 level. Domestic focus is on Q2 GDP that has a penchant to surprise on the upside. Could be an interesting session for the Aussie.
New Zealand Dollar
With all eyes in JPY and safe have flow, the underdog NZD was the best performer during the Fed inspired USD weakness, likely driven by short covering as the market was looking for excuses to sell the dollar when the soft US durables report sealed the greenbacks fate in NY trade.
A Win For Soft Data?
As we head closer to US jobless claims today and the Jackson Hole speeches tomorrow, let's recognize the recent decent US data. Yesterday's release of the US Markit service sector index rose to its best level since April 2015 in a sign the US economy could finally be turning a corner. The 9% decline in US new home sales was partly due inventories. NZD was the biggest loser over the last 24 hours. The Premium long in EURNZD was closed at 1.6350 for a 240-pip gain as the pair hit a 14-month high.
The main US dollar trade remains politics. As soon as it looked like Candidate Trump was fading away, he reappeared at a rally Tuesday night and threaten to shut down the government if his border wall wasn't funded. That was the main driver in markets and led to a round of USD selling that erased the USD/JPY gains from the day before.
We see no end to the drama in US politics but some stability in the White House is just one way the dollar could recover. Another is a pickup in growth. The Markit services PMI hit an 18-month high at 56.9 compared to 55.0 expected and 54.7 previously. We have long lamented the divergence in hard and soft economic data in the past year. The post-election bump in surveys just hasn't translated into genuine improvement.
But the Markit number is an outlier. It hardly climbed after the election then slid early in the year. More recently gained steadily before surging in the August data. There is no reason to believe Markit's data is superior but they were able to avoid the election trap. Maybe it's a sign that pent up demand, credit and a softer currency are helping. In addition, the 'prices charged' component rose to the highest since Sept 2014.
The big move outside of the dollar was in the kiwi as it slumped on soft pre-election growth forecasts. NZD/JPY broke down in a potentially-ominous sign for risk assets. EUR/NZD and NZDCAD were also notable movers.
Fed chair Yellen's speech in Jackson Hole tomorrow is at 10 am ET (3 pm London) is likely to focus on regulation, she could well mention the latest economic conditions. The same goes for Draghi, who is due to speak 5 hours later.
Gold Posts Gains as North Korea Tensions Continue
Gold prices are up on Tuesday. In the North American session, gold is trading at $1338.03, up 0.25% on the day. On the release front, US Factory Orders in July declined 3.3%, matching the estimate. This marked the sharpest decline since August 2014. Federal Reserve member Lael Brainard spoke earlier in the day, and two other FOMC members, Neel Kashkari and Neel Kashkari, will be delivering remarks later in the day. On Wednesday, the US releases ISM Non-Manufacturing PMI, with an estimate of 55.5 points.
Geopolitical tensions often pushes up the price of gold, which is considered a safe-haven asset in times of trouble. This has been the case with the crisis in North Korea, which has lifted gold to 12-month highs. On Monday, North Korea's announcement that it had exploded a hydrogen bomb which could be fitted to an intercontinental ballistic missile. Although the claim has yet to be verified by Western analysts, it is clear that this nuclear device test has ratcheted tensions between North Korea and the US, Japan and South Korea. The International Atomic Energy Authority responded by labeling North Korea as a 'global threat', and US President Trump announced on Tuesday that he would increase weapon sales to Japan and South Korea. As tensions between Washington and Pyongyang have increased, the drop in risk appetite is driving investors to the safe-haven yen. If the crisis in the Korean peninsula worsens, we can expect gold to continue to rise, as nervous investors flock to the metal.
Last week's disappointing US employment numbers wasn't lost on the Federal Reserve, as FOMC member Leal Brainard sent out a pessimistic message on Tuesday. Brainard noted that inflation remained "well short" of the Fed's target of 2%, and urged the Fed to act cautiously and resist raising interest rates until inflation moves higher. Brainard did acknowledge the rebound in the US economy, saying that the economy was on "solid footing". A December rate hike remains very much in doubt, with odds of an increase at just 30%. With the likelihood of a rate hike pegged at less than 2% at next week's policy meeting, the markets will be focusing on the Fed's balance sheet, which stands at $4.2 trillion. Earlier in the year, the Fed outlined plans to reduce the balance sheet, and analysts expect further details at the September meeting.