Sample Category Title
Pound Pushes Higher as US Factory Orders Tumble
The British pound has posted considerable gains in the Tuesday session. In North American trade, GBP/USD is trading at 1.3027, up 0.76% on the day. On the release front, British Services PMI eased to 53.2, short of the estimate of 53.5 points. US Factory Orders in July declined 3.3%, matching the estimate. Still, the tumble marked the sharpest decline since August 2014. Federal Reserve member Lael Brainard spoke earlier in the day, and two other FOMC members, Neel Kashkari and Neel Kashkari, will be delivering remarks later in the day. On Wednesday, the US releases ISM Non-Manufacturing PMI, with an estimate of 55.5 points.
Last week's disappointing US employment numbers wasn't lost on the Federal Reserve, and FOMC member Leal Brainard sounded pessimistic on Tuesday. Brainard noted that inflation remained "well short" of the Fed's target of 2%, and counseled caution before raising interest rates until inflation is on its way upwards. Brainard acknowledged the rebound in the US economy, saying that the economy was on "solid footing". A December rate hike remains very much in doubt, with odds of an increase at just 30%. With the likelihood of a rate hike pegged at less than 2% at next week's policy meeting, the markets will be focusing on the Fed's balance sheet, which stands at $4.2 trillion. Earlier in the year, the Fed outlined plans to reduce the balance sheet, and analysts expect further details at the September meeting.
Geopolitical tensions often move the currency markets, so the crisis in North Korea is being carefully monitored. On Monday, North Korea's announcement that it had exploded a hydrogen bomb which could be fitted to an intercontinental ballistic missile. Although the claim has yet to be verified by Western analysts, it is clear that this nuclear device test has ratcheted tensions between North Korea and the US, Japan and South Korea. The International Atomic Energy Authority responded by labeling North Korea as a 'global threat', and US President Trump announced on Tuesday that he would increase weapon sales to Japan and South Korea. As tensions between Washington and Pyongyang have increased, the drop in risk appetite is driving investors to the safe-haven yen. If the crisis in the Korean peninsula continues, the US dollar could lose ground against the pound and other major currencies as nervous investors look for alternatives to the greenback.
Swiss Economic Growth Remains Muted in Q2
Real GDP growth in Switzerland came in below expectations in Q2 on top of downward revisions to Q1. With inflation still low, the Swiss National Bank is unlikely to tighten monetary policy anytime soon.
Another Disappointing GDP Print in Switzerland
Data released this morning revealed that real GDP in Switzerland grew 0.3 percent in Q2 (1.1 percent annualized), undershooting consensus expectation for 0.5 percent sequential growth (top chart). On a year-overyear basis, real GDP in Switzerland is up just 0.3 percent, the slowest pace since 2008.
The external sector accounted for much of the slowdown in growth in Q2. Imports of goods excluding valuables surged 5.5 percent in the quarter, while imports of services also increased a solid 1.7 percent. Exports of goods excluding valuables saw a much smaller 0.5 percent gain, and exports of services outright declined for the second consecutive quarter. Despite the drag from trade in this morning's print, a weaker currency and stronger economic growth throughout the Eurozone should help provide a boost to Swiss exports in the coming quarters, all else equal.
The strong growth in imports was indicative of healthier domestic demand than the headline would suggest. All components of domestic demand gained over the quarter, with the biggest jump coming in construction investment. Private consumption expanded moderately, boosted by spending on healthcare, housing and energy, and restaurants and hotels. The manufacturing sector, which accounts for about 18 percent of value added, has faced a challenging environment amid the stronger currency and weaker growth abroad. Recently, however, the Swiss manufacturing purchasing managers index surged to a six-year high. Supply-side data from this morning showed manufacturing output growing a solid 0.9 percent in Q2, helping to corroborate the improvement in sentiment.
Central Bank Outlook: SNB Likely to Lag ECB
Against this relatively weak economic backdrop, price growth in Switzerland has managed to escape deflation territory (middle chart). Even with the recent gains, however, inflation remains remarkably modest; core CPI inflation was 0.4 percent in August, which was the highest reading since March 2011. Year-ago consumer price growth has averaged -0.3 percent over the past five years, so the Swiss National Bank (SNB) may want to wait and ensure that inflation expectations are well-anchored above zero percent before making any major changes to monetary policy.
Our currency strategy team looks for the Swiss franc to strengthen versus the U.S. dollar amid generalized greenback weakness. Against the euro, however, our currency team expects a continued slide in the value of the franc. Economic growth in the Eurozone and Switzerland has diverged, and the SNB has signaled that it still believes the franc is overvalued (bottom chart). As such, the SNB will likely lag the European Central Bank in its efforts to start removing monetary policy accommodation.
Dollar Drifts Lower vs Majors amid War Risks; Aussie, Kiwi Posts Fresh Highs
The dollar extended its losses against a basket of major currencies during the European session as US markets returned from holidays, pricing the heightened geopolitical risks as well as the dovish comments from the Fed's Lael Brainard. While the dollar was losing ground, the aussie and its cousin the kiwi hit fresh highs after the RBA governor Philip Lowe supported that the current monetary policy is appropriate given the risks of the already overloaded household debt.
Geopolitical risks continued weighing heavily on the markets as the latest news indicated that the US president agreed to provide financial support of billions of dollars for new weapon sales to South Korea. Meanwhile, the US ambassador to the United Nations argued for more sanctions against the North Korean regime. This came after the South Korean Business Daily reported that Pyongyang was planning to fire an intercontinental ballistic missile (ICBM), as suspicious moves of a rocket described as an ICBM towards the west coast of North Korea, were observed early today.
Besides that, dovish comments from Lael Brainard – a Fed Board of Governors member – on Tuesday added to the dollar's losses. Brainard, a permanent voter, said in her speech in New York that Fed policymakers should be cautious on monetary policy tightening as this should be done only if inflation shows clear signs of heading towards the Fed's target of 2%.
In terms of data, US factory orders released in late European session failed to give support to the dollar. As expected, factory orders for the month of July declined by 3.3% m/m compared to a growth of 3.2% seen in June, which was upwardly revised from 3.0%.
While investors were giving up riskier assets, the dollar index dropped to an intra-day low of 92.21, while the safe-haven yen gained on increasing demand. Dollar/yen fell to a one-week low of 108.98, down by 0.67% during the day.
The euro edged higher to $1.1928 on the back of a weaker dollar, before the European markets' close. Previously the common currency was trending lower as Markit composite PMI readings for the month of August and July's retail sales moderated. Moreover, investors will be focused for hints on the ECB's monetary policy on Thursday when the central bank will complete its two-day policy meeting.
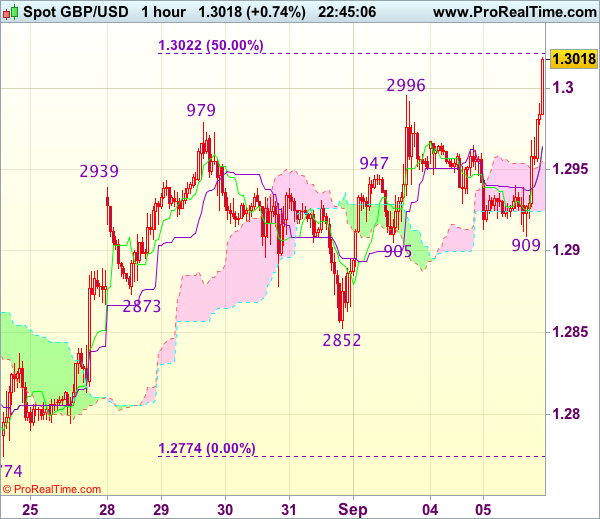
Pound/dollar jumped above the 1.30 key level, gaining on the back of a weaker dollar despite service PMI readings published earlier came in disappointing.
In Australia, RBA Chief Philip Lowe, following the central bank's decision to keep cash rates unchanged at their record lows of 1.5% early in the Asian trading, claimed that the current monetary policy is "appropriate" as this strategy balances the risks of a rising household debt which fluctuates at high levels. Moreover, the central banker argued that the status of the Australian economy is far away from that under full employment conditions, while inflation is pressured below the mid-point of the target range of 2-3%. However, the monetary statement revealed that the RBA maintains its positive view on the country's economic outlook.
The aussie surged to a one-month high of $0.8027 before it slipped to $0.8017 in late European trading, while the kiwi which is positively correlated with its Australian cousin reversed the previous week's losses, climbing to $0.7251.
The commodity-linked loonie remained in an uptrend relative to the greenback, approaching the 2 ½-year high reached on September 1, ahead of the Bank of Canada's policy meeting tomorrow, where investors project the BOC to hold rates unchanged. Dollar/loonie was trading 0.60% lower in the day at 1.2342.
In commodities, oil extended its recovery. WTI was trading at $48.76 a barrel during afternoon European trading hours, up 3.1% on the day. Brent was at $53.43, rising by 2.1%. Gold was 0.2% up and close to the $1,337 an ounce level. Yesterday it rose to an 11-month high of $1,339.52, gaining on the back of geopolitical uncertainty.
EUR/USD Keeps Consolidating Within Triangle
The euro today was under pressure due to a slight decline in the Flash Services PMI in the euro area that decreased by 0.2 to 54.7 in August. At the same time retail sales in July reduced by 0.3% against the forecasted fall of 0.2% and following June's increase of 0.6%. The amplitude of price fluctuations is falling and after the end of consolidation we may see a sharp spike in volatility. Investor activity is still restrained in anticipation of the ECB's decision on monetary policy. On one hand, we have the central bank officials' fears over the negative impact of an appreciating euro on economic expansion in the monetary union. And on the other hand, some experts are predicting cuts to the asset purchasing program in the Eurozone from the current 60 billion a month to 40 billion. If the cuts do come through it will give additional stimulus to the bulls to push the common currency upwards. European Central Bank President Mario Draghi is due to speak on Thursday.
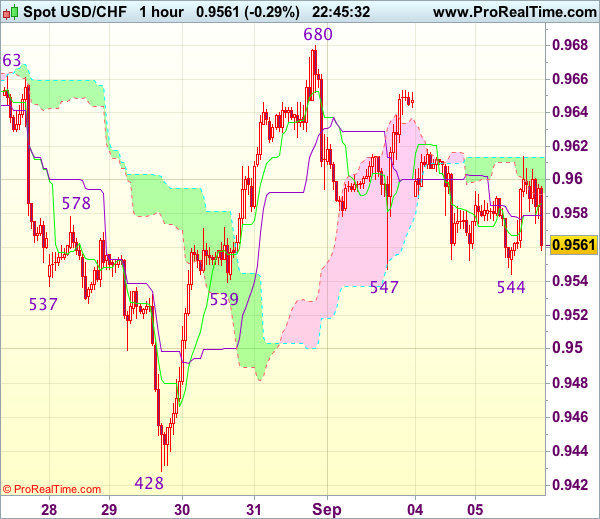
The USD/CHF was under pressure from the slower than expected GDP growth in Switzerland that was only 0.3% in the second quarter against an anticipated expansion of 0.5%. The demand for the Swiss franc remains strong due to geopolitical tensions caused by the crisis on the Korean peninsula.
The Australian dollar demonstrated confident growth on the background of strong statistics from China where the Caixin Service PMI grew to 52.7 in August versus the 51.8 forecasted. The Reserve Bank of Australia gave a boost to the aussie dollar with positive assessments for both Gross Domestic Product growth and for labour market conditions in Australia.
EUR/USD
The single currency keeps consolidating within the limits of the triangle and after the price fixing beyond its limits we are likely to see a strong movement. In order to continue rising to reach the immediate goals at 1.2000 and 1.2070, the quotes need to overcome 1.1925. Breaking through the local low at 1.1850, on the other hand, may become a trigger for continued declines to 1.1750 and 1.1620.
USD/CHF
The USD/CHF rebounded from strong support at 0.9540 and in case of further growth, the next target will be near the inclined resistance and at the 0.9700 mark. Overcoming the closest support at 0.9540 may force the bears to pull the quotes down to 0.9430.
AUD/USD
The AUD/USD after a confident rising impulse may show a downward correction. One of the factors pointing to this probability is the RSI on the 15-minute chart being in the overbought zone. The potential correction may be limited by the angled support. For the local trend to change to negative, the quotes need to break through the 0.7940 level that coincides with the closest low.
WTI Oil Price Surged as Refineries in the Gulf of Mexico Gradually Restart
WTI oil price surged on Tuesday as refineries in the Gulf of Mexico started to gradually restart after being shut down by Hurricane Harvey.
Demand for crude oil started to raise on restart of refining capacities and boosted oil price.
Fresh acceleration took out important barrier at $47.99 (daily Kijun-sen) and met next target at $48.72 (18/21 Aug tops), signaling further retracement of $50.41/$45.57 descend), as rally broke above its Fibo 61.8% retracement at $48.56.
Close above the latter is needed to confirm and turn near-term focus towards psychological $50.00 barrier.
Daily studies turned into positive setup on the latest rally and along with bullish fundamentals are supportive for further advance.
Oil price is eyeing initial barrier at $49.65 (200SMA) which guards $50.00 target and recent highs at $50.18/20 (weekly cloud top / 10Aug high) and $50.41 (01 Aug peak).
Profit taking on today's strong rally and overbought studies could trigger corrective easing, with broken Kijun-sen, now reverted to support, expected to ideally contain dips.
Res: 49.27; 49.65; 50.00; 50.20
Sup: 48.56; 47.99; 47.42; 47.15
Dollar Dips Below 109 as US Factory Orders Slide, N. Korea Tensions Climb
USD/JPY has posted considerable losses in the Tuesday session. In North American trade, the pair is trading at 108.86, down 0.76% on the day. On the release front, US Factory Orders in July declined 3.3%, matching the estimate. Still, the tumble marked the sharpest decline since August 2014. As well, three Federal Reserve FOMC members are speaking during the day – Lael Brainard, Neel Kashkari and Neel Kashkari. The sole Japanese event is Average Cash Earnings, which is expected to rebound 0.5%. On Wednesday, the US releases ISM Non-Manufacturing PMI, with an estimate of 55.5 points.
The yen continues to show volatility due to the ongoing North Korean crisis, as the safe-haven asset has been in demand following hostile moves by North Korea. This was again the situation on Monday, as the yen briefly improved following North Korea's announcement that it had exploded a hydrogen bomb which could be fitted to an intercontinental ballistic missile. Although the claim has yet to be verified by Western analysts, it is clear that this nuclear device test has ratcheted tensions between North Korea and the US, Japan and South Korea. The International Atomic Energy Authority responded by labeling North Korea as a 'global threat', and US President Trump announced on Tuesday that he would increase weapon sales to Japan and South Korea. As tensions between Washington and Pyongyang have increased, the drop in risk appetite is driving investors to the safe-haven yen. If the crisis in the Korean peninsula continues, traders can expect the Japanese currency to continue to gain ground.
Is the Bank of Japan fighting an unwinnable battle? BoJ Governor Haruhiko Kuroda has insisted that he will not alter monetary policy until inflation hits the bank's level of 2%, but critics are becoming increasingly impatient, noting that years of ultra-accommodative policy have failed to free the economy from the shackles of disinflation. On Monday, former BoJ board member Takahide Kiuchi said the BoJ must make changes to its radical stimulus. Kiuchi called on the central bank to be more flexible with its inflation target, and also warned that the bank needed to taper its annual asset purchases to 45 JPY trillion, otherwise the current purchases of JPY 60 trillion would hit the ceiling in mid-2018. Critics of the BoJ's stimulus experiment have long warned that the BoJ is running out of ammunition in its monetary policy arsenal, and have said that the BoJ must bite the bullet sooner or later and wind down its stimulus program.
Trade Idea Wrap-up: USD/CHF – Buy at 0.9500
USD/CHF - 0.9566
Most recent candlesticks pattern : N/A
Trend : Down
Tenkan-Sen level : 0.9582
Kijun-Sen level : 0.9579
Ichimoku cloud top : 0.9614
Ichimoku cloud bottom : 0.9593
Original strategy :
Buy at 0.9520, Target: 0.9620, Stop: 0.9485
Position : -
Target : -
Stop : -
New strategy :
Buy at 0.9500, Target: 0.9600, Stop: 0.9465
Position : -
Target : -
Stop : -
As the greenback has retreated after meeting resistance at 0.9614, suggesting consolidation with initial downside bias would be seen and test of 0.9539-44 support is likely, however, if our view that low has been formed at 0.9428 last week is correct, downside would be limited to 0.9500 and bring another rebound later. Above 0.9615-20 would bring test of 0.9653-55 resistance, break there would bring another rise to 0.9680 but break there is needed to add credence to this view and extend gain to resistance at 0.9698-99.
In view of this, would not chase this rise here and would be prudent to buy dollar on further subsequent retreat. Below 0.9490-00 would risk weakness to 0.9470 but still reckon downside would be limited to 0.9450 and said support at 0.9428 should remain intact, bring another rebound later.
Trade Idea Wrap-up: GBP/USD – Buy at 1.2970
GBP/USD - 1.3021
Most recent candlesticks pattern : N/A
Trend : Near term up
Tenkan-Sen level : 1.2971
Kijun-Sen level : 1.2971
Ichimoku cloud top : 1.2954
Ichimoku cloud bottom : 1.2924
New strategy :
Buy at 1.2970, Target: 1.3070, Stop: 1.2935
Position : -
Target : -
Stop : -
Current rally above previous resistance at 1.2996 confirms recent rise from 1.2774 has resumed and mild upside bias remains for this move to extend further gain to previous resistance at 1.3032, break there would encourage for headway to 1.3055-60 (100% projection of 1.2774-1.2979 measuring from 1.2852), then towards 1.3080 (61.8% Fibonacci retracement of 1.3269-1.2774) but near term overbought condition would prevent sharp move beyond 1.3100.
In view of this, would not chase this rise here and would be prudent to buy cable on pullback as the Kijun-Sen (now at 1.2971) should limit downside and bring another rise. Below the upper Kumo (now at 1.2954) would defer and risk weakness to the lower Kumo (now at 1.2924) but only break of support at 1.2905-09 would signal top is formed.
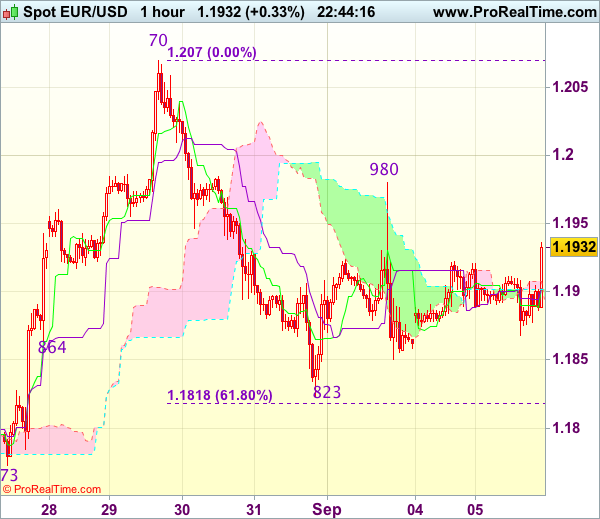
Trade Idea Wrap-up: EUR/USD – Sell at 1.1980
EUR/USD - 1.1923
Most recent candlesticks pattern : N/A
Trend : Up
Tenkan-Sen level : 1.1905
Kijun-Sen level : 1.1905
Ichimoku cloud top : 1.1905
Ichimoku cloud bottom : 1.1902
Original strategy :
Sell at 1.1955, Target: 1.1855, Stop: 1.1990
Position : -
Target : -
Stop : -
New strategy :
Sell at 1.1980, Target: 1.1880, Stop: 1.2015
Position : -
Target : -
Stop : -
Current rebound in part due to dollar’s broad-based weakness suggests consolidation with initial upside bias would be seen and gain to 1.1950-55 cannot be ruled out, however, reckon upside would be limited to resistance at 1.1980 and bring another decline later. Below 1.1885-90 would bring weakness to 1.1850, break there would signal the rebound from 1.1823 has ended, then test of this level would follow, break there would add credence to our view that top has been formed at 1.2070 earlier and extend the fall from there to 1.1815-18 (61.8% Fibonacci retracement of 1.1662-1.2070), then 1.1790-00 but downside should be limited to previous support at 1.1773.
In view of this, we are looking to sell euro again on recovery as 1.1980 resistance should limit upside. Only a firm break above said resistance at 1.1980 would abort and signal the fall from 1.2070 has ended at 1.1823 yesterday, bring further gain to 1.2000 and possibly towards 1.2025-30.
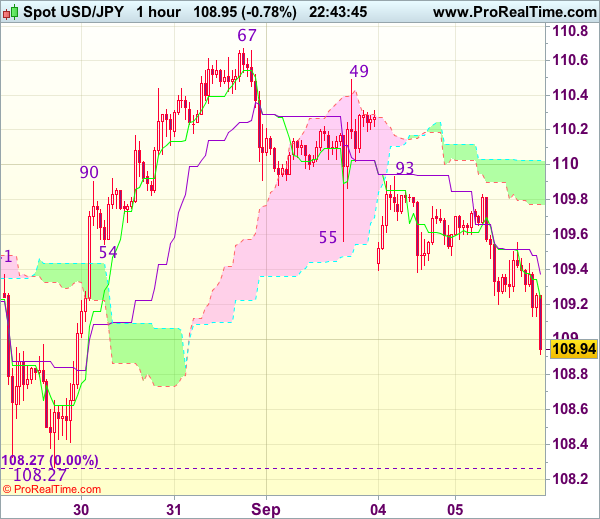
Trade Idea Wrap-up: USD/JPY – Sell at 109.40
USD/JPY - 108.90
Most recent candlesticks pattern : N/A
Trend : Sideways
Tenkan-Sen level : 109.21
Kijun-Sen level : 109.35
Ichimoku cloud top : 110.03
Ichimoku cloud bottom : 109.77
Original strategy :
Sell at 109.80, Target: 108.80, Stop: 110.15
Position : -
Target : -
Stop : -
New strategy :
Sell at 109.40, Target: 108.40, Stop: 109.75
Position : -
Target : -
Stop : -
As dollar’s decline has gathered momentum, suggesting the fall from 110.67 is still in progress and may extend weakness to 108.60, however, break of previous support at 108.27 is needed to retain bearishness and extend the fall from 114.50 to previous chart support at 108.13, having said that, the greenback needs to penetrate this chart support to confirm early selloff from 118.66 has resumed for subsequent weakness to 107.70-75 which is likely to hold from here.
In view of this, we are looking to sell dollar on recovery as 109.40-50 should limit upside and bring another decline later. Above 109.80-83 would abort and signal an intra-day low is formed instead, bring a stronger rebound to 110.00-05 but price should falter well below resistance at 110.49.