Sample Category Title
Dollar Awaits US Jobs Report
Tax reform talk and improving data give USD a boost
The US dollar recovered form the soft start of the trading week and is looking ahead of the release of the U.S. non farm payrolls (NFP) on Friday, September 1 at 8:30 am EDT. A strong ADP figure published on Wednesday saw private employers add 237,000 positions in August. The official report due on Friday is expected to have added 180,000 jobs after the 209,000 added the month before. Wages will be the real focus as traders will look for evidence that the U.S. Federal Reserve is ready for a third rate hike this year.
Inflation has remained close to flat in the US and its been a subject of discussion on Fed members. The leading camp has decided to risk raising rates with soft inflation but the lack of growth in wages could lead the central bank to close out 2017 with only a reduction of the balance sheet it accumulated during its quantitative easing program.
The second estimate for the US GDP in the second quarter was above the expectations and hit 3 percent. Price and wage inflation remains muted given the economy is growing at a faster pace and could end up taking a third rate hike off the table.
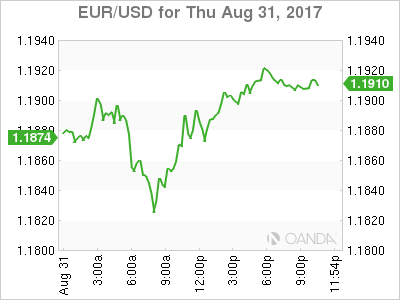
The EUR/USD dropped 0.076 percent on Thursday. The single currency is trading at 1.1891 ahead of the release of US employment data on Friday. The EUR broke through the 1.20 price level earlier in the week but ran out of momentum as the US indicators slowly turned the tide. ADP employment data and a better than expected second GDP estimate have boosted the US dollar ahead of the publication of the influential NFP report due tomorrow.
The USD recovered across the board, with the main exception being the CAD after a strong Q2 GDP release. The moves against the USD seemed overdone but with political turmoil and Hurricane Harvey and little data to go on in the beginning of the week there was hardly anywhere for the USD to go. With some distance from the Jackson Hole summit which brought little support the dollar, economic indicators and a push for tax reform are lifting the USD. The move will be confirmed if on Friday the NFP report not only manages to show a strong headline number of jobs, but also a rise in wages.
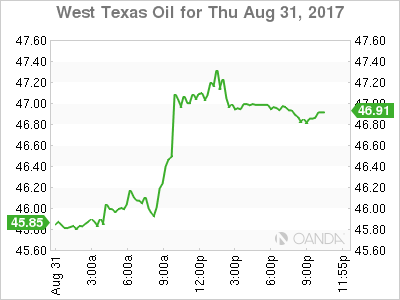
Energy prices jumped 2.594 percent in the last 24 hours. The price of West Texas Intermediate is trading at 47.15 after the Trump administration has tapped the Strategic Petroleum Reserve to ease the disruption caused by Hurricane Harvey. The US government will loan its reserves to a refinery set in Louisiana, unaffected by the tropical storm in an effort to offset the shutdowns in Texan refineries.
The US also holds gasoline in emergency reserves and could consider tapping into them if gasoline prices remain elevated during the next couple of weeks until refineries can come back online. Harvey affected about a quarter of Texan refineries and is expected to be two to three weeks until they can reassume operations.
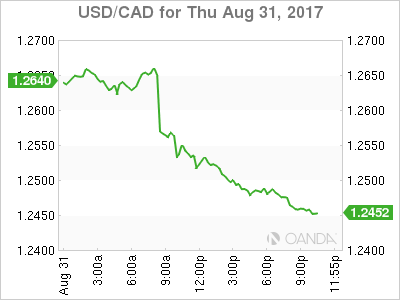
The USD/CAD lost 0.889 percent in the last 24 hours. The currency is trading at 1.2515 near daily lows after a surprise increase in the expected rate of growth of the Canadian economy. The monthly gross domestic product (GDP) release shoed a 4.5 percent rate of growth beating estimates of 3.3 percent. Strong consumer spending was one of the main drivers of the accelerated rate in the second quarter.
The highest rate of growth in six years has put back on the table a follow up rate hike by the Bank of Canada (BoC) before the end of the year. The central bank cut rates twice in 2015 down to 0.50 percent and with a quick pivot in June, announced a rate hike in July against previous expectations of a 2018 first quarter move. The BoC has made it clear that those cuts are no longer needed as the economy has recovered from the impact of low oil prices. A rate hike in the October meeting could still happen given the strong data released today and is propelling the loonie higher versus the greenback.
Market events to watch this week:
Friday, September 1
4:30 am GBP Manufacturing PMI
8:30 am USD Average Hourly Earnings m/m
8:30 am USD Non-Farm Employment Change
10:00 am USD ISM Manufacturing PMI
Bank Of Canada To Hike Rates? USD/CAD Dropping Like A Stone
USD/CAD dropped like a stone from the resistance zone that we have been following on the blog recently, as the Canadian Dollar decided to rip higher.
The Canadian economy surprised the market to the upside with a 4.5% GDP growth in the second quarter. This was MUCH better than market expectations of a 3.7% increase and makes Canada the best performing economy in the G7. Though that tag does bring with it future issues for the Bank of Canada, like the fact that an interest rate hike is now an almost definite next step.
Interest rate futures markets are pricing in a 37% probability of a rate hike in September and an 86% probability in October. The question remains when, but the market is going to look to price the move in which is negative USD/CAD regardless:
USD/CAD Daily:
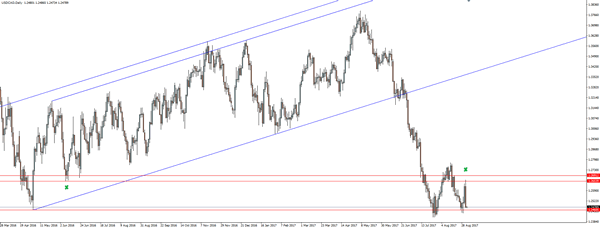
As you can see on the daily chart, the higher time frame support/resistance levels are being respected nicely and after bouncing at the 2016 swing low support level, price then retested resistance and was slapped straight back down on the data release.
Technicals predicting the fundamentals? Who would have thought!
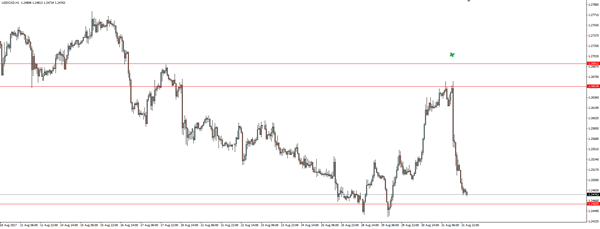
Stepping down into the hourly and you can see the resistance zone that price was sitting at just as the news was released much more clear. The way price sets itself up at important technical levels before fundamental data is released still amazes me every time.
Sizzling Canada & NFP Rumour Trade
Canada posted its best half in 16-years as Q2 soared above expectations. The Canadian dollar was easily the top performer on the day and USD/CAD suffered further on late USD selling ahead of nonfarm payrolls, which is the main highlight in the day ahead as the calendar turns to September. We will also take a look at seasonals. 2 new Premium trades have been issued in USD and GBP pairs.
Canadian GDP rose 4.5% q/q annualized in the second quarter, far above the +3.7% consensus in the best quarter since 2011. It builds on +3.7% growth in Q1. The details of the data were just as positive as consumers, business investment and trade all expanded along with incomes. Compared to a year ago, GDP is up 4.3% and all the forward-looking metrics point to another decent quarter for Q3.
That will certainly draw the Bank of Canada's attention ahead of the Sept 6 meeting. The odds of a hike rose to 41% from 26% in the aftermath of the report. USD/CAD fell nearly 2 cents and could fall much more if a hike comes and is coupled with a hawkish statement.
The US also got some good news as personal income rose 0.4% in July compared to 0.3% expected and the Chicago PMI was slightly higher. But other indications were negative. Pending home sales fell 0.8% as signs mount of a rut in housing. In a sign that inflation pressures aren't building, the core PCE price index fell to 1.4% annualized from 1.5% in July.
Mnuchin & Data Rein in USD
The dollar fell about 75 pips across the board in the latter half of the day. Part of the blame was heaped on Mnuchin for saying a weaker dollar was better for trade but focusing on that line alone took his words out of context.
What's more likely is that month-end flows depressed the dollar. There is also abundant talk about how August non-farm payrolls consistently underperform. They've missed the consensus on the first reading in 16 of the past 20 years including an average of 48K in the past six years.
We get the sense, however, that it's a well-known seasonal hiccup and that most traders may be selling USD on the rumour of a soft report. In turn, they could cover when the data hits, even if it's weak.
Quick hits:
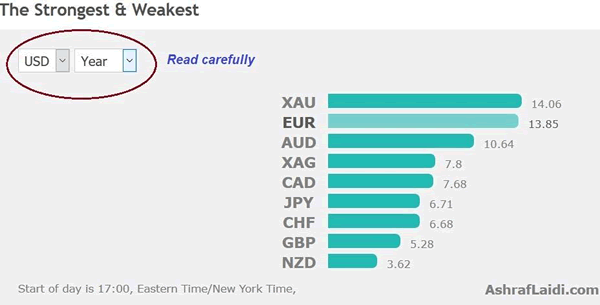
The Chinese yuan remains the least talked about story in FX. It was easily the best performing currency in August, followed by the Swiss franc and euro. The New Zealand dollar lagged badly.
Most major stock markets were up in August but less than 1%. Factoring in FX changes, the Nasdaq and Italian MIB were top performers.
At the start of August we warned it was tough month for the pound. Cable fell 2% and only the New Zealand dollar fared worse than GBP.
We also warned that gold was a winner in August. It gained more than 4% en route to the highest levels since November 2016.
On Aug 1, we highlighted that August was a poor month for AUD and fell in 10 of the past 12 Augusts. That continued and it had been down as much as 2.3% mid-month but recovered to finish down 0.7%.
Finally, we warned about consistently high volatility in August and that was definitely the cast as the VIX jumped as much as 68% before fading to just a 3.3% gain at month end.
We will have September seasonals in the days ahead.
Gold Pushes Higher as Consumer Spending, Housing Reports Miss Estimates
Gold has posted considerable gains in the Thursday session. In North American trade, spot gold is trading at $1317.83, up 0.69% on the day. In economic news, unemployment claims edged up to 236 thousand, just below the forecast of 237 thousand. Personal Spending came in at 0.3%, shy of the estimate of 0.4%. The news from the housing sector was also disappointing, as Pending Home Sales posted a sharp decline of 0.8%, well off the forecast of +0.4%. On Friday, we'll get a look at key employment data. Average Hourly Earnings is expected to edge lower to 0.2%, and the markets are braced for Nonfarm Employment Change to drop to 180 thousand.
Gold prices have shot up 1.9% this week, despite a stellar showing from GDP in the second quarter. Preliminary GDP (second estimate) was revised to 3.0%, a marked improvement from the first estimate of 2.6%. Consumer confidence and spending remain strong and helped contribute to second quarter growth, which posted its strongest gain since the first quarter of 2015. However, solid consumer spending has failed to boost inflation, and wage growth remains weak. The markets will be looking closely at the July wage growth report, which is expected to show a weak gain of 0.2%. The lack of inflation could hamper the Federal Reserve's plans to raise interest rates, with the likelihood of a rate hike in December standing at just 35%. On the employment front, ADP Nonfarm Payrolls jumped to 237 thousand, marking a 3-month high. The official Nonfarm Payrolls report will be released on Friday, and if this indicator also beats the forecast, it would be a strong indication that the economic momentum has continued into the third quarter.
Gold is considered a safe-haven asset, and often benefits when investors get jittery and lose their risk appetite. Such was the case this week, as renewed tensions between the US and North Korea early in the week propelled the metal above the symbolic $1300 level. On Tuesday, North Korea fired a missile over Japanese territory, drawing sharp condemnations from Japan and the US, with President Trump declaring that "all options remain on the table". Although, tensions have since eased somewhat, if North Korea decides to fire another missile towards Japan or the US military base on Guam, gold prices will likely move higher.
Pound Dips After Bumpy Brexit Talks
The British pound has posted losses in the Thursday session. In North American trade, the pair is trading at 1.2884, down 0.31% on the day. On the release front, there are no British events on the schedule. In the US, unemployment claims edged up to 236 thousand, just below the forecast of 237 thousand. In the US, Personal Spending improved to 0.3%, just shy of the estimate of 0.4%. The news was not as good from the housings sector, as Pending Home Sales posted a sharp decline of 0.8%, well off the forecast of +0.4%. On Friday, the UK releases Manufacturing PMI, with an estimate of 55.1 points. In the US, we'll get a look at key employment data. Average Hourly Earnings is expected to edge lower to 0.2%, and the markets are braced for Nonfarm Employment Change to drop to 180 thousand.
The US economy look sharp in the second quarter of 2017, as Preliminary GDP (second estimate) for the second quarter was revised to 3.0%. This figure was a marked improvement from the first estimate of 2.6%. Consumer confidence and spending remain strong and helped contribute to second quarter growth, which posted its strongest gain since the first quarter of 2015. However, solid consumer spending has failed to boost inflation, and wage growth remains weak. The markets will be looking closely at the July wage growth report, which is expected to show a weak gain of 0.2%. The lack of inflation could hamper the Federal Reserve's plans to raise interest rates, with the likelihood of a rate hike in December standing at just 35%. On the employment front, ADP Nonfarm Payrolls jumped to 237 thousand, marking a 3-month high. The official Nonfarm Payrolls report will be released on Friday, and if this indicator also beats the forecast, it would be a strong indication that the economic momentum has continued into the third quarter.
The Brexit negotiations continue to grind slowly, causing concern in both Brussels and London. A third round of talks ended on Thursday in Brussels. Britain and the EU remain far apart on a range of issues and even the scope of the talks remain in dispute. Britain wants to discuss a future trading relationship with the EU at the same time that points in contention are dealt with, but the Europeans insist on solving the contentious issues first, such as the size of Britain's bill and the jurisdiction of the European High Court on European citizens living in the UK. With plenty of distrust between the sides, the negotiations could grind to a halt if both sides don't show greater flexibility, and such a scenario would likely take a toll on the British pound.
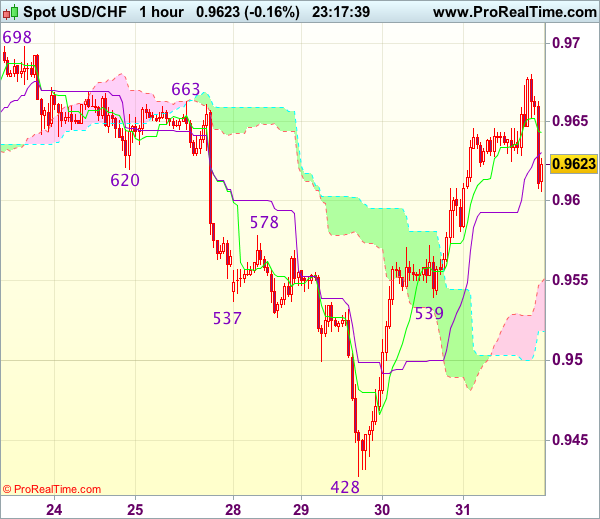
Trade Idea Wrap-up: USD/CHF – Buy at 0.9540
USD/CHF - 0.9618
Most recent candlesticks pattern : N/A
Trend : Down
Tenkan-Sen level : 0.9643
Kijun-Sen level : 0.9631
Ichimoku cloud top : 0.9549
Ichimoku cloud bottom : 0.9518
Original strategy :
Buy at 0.9540, Target: 0.9640, Stop: 0.9505
Position : -
Target : -
Stop : -
New strategy :
Buy at 0.9540, Target: 0.9640, Stop: 0.9505
Position : -
Target : -
Stop : -
As the greenback has retreated after intra-day rise to 0.9680, suggesting minor consolidation below this level would be seen and pullback to 0.9580-85 is likely, however, reckon downside would be limited to support t 0.9539 and bring another rise later, above 0.9650 would bring test of said intra-day resistance at 0.9680, break there would extend the rise from 0.9428 low to previous resistance at 0.9698-99 but overbought condition should limit upside and reckon 0.9725-30 would hold on first testing.
In view of this, we are looking to buy dollar on further subsequent pullback as 0.9539 support should limit downside and bring another rebound later. Below 0.9500-10 would defer and suggest first leg of rise from 0.9428 has ended, risk weakness to 0.9470 but price should stay well above said support at 0.9428, bring another rebound.
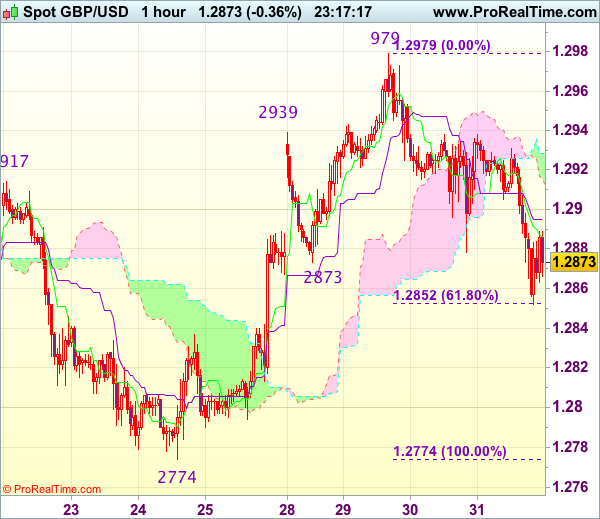
Trade Idea Wrap-up: GBP/USD – Hold long entered at 1.2855
GBP/USD - 1.2877
Most recent candlesticks pattern : N/A
Trend : Near term up
Tenkan-Sen level : 1.2886
Kijun-Sen level : 1.2895
Ichimoku cloud top : 1.2929
Ichimoku cloud bottom : 1.2916
Original strategy :
Bought at 1.2855, Target: 1.2955, Stop: 1.2820
Position : - Long at 1.2855
Target : - 1.2955
Stop : - 1.2820
New strategy :
Hold long entered at 1.2855, Target: 1.2955, Stop: 1.2820
Position : - Long at 1.2855
Target : - 1.2955
Stop : - 1.2820
Although cable has dropped again after brief recovery and near term downside risk remains for the fall from 1.2979 (this week’s high) to extend marginal weakness, reckon downside would be limited to 1.2850-52 (61.8% Fibonacci retracement of 1.2774-1.2979) and bring rebound later, above 1.2935-40 would signal the retreat from 1.2979 has ended, bring retest of this level first.
In view of this, we are holding on to our long position entered at 1.2855. Below previous resistance at 1.2837 would defer and signal first leg of upmove from 1.2774 has ended, risk weakness to support at 1.2813 but price should stay well above support at 1.2774, bring another rebound later.
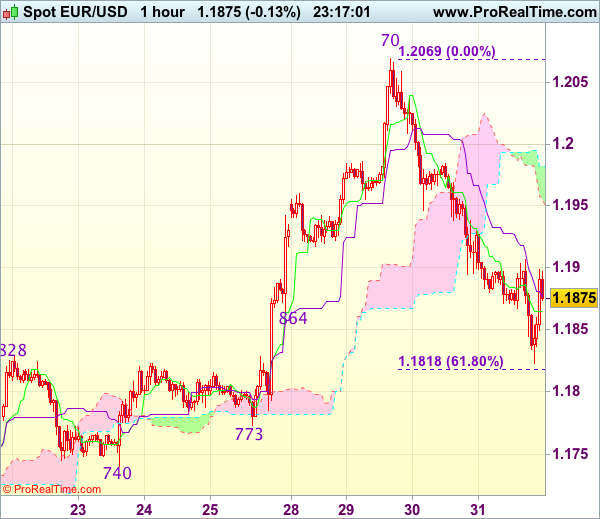
Trade Idea Wrap-up: EUR/USD – Sell at 1.1950
EUR/USD - 1.1877
Most recent candlesticks pattern : N/A
Trend : Up
Tenkan-Sen level : 1.1865
Kijun-Sen level : 1.1876
Ichimoku cloud top : 1.1982
Ichimoku cloud bottom : 1.1956
Original strategy :
Sell at 1.1950, Target: 1.1850, Stop: 1.1985
Position : -
Target : -
Stop : -
New strategy :
Sell at 1.1950, Target: 1.1850, Stop: 1.1985
Position : -
Target : -
Stop : -
As the single currency has recovered after intra-day fall to 1.1823, suggesting consolidation above this level would be seen and corrective bounce to 1.1900-05 is likely, however, reckon upside would be limited to 1.1950-55 and bring another decline to 1.1815-18 (61.8% Fibonacci retracement of 1.1662-1.2070) but downside should be limited to 1.1790-00 and support at 1.1773 should remain intact.
In view of this, we are looking to sell euro on recovery as 1.1950-55 should limit upside. Above 1.1980-85 would risk a stronger rebound to 1.2005-10 but still reckon upside would be limited to 1.2035-40 and price should falter below said this week’s high at 1.2070, bring another retreat later.
ECB Policy Stance Not to be Affected by Strong Euro
Despite a retreat after breaching the 1.2 level against US dollar, the euro has still gained almost +2% since the last ECB meeting. Indeed, the single currency is the best performer so far this year, up13% against the greenback and +8% against the pound, whilst the trade-weighted index has appreciated over 7% since 2Q17. A non-eventful Jackson Hole failed to dampened euro's rally. Rather, it led EURUSD to surge to as high as 1.2069, a level not seen since early 2015.
Recent Euro Strength Driven by Unattractiveness of Others
While improvement in the Eurozone's economic outlook and expectations ECB's QE tapering ahead had been the key drivers of the euro since the second half of the year, recent strength is due to the unattractiveness of other currencies. For instance, US dollar's weakness was broadly based, as US inflation has been stubbornly subdued and Fed Chair Yellen shifted the focus to defending financial regulations at her Jackson Hole Speech. The White House chaos has raised concerns over a government shutdown in October, let alone the diminished hopes of pro-growth policies and tax reforms. Sterling is hardly a darling as the Brexit negotiation process appear slow. Although the UK published a number of policy papers over the past two weeks, the stances are unrealistic from EU's point of view. The EU insisted to sort out the "divorce" fee before moving forward to other topics, while the UK preferred to be more "flexible".
ECB Meeting Preview
ECB's Warning over Euro Less Stringent than Years Ago
Euro's relentless rally of late has triggered some speculations that the ECB might delay QE tapering. We don't think so! While we agree that the ECB has turned more cautious over its policy communications so as not to send euro higher, it is not as vigilant about euro's outlook as in several years ago. Back in April 2014, Draghi noted explicitly in an occasion that "the policy stance may also be affected by a continued appreciation of the exchange rate. The exchange rate is not in itself a policy target, but a rise in the exchange rate, all else being equal, implies a tightening of monetary conditions, a downward impact on inflation and potentially a threat to the ongoing recovery. If so, this would call for policy action to maintain the current accommodative stance". At the meeting minutes in July 2017, he raised concerns about the euro's appreciation but in a milder language: concerns were expressed about the risk of the exchange rate overshooting in the future. The economic environment (inflation, economic growth and confidence levels, etc.) has changed significantly from three years ago.
Speculative Positions Elevated but Less Extreme after Adjusting for Trading Volume
On speculative positioning, the aggregate non-commercial net long position stays at extreme level – a level not seen since 2011. However, after adjusting with trade volume (open interest), the situation is not that bad, though remains elevated. The same applies to hedge funds.
At the upcoming meeting on September 7, we expect ECB to maintain the rhetoric that "the net asset purchases, at the current monthly pace of 60B euro, are intended to run until the end of December 2017, or beyond, if necessary, and in any case until the Governing Council sees a sustained adjustment in the path of inflation consistent with its inflation aim". Policymakers would also warn of currency appreciation. The update on economic projections might show mild downward revision on GDP growth and inflation, as the technical assumption of the euro has been increased. At the Q&A session, Draghi would probably stay neutral in the tapering schedule. We expect QE tapering announcement would be made in October.
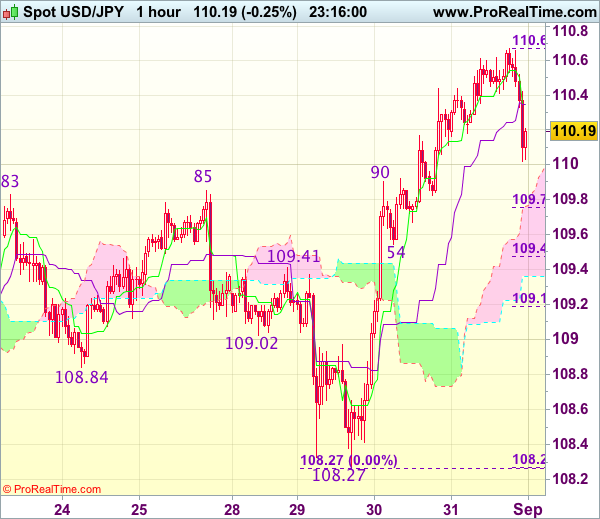
Trade Idea Wrap-up: USD/JPY – Buy at 109.55
USD/JPY - 110.19
Most recent candlesticks pattern : N/A
Trend : Near term up
Tenkan-Sen level : 110.35
Kijun-Sen level : 110.35
Ichimoku cloud top : 109.76
Ichimoku cloud bottom : 109.36
Original strategy :
Buy at 109.80, Target: 110.80, Stop: 109.45
Position : -
Target : -
Stop : -
New strategy :
Buy at 109.55, Target: 110.80, Stop: 109.20
Position : -
Target : -
Stop : -
As the greenback has retreated after rising to 110.67, suggesting consolidation below this level would be seen and pullback to 109.85-90 (previous resistance, now support), however, reckon support at 109.54 would limit downside and bring another rise later, above said resistance would add credence to our view that recent decline from 114.50 has ended at 108.27, then headway to resistance at 110.95 would follow, however, reckon upside would be limited to 111.15-20 and price should falter below 111.40 (approx. 50% Fibonacci retracement of 114.50-108.27).
In view of this, would not chase this rise here and we are looking to buy dollar on pullback as said support at 109.54 would limit downside and bring another rebound later. A firm break below this support would abort and signal top has been formed, risk weakness to 109.15-20 (61.8% Fibonacci retracement of 108.27-110.67).