
Sample Category Title
ECB Exchange Rate Concerns Drag Euro Lower; Loonie Jumps on Canada GDP Beat
A busy economic data session had limited impact on the US dollar and the euro as the greenback maintained its steady recovery, while the euro extended its losses. Risk sentiment remained positive with major European stock indices gaining by almost 1%, though demand for gold held up, with the precious metal climbing 0.6% to $1316 an ounce.
Traders chose to put aside their concerns over the heightened geopolitical risks relating to North Korea, while President Trump's speech yesterday on tax reforms generated little excitement. Trump launched his eagerly awaited tax reform campaign yesterday with a speech in Missouri. The President stuck to his pledge to reduce the corporate tax rate to 15% but the speech was otherwise lacking in detail and markets were sceptical about his ability to see through the reforms.
The data highlight in Europe on Thursday was the Eurozone flash inflation release. Annual CPI across the euro area beat expectations of 1.4% to rise to 1.5%, according to the August preliminary reading, up from 1.3% in July. The core rate, which excludes food and energy items, was unchanged at 1.3% year-on-year versus forecasts it would ease to 1.2%. Unemployment figures were also out today. The Eurozone's jobless rate remained unchanged at 9.1% in July, in line with forecasts.
Although the inflation data supports the case for tighter policy by the European Central Bank, the euro was firmly stuck in a downtrend, with euro/dollar touching a near one-week low of 1.1821. The single currency came under pressure today after Reuters reported that ECB policymakers are becoming increasingly concerned about the euro's strength. Sources told Reuters that a higher exchange rate makes it less likely that the ECB will opt for a quick exit from its asset purchase program. They also suggested that a decision on tapering is unlikely next Thursday given that discussions will only begin at next week's meeting.
The euro was last trading at 1.1857 against the dollar, down 0.2% on the day, and was also down against the yen and the pound at 130.85 yen and 0.9205 pounds.
The dollar pared some of its earlier gains despite another batch of solid US data. Personal income in the US rose by 0.4% month-on-month in July following flat growth in June. Expectations were for an increase of 0.3%. Personal consumption came in slightly below forecasts of 0.4%, growing by 0.3% m/m instead. However, the prior month's figure was revised up by 0.1% to 0.2%. The Fed's favourite inflation gauge, the core PCE price index, rose by 0.1% m/m in July, in line with forecasts. But the annual rate fell to its lowest since December 2015, at 1.4%.
Other US data included the weekly jobless claims, the Chicago PMI and pending home sales. Initial claims for unemployment benefits rose by 236k last week, slightly better than forecasts of 237k. Jobless claims have averaged 236.75k in the past four weeks, pointing to a strong nonfarm payrolls number in tomorrow's jobs report. The Chicago PMI also beat forecasts, holding steady at 58.9 in August instead of falling to 58.5 as expected. Pending homes sales disappointed however as they fell by 0.8% over the month in July, missing estimates of a 0.5% rise.
The greenback retreated from a two-week high 110.66 yen set earlier in the session to around 110.20 yen in late trading. The dollar index stood 0.1% higher at 92.97.
The lack of "decisive progress" in the Brexit negotiations weighed on the pound today, with cable sliding 0.4% to 1.2877. The third round of talks ended today with little agreement on key issues, namely the divorce bill. Hawkish remarks by Bank of England policymaker Michael Saunders earlier in the day failed to lift the British currency.
The Canadian dollar got a significant boost today after Canadian GDP surprised to the upside. Canada's economy expanded by an annualized rate of 4.5% in the second quarter, which was the best in six years. The figure is well above expectations of 3.7% (the same rate as in the first quarter) and raises the odds of another rate hike by the Bank of Canada this year. The loonie jumped by almost 1% after the data, with dollar/loonie slumping to 1.2520 and reversing most of yesterday's gains.
Further lifting the loonie today were higher crude oil prices. WTI crude surged by 2.8% to $47.26 in late session, reversing from a 5-week low, and Brent crude stood 2% firmer at $51.90, as hurricane Harvey started to recede and some refineries started coming back online. However, the rise was mainly driven by the intensifying gasoline shortage in the US as a result of the refineries shutdown in Texas, which has pushed gasoline futures up by more than 20% from before the storm.
Income and Spending Perks Up in July
Personal income rose a strong 0.4 percent in July after June's flat reading. Spending strengthened as well, up 0.3 percent in July with an upward revision to 0.2 percent in June.
Gains in July Were Broad Based
Personal income surged 0.4 percent in July, besting consensus estimates and signaling stronger momentum going into the second half of the year after June's flat reading cast some doubt. The disappointing print in June largely resulted from a payback for May's surge in personal income from assets, which overshadowed a strong 0.5 percent gain from wages and salaries in June. Personal income from assets recovered in today's report, up a solid 0.6 percent in July, while wages and salaries growth came in at 0.5 percent again in July. This has benefitted consumers' pocketbooks, as disposable income rose 0.3 percent in July.
Personal spending was also up solidly in July, though the 0.3 percent gain was slightly below consensus estimates of 0.4 percent. Spending was up a stronger-than-first-reported 0.2 percent in June, echoing yesterday's upward revision to personal consumption in the second look at Q2 GDP. Spending in July was boosted by a large rise in durable goods spending. Durable goods consumption rose a strong 0.6 percent on the month, though price discounts resulted in a 0.8 percent increase on a real basis. Consumption of nondurable goods was up a solid 0.5 percent in July, though inflation cut that gain to 0.3 percent in real terms. Services were less of a lift in July, and its 0.2 percent growth was essentially flat after accounting for price changes.
We knew that the disappointing report in June was largely the result of one-off factors, and yesterday's second look at GDP—which showed a stronger consumer helping boost GDP to 3 percent in the second quarter— suggested the consumer was in solid shape at the start of H2. Still, today's strong personal income and spending report provides reassuring evidence that momentum continued into the second half of the year. Though the business side of the U.S. economy has perked up recently, the consumer still holds the reins. Strong income growth, particularly when that strength is coming from the job market boosting wages and salaries, should help keep consumers' spirits up near the recent highs indicated in consumer surveys, which bodes well for spending in H2.
Inflation Remains Tame
Both core and headline PCE deflators rose 0.1 percent on the month, as expected. The gap between headline and core PCE growth has closed as the effects of the decline in energy prices phase out of the year-to-year calculations. Core PCE inflation is now up just 1.4 percent from last year, which is the furthest it has been from the Fed's target since December 2015. Historically, PCE data in the second half of the year tends to be revised upward, and this residual seasonality in the government data is no secret to the FOMC.
Yen Shrugs off Weak Japanese Mfg., Housing Reports
USD/JPY is almost unchanged in the Thursday session. In North American trade, the pair is trading at 110.11, down 0.12% on the day. On the release front, Japanese Preliminary Industrial Production declined 0.8%, missing the estimate of -0.2%. In the US, unemployment claims edged up to 236 thousand, just below the forecast of 237 thousand. Later in the day, Japan releases Capital Spending and Final Manufacturing PMI. On Friday, the US releases key employment data. Average Hourly Earnings is expected to edge lower to 0.2%, and the markets are braced for Nonfarm Employment Change to drop to 180 thousand.
The US economy performed better than expected in the second quarter, as Preliminary GDP (second estimate) for the second quarter was revised to 3.0%. This figure was a marked improvement from the first estimate of 2.6%. Consumer confidence and spending remain strong and helped contribute to second quarter growth, which posted its strongest gain since the first quarter of 2015. However, solid consumer spending has failed to boost inflation, which continues to hover at low levels. The lack of inflation could hamper the Federal Reserve's plans to raise interest rates, with the likelihood of a rate hike in December standing at just 35%. On the employment front, ADP Nonfarm Payrolls jumped to 237 thousand, marking a 3-month high. The official Nonfarm Payrolls report will be released on Friday, and if this indicator also beats the forecast, it would be a strong indication that the economic momentum has continued into the third quarter.
The Japanese yen has had a busy week, as the safe-haven asset as been affected by tensions between the US and North Korea. The yen rose early in the week, after North Korea fired a missile over Japanese territory on Tuesday, drawing sharp condemnations from Japan and the US. However, investors quickly put the crisis behind them, as the dollar recovered and the yen has posted losing sessions for two straight days. The yen remains above the symbolic 110 level, and if North Korea continues to ratchet up tensions and fires a missile at Japan, or at Guam (as it has threatened to do), it's a safe bet that the yen rebound and gain ground against the dollar.
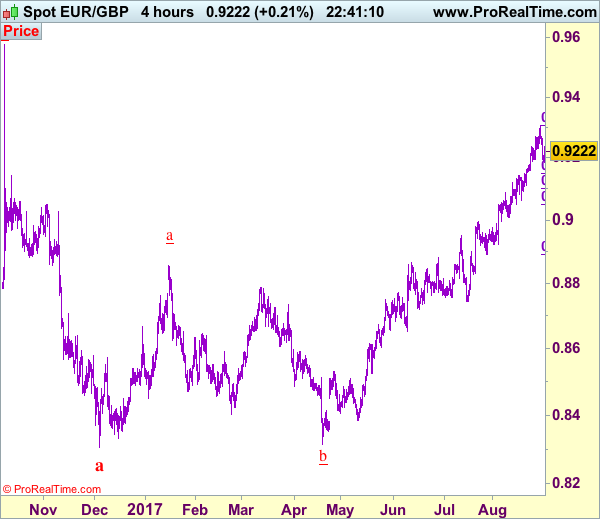
Trade Idea: EUR/GBP – Buy at 0.9145
EUR/GBP - 0.9221
Original strategy :
Buy at 0.9145, Target: 0.9295, Stop: 0.9105
Position : -
Target : -
Stop : -
New strategy :
Buy at 0.9145, Target: 0.9295, Stop: 0.9105
Position : -
Target : -
Stop : -
Euro’s retreat after yesterday’s rise to 0.9307 suggests a temporary top has been formed there and consolidation below this level would be seen with initial downside bias for correction to 0.9180-85, however, reckon downside would be limited to 0.9145-50 (38.2% Fibonacci retracement of 0.8892-0.9307) and bring rebound later, above 0.9270-75 would suggest the pullback from 0.9307 has ended and bring retest of this level, break there would extend the major rise from 0.8304 to 0.9335-40 but weakening of near term upward momentum should prevent sharp move beyond 0.9365-70 and price should falter below 0.9395-00.
In view of this, would not chase this rise here and would be prudent to buy euro on subsequent pullback as 0.9145-50 would limit downside. Below support at 0.9111 would abort and risk correction of recent upmove to 0.9095-99 (50% Fibonacci retracement of 0.8892-0.9307), however, reckon 0.9050-51 (61.8% Fibonacci retracement and previous support) would hold, bring rebound later.
Our preferred count is that, after forming a major top at 0.9805 (wave V), (A)-(B)-(C) correction is unfolding with (A) leg ended at 0.8400 (A: 0.8637, B: 0.9491 and 5-waver C ended at 0.8400. Wave (B) has ended at 0.9413 and impulsive wave (C) has either ended at 0.8067 or may extend one more fall to 0.8000 before prospect of another rally. Current breach of indicated resistance at 0.9043 confirms our view that the (C) leg has ended and bring stronger rebound towards 0.9150/54, then towards 0.9240/50.
Trade Idea: USD/CAD – Stand aside
USD/CAD - 1.2546
Original strategy :
Exit short entered at 1.2595,
Position: - Short at 1.2595
Target: -
Stop: -
New strategy :
Stand aside
Position: -
Target: -
Stop:-
Despite staging a strong rebound from 1.2441 to 1.2663, current sharp retreat suggests further choppy trading would take place and weakness to 1.2500 cannot be ruled out, however, reckon said support at 1.2441 would hold from here and bring another rebound later. Only break of 1.2441 would revive bearishness and bring retest of 1.2414 support, having said that, the greenback needs to penetrate this wave iii trough to confirm decline has resumed in wave v to 1.2350 and then 1.2300-10.
On the upside, expect recovery to be limited to 1.2600 and said resistance at 1.2663 should remain intact, bring further choppy trading later. Above 1.2663 would bring test of resistance at 1.2691 but as outlook remains consolidative, price should falter below 1.2750, bring another decline. We are keeping our count that wave v as well as wave (C) ended at 1.3794 and impulsive wave (i ii, i ii) is now unfolding with minor wave iii ended at 1.2414, followed by wave iv correction possibly ended at 1.2778, wave v should extend towards 1.2300.
To recap, wave B from 1.3066 is unfolding as an a-b-c and is sub-divided as a: 1.2192, b: 1.2716 and wave c is a 5-waver with i: 1.1983, ii: 1.2506, extended wave iii with minor iii at 1.0206, wave iv ended at 1.0781 and wave v as well as wave iii has ended at 0.9931, hence the subsequent choppy trading is the wave iv which is unfolding as (a)-(b)-(c) with (a) leg of iv ended at 1.0854, followed by (b) leg at 1.0108 and (c) leg as well as the wave iv ended at 1.0674. The wave v is sub-divided by minor wave (i): 0.9980, (ii): 1.0374, (iii): 0.9446, (iv): 0.9913 and (v) as well as v has possibly ended at 0.9407, therefore, consolidation with upside bias is seen for major correction, indicated target at 1.3700 and 1.4000 had been met and further gain to 1.4700 would be seen later.

Elliott Wave Analysis: S&P500 Trading on the Bullish Side
S&P500 is trading on the bullish side, now unfolding wave v as part of a bigger degree impulse. We know that wave five is final wave of an impulse, meaning once it fully unfolds a new three-wave correction may come in play. Support for the upcoming correction may later be around the former swing low and high at 2442/2453 level.
S&P500, 1H
Growth in Canada Jumps Higher in Q2
Highlights:
Canadian Q2 annualized GDP growth rose a very robust, and much stronger-than-expected, 4.5% benefitting from broad-based gains led by consumer spending, business investment and exports.
The reported 0.3% rise in June GDP points to growth likely remaining above-potential at 2.5% in Q3.
Our Take:
The Canadian economy had been expected to rise strongly in Q2 though today's report exceeded those expectations with annualized growth jumping to 4.5% building further onto Q1's already solid 3.7%. With today's report, average growth has been more than double the economy's potential rate for four consecutive quarters. Activity is being supported by low interest rates and solid job gains that have been sustaining consumer spending growth of almost 4% over the past year. However, an additional supportive factor has been the cessation of sizeable declines in energy investment as oil prices moved modestly higher. This has contributed to business investment rising on average 10% over the first two quarters of this year. Though growth in business investment is expected to moderate, it will remain sufficiently strong to offset declining residential investment that has started to emerge in Q2.
With the pace of business investment expected to slow and with residential investment expected to continue to decline our expectation is that the pace of growth will moderate in Q3. That said, the monthly GDP data released this morning indicated a stronger-than-expected 0.3% gain in June following the 0.6% surge in May that is pointing to Q3 growth remaining above potential likely rising 2.5%. The prospect of a fifth consecutive quarter of above potential growth would represent a benchmark not achieved by the Canadian economy since 2011Q1. Sustained above potential growth provides a strong argument for the Bank of Canada to continue to withdraw the current monetary policy stimulus and will be a key discussion point at the central bank's policy meeting next week. However we lean towards the expected moderation in Q3 growth along with inflation generally remaining below target to keep the central bank on the sidelines at this meeting before resuming tightening at the October meeting.
Dollar Maintains Gains Going into the Payrolls
- European stock markets gain around 1% today, supported by a weaker euro. US stock markets opened positively as well, between +0.3% and 0.5%. US eco data printed to close to consensus to trigger a reaction.
- US personal income rose at a faster than expected clip (0.4% M/M) in July, following a flat outcome in June. Personal spending rose in line with expectations by 0.3% M/M in August, suggesting healthy consumption spending during Q3. Also the PCE and core PCE were in line with expectations, both up 0.1% M/M and 1.4% Y/Y.
- EMU inflation rose faster than expected in August to 1.5% Y/Y from 1.3% Y/Y previously, but underlying measures that exclude volatile energy prices remained stagnant at 1.2% Y/Y, adding to the headaches facing the ECB ahead of its monetary policy meeting next week. EMU jobless rate held steady in July at its lowest level (9.1%) since 2009
- Canada's economy grew at a rapid pace in the second quarter, easily beating economists' expectations. GDP rose at an annualised pace of 4.5% in Q2, following a 3.7% increase in Q1 and compares to the consensus of 3.3%.
- The US Department of Energy has authorised the release of half a million barrels of crude oil from the nation's Strategic Petroleum Reserve to Phillips 66′s refinery in Lake Charles, Louisiana, as the refining hub on the US Gulf Coast struggles with the fallout from Tropical Storm Harvey.
- Reuters published an ECB report based on unnamed sources that said that "the exchange rate has become a bigger issue". EUR/USD was hit by the publication.
- Michel Barnier, the EU Commission's Brexit chief, said there has been no "decisive" progress in talks with the UK at the conclusion of the third round of formal negotiations. Some progress was made on North Ireland, free travel area, the right of frontier workers and the European Court of Justice.
- • India's economic growth slowed for the fourth consecutive quarter to 5.7% in Q2, the weakest performance since early 2014, blamed by some on the lingering the impact of last year's cash ban and caution ahead of the adoption of a new VAT system.
- The Bank of England risks falling behind if it does not raise interest rates soon, according to Michael Saunders, a member of the bank's monetary policy committee. He laid out his case for raising rates. Saunders dissented pleading for higher rates at previous BoE's meetings. His views were well known.
Rates
Core bonds going nowhere
Core bond had a fairly boring session and trade currently near yesterday's closing levels, as eco data couldn't make the difference. Equities and crude oil rallied higher, but had no impact on bond trading. US and German yields are virtually unchanged (changes between flat and 0.4 bp). The calmness in the bond market convinced investors to look to the "riskier" peripheral bond markets. In the intra-EMU bond market, 10-yr yield spreads versus Germany narrowed 2-to-4 bps, Italy outperforming.
The Bund opened slightly lower, but traded sideways for the remainder of the morning session. EMU headline inflation printed at 1.5% Y/Y in August, a bit stronger than consensus, but after yesterday's national data that wasn't a surprise. Core HICP inflation stabilized at 1.2% Y/Y, suggesting that the underlying inflation still doesn't give any sign of a sustained acceleration. ECB president Draghi wants to see a sustained uptrend in underlying inflation and that's still missing. Therefore, no reason to move the Bund. Around noon, a Reuters article signalled ECB unease (unnamed sources) about the strength of the euro. The euro weakened and the ECB concern could have been the trigger for a minor move higher of the Bund to just above opening levels. In the afternoon session, the US eco data (personal income & spending, PCE deflators, initial claims) were all in line with expectations, keeping most investors sidelined. The release of the payrolls and ISM's tomorrow was part of the explanation of the reigning lethargy in bond trading. At the time of closing our report, the Chicago PMI will be released, but it is unlikely to stir the pot.
Currencies
Dollar maintains gains going into the payrolls
The dollar maintained its gains since Tuesday's rebound, but the rally slowed today. US data were not strong enough to inspire additional gains. At the same time, the euro declined further on rumours that the ECB was worried about the rise of the euro which might slow the start of the normalisation process. EUR/USD trades in the 1.1845 area. USD/JPY is changing hands at around 110.40/50.
European equities opened with decent gains, supported by a good performance in the US yesterday evening. The recent decline of the euro was also supportive for European equities. Initially, there was no clear trend on European interest rate markets and in EUR/USD or USD/JPY. EMU inflation printed slightly above the consensus at 1.5% Y/Y (1.4% expected). Last week, this inflation report had probably triggered further euro gains. However, sentiment has changed over the last two days. The reaction on European bond markets and in the major euro cross rates was almost non-existent. On the contrary. Late in the morning session, inevitable rumours from sources in the ECB appeared. They suggested that the recent rise of the euro was a sources of concern. It could cause the ECB to slow the reduction of QE asset purchases. EUR/USD dropped to the 1.1840/45 area. USD/JPY stabilized in the mid 110 area.
The dollar remained will bid early in the US. Especially the correction of EUR/USD continued, probably still driven by the ECB rumours. An intraday correction of EUR/JPY also put some additional pressure on the euro overall. The US early morning eco data (spending and income, PCE deflators, claims…) were almost exactly as expected. Markets apparently expected strong(er) data. Whatever the reason, the comeback of the dollar eased a bit. EUR/USD trades currently in the 1.1855 area. USD/JPY holds near 110.35. The dollar made a nice technical comeback over the last 48 hours. The payrolls will decide whether there is room for a further, data-driven comeback of the dollar.
Sterling rebound (against the euro) slows
Sterling trading showed a mixed picture today. There were no data with market moving potential. In a speech, BoE policy maker Saunders (one of the dissenters in favour of a rate hike at the August meeting) repeated that risks and uncertainty related to Brexit aren't enough a reason to maintain an overly loose monetary policy. However, his view was well-known in the market and barely triggered a reaction. At the end of the third round of Brexit negotiations, EU Barnier repeated that progress was insufficient, making it impossible to address other topics beyond the separation. The stalemate in the negotiations maybe was a slightly negative for sterling. Sterling declined against an overall stronger dollar. GBP/USD dropped to the 1.2855 area, from where a limited intraday rebound occurred. EUR/GBP rebounded temporary early in Europe, but the pair turned again south after the ECB rumours later in the session. EUR/GBP trades again in the 0.92 area, close to the recent low. That said, a further decline of EUR/GBP is clearly less evident than is the case for EUR/USD.
Canadian Economy Continued to Roar ahead in Second Quarter
Canadian GDP rose 4.5% in the second quarter (Q/Q, SAAR), marking a fourth straight quarter of robust growth. Price growth was negative, driven by a decline in the terms of trade. As such, nominal GDP, which includes these impacts, was up by a more modest 2.9%.
The stars of the show were again Canadian consumers, as household spending rose 4.6%, assisted by another quarter of robust spending on durable goods (+9.4%). Rising household income on the back of healthy job gains helped support growth, and was sufficient to bring the household savings rate up a notch, to 4.6% (from 4.3% in Q1).
Non-residential investment pulled forward again, with structures and equipment investment up 7.1%, and intellectual property investment up 8.7%. Government fixed investment was somewhat soft, rising just 0.5%.
Residential investment pulled back, down 4.7% in the second quarter, given a sizeable (-24.1%) drop in ownership transfer costs which reflected the cooling off of resale activity in key housing markets.
Net trade swung back to a positive contribution, as export growth (+9.6%) outpaced imports (+7.4%)
Perhaps most encouraging was the monthly GDP report for June, where 14 of 20 major industries expanded, generating a 0.3% month-on-month gain. It was the goods-producing side of the economy that again led the way, rising 0.5% on robust (+2.0%) gains in construction. For services, it was again slow and steady, up 0.2% on relatively broad-based gains.
Key Implications
Wow. There seems to be no stopping Canada of late, as above-expected growth in Q2 led to the best four-quarter growth performance since 2006. And while it was once again consumers in the driver's seat, another strong quarter of income growth meant that households were able to increase their savings rate a touch while still keeping their wallets open.
What's more, while it appears unlikely that another quarter of 4%+ growth is in store any time soon, the solid monthly data for June suggests that Canada still had solid momentum heading into the summer months, with very early tracking suggesting that Q3 growth could be around 2.5% - a solid pace by any measure and one likely to push Canada into excess demand territory.
For the Bank of Canada, another interest rate hike this fall is almost certainly a done deal. With the economy continuing to run well above its potential pace, and economic slack likely non-existent at present, Poloz will be reassured that inflationary pressures are nascent. That said, our research suggests that even with the robust growth of late, inflation is likely to remain modest relative to past experience (see report).
US: Personal Income Growth Bounces Back and Spending Remains Solid in July
Personal income growth rose 0.4% in July, a small positive surprise relative to consensus (+0.3%), and a welcome result following a flat print in June. Strong growth in wages and salaries (+0.5%), for the second consecutive month, helped boost top-line income. After removing taxes and price effects, real disposable personal income rose a more modest 0.2% on the month.
Spending rose 0.3%, a bit weaker than consensus expectation of a 0.4% advance, but atop of an upward revision to the June number (+0.2% vs. +0.1%). In real terms, personal spending rose 0.2%, but again came atop of upward revision (+0.2% to 0.0%).
After two months of negative or flat growth, consumer prices in July rose 0.1% month-on-month, but unchanged from June at 1.4% on a year-on-year basis. Core prices (excluding food & energy) rose 0.1% month-on-month, but year-on-year core PCE inflation fell back slightly to 1.4% from 1.5% in June.
Although both nominal disposable income and spending growth rose at the same pace in July, the saving rate ticked down slightly to 3.5% from 3.6% in June.
Key Implications
July's personal income and outlay report was broadly positive on the outlook for the U.S. economy. Disposable income growth bounced back, and real spending expanded at a 2.4% annualized pace. Altogether, this suggests that real consumer spending is set to expand at an above 3.0% annualized pace in the third quarter, contributing strongly to our third quarter growth forecast of about 3.0%.
The most anticipated indicator from today's report is the core PCE deflator print which yet again failed to register a material uptick from its recent 0.1 month-on-month trend pace. As the Fed's preferred inflation gauge, changes to the core PCE deflator are being watched closely with the Fed communicating that it's somewhat troubled by the lack of price pressures despite wage and job growth and estimates of falling economic slack. It appears that inflation is taking longer to respond to economic growth and labor market slack than in past cycles, but overall we continue to believe that price pressures will eventually pick-up as the economic cycle continues to mature.