Sample Category Title
GBPUSD Slides Below 200 Hour MA
Sterling has moved sharply lower, falling towards the 1.2860 level, after pound buyers failed to find momentum above the 1.2920 area, which represents the GBPUSD pairs 100-day moving average.
Price-action has now fallen below the 200-hour moving average, at 1.2872, with the GBPUSD pair now risking further intraday losses, once below the weekly pivot point, located at the 1.2856 level.
The GBPUSD is now strongly bearish on an intraday basis, with price now trading below all relevant short-term moving averages.
Key intraday technical support is found at 1.2856, 1.2832 and the 1.2773 level.
To the upside, intraday technical resistance is found at 1.2873, 1.2890, with the GBPUSD daily pivot point, at 1.2913. The 100-day moving average now becomes critical resistance, at 1.2920.
EURUSD Falls on Report of ECB Worries
The EURUSD pair has fallen to an intraday low of 1.1844, after reports surfaced that a number of European Central Bank policymakers are growing increasingly concerned about the recent strength on the euro currency.
During the European session, the EURUSD pair advanced towards the 1.1905 level, but soon found strong intraday resistance from the euro's monthly time-frame 50 period moving average.
The EURUSD pair now trades below both daily and weekly pivot points, with price now risking further losses towards the 200-week moving average, located at 1.1762.
Key technical support below the 1.1865 level is found at, the 21st August price high, at 1.1829, and the H4 time frame, 100-period moving average, at 1.1812.
To the upside, key intraday EURUSD resistance is found at the 1.1865 and 1.1905 level, with the daily pivot point located at the 1.1920 level.
CAC Climbs on Strong French CPI Report
The CAC index has recorded considerable gains in the Thursday session. Currently, the index is at 5,060.30, up 0.75% on the day. On the release front, French Preliminary CPI rebounded in August, posting a gain of 0.5%. This matched the estimate, and was a sharp improvement on the July reading of -0.4%. Euro zone CPI Flash Estimate accelerated to 1.5%, edging above the forecast of 1.4%. On Friday, the US releases Nonfarm Employment Change, with the markets braced for a drop to 180 thousand.
It's been a busy week for European stock markets, which have been responding to tensions in the Korean peninsula. The CAC lost ground on Tuesday, after North Korea fired a ballistic missile which flew over northern Japan before crashing into the ocean. Japan and the US sharply condemned the missile launch, with President Trump saying that "all options remain on the table". However, investors have put the incident behind them, and stronger risk appetite has pushed the CAC higher. There was positive news out of the US on Wednesday, as Preliminary GDP (second estimate) for the second quarter was revised to 3.0%, a marked improvement from the first estimate of 2.6%. Consumer confidence and spending remain strong and helped contribute to the strong GDP report, as the economy posted its strongest gain since the first quarter of 2015. However, solid consumer spending has failed to boost inflation, which continues to hover at low levels. The lack of inflation could hamper the Federal Reserve's plans to raise interest rates, with the likelihood of a rate hike in December standing at just 35%.
The euro continues to gain ground against the US dollar. The currency has soared 12.0% since April 1, and on Tuesday, the euro pushed above the 1.20 level for the first time since January 2017. The euro has benefited from stronger growth in the eurozone in 2017, led by robust growth in Germany. However, the euro's streak has weighed on the shares of automobile makers and other exporters, as a stronger euro has made exports more expensive. Investors are anticipating that the ECB will provide some guidance on plans regarding its asset purchase program (QE), which is scheduled to terminate in December. The ECB is widely expected to taper its QE program early next year, but so far has been mum about its plans. Analysts expect the ECB to address its stimulus package at the next policy meeting on September 7.
Stronger Risk Appetite Sends DAX Higher
The DAX index has posted gains in the Thursday session. The DAX is currently trading at 12,073.00, up 0.59% on the day. On the release front, German Retail Sales was unexpectedly weak, declining 1.2%. This was well short of the forecast of -0.5%. German Unemployment Change came in at -5 thousand, beating the estimate of -6 thousand. Euro zone CPI Flash Estimate accelerated to 1.5%, edging above the forecast of 1.4%. As well, the euro zone unemployment rate remained unchanged at 9.1%. On Friday, the US releases Nonfarm Employment Change, which is expected to slow to 180 thousand.
US GDP sparkled on Wednesday, helping restore investor risk appetite, which took a hit after tensions rose between North Korea and the US. Preliminary GDP (second estimate) for the second quarter was revised to 3.0%, a marked improvement from the first estimate of 2.6%. Consumer confidence and spending remain strong and helped contribute to the strong GDP report, as the economy posted its strongest gain since the first quarter of 2015. However, solid consumer spending has failed to boost inflation, which continues to hover at low levels. The lack of inflation could hamper the Federal Reserve's plans to raise interest rates, with the likelihood of a rate hike in December standing at just 35%. Nonfarm Payrolls report will be released on Friday, and if this indicator also beats the forecast, it would be a strong signal that the economic momentum has continued into the third quarter.
The euro has enjoyed a strong run against in the dollar in recent months, jumping 12.0% since April 1. On Tuesday, the currency pushed above the 1.20 level for the first time since January 2015. The euro has benefited from stronger growth in the eurozone in 2017, led by robust growth in Germany. As well, investors are anticipating that the ECB will provide some guidance on plans regarding its asset purchase program (QE), which is scheduled to terminate in December. The ECB is widely expected to taper its QE program early next year, but so far has been mum about its plans. ECB President Mario Draghi opted not to discuss monetary policy at last week's meeting of central bankers at Jackson Hole, which has increased speculation that the issue will be addressed at the bank's policy meeting on September 7.
USD/JPY Mid-Day Outlook
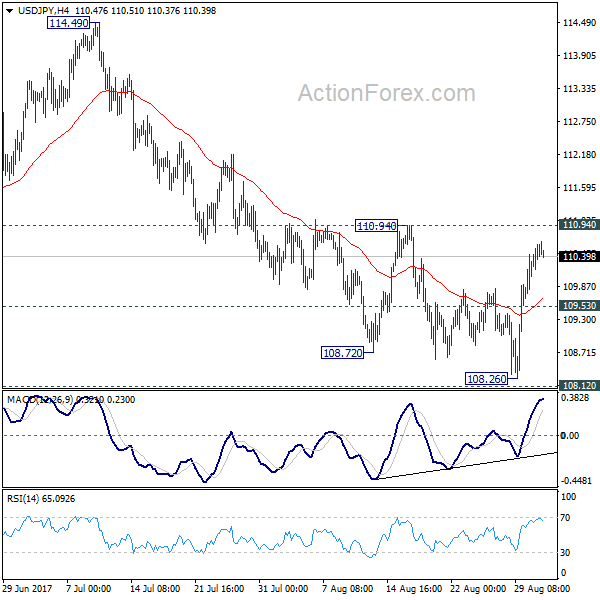
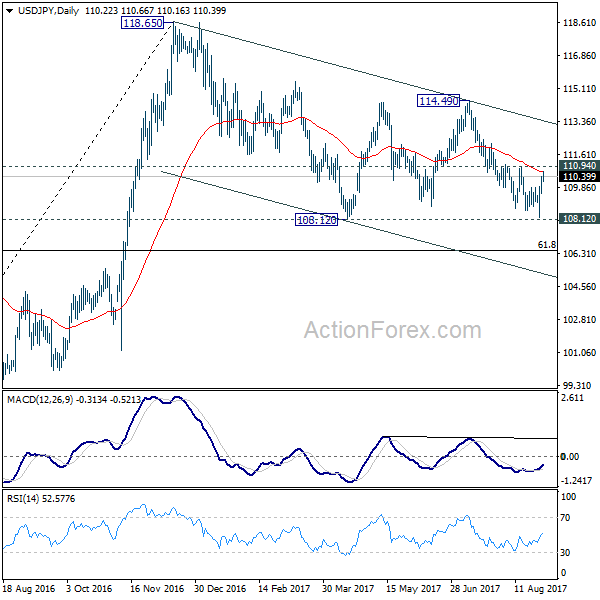
Daily Pivots: (S1) 109.69; (P) 110.06; (R1) 110.59; More...
No change in USD/JPY's bearish outlook as 110.94 remains intact. Deeper decline is still expected. On the downside, below 109.53 minor support will turn bias to the downside for 108.12 support first. Firm break of 108.12 support will resume the whole corrective decline from 118.65. In that case, USD/JPY will target 61.8% retracement of 98.97 to 118.65 at 106.48. Nonetheless, considering bullish convergence condition in 4 hour MACD, break of 110.94 will indicate near term reversal and bring stronger rebound back towards 114.49 resistance.
In the bigger picture, the corrective structure of the fall from 118.65 suggests that rise from 98.97 is not completed yet. Break of 118.65 will target a test on 125.85 high. At this point, it's uncertain whether rise from 98.97 is resuming the long term up trend from 75.56, or it's a leg in the consolidation from 125.85. Hence, we'll be cautious on topping as it approaches 125.85. If fall from 118.65 extends lower, downside should be contained by 61.8% retracement of 98.97 to 118.65 at 106.48 and bring rebound.
USD/CHF Mid-Day Outlook
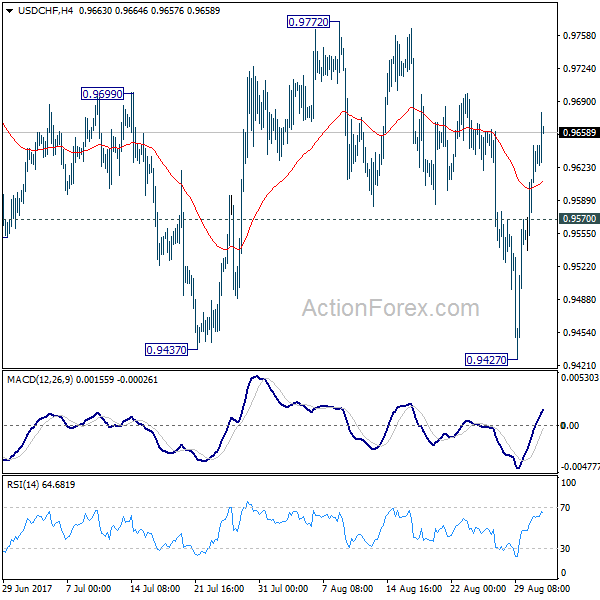
Daily Pivots: (S1) 0.9567; (P) 0.9606; (R1) 0.9674; More....
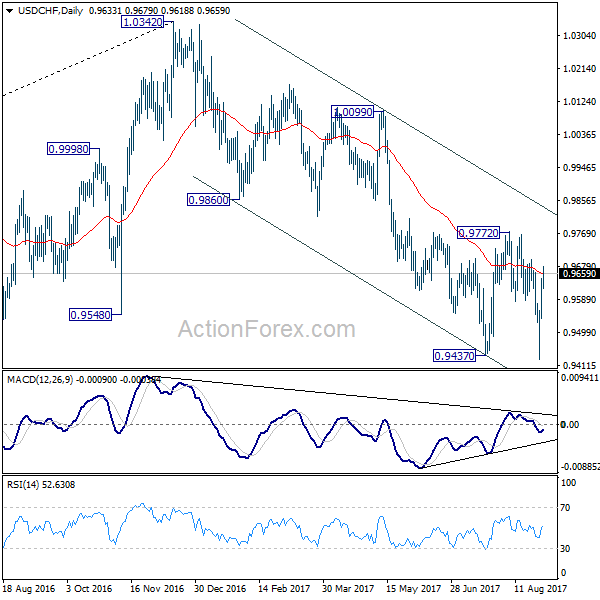
Considering the USD/CHF is close to to 0.9443 key support, consolidation from 0.9427 might extend further. But still, break of 0.9772 resistance is needed to confirm near term reversal. Otherwise, outlook stays bearish for another decline. Below 0.9537 minor support will turn bias back to the downside for retesting 0.9427 first. Break of 0.9427 will resume whole decline from 1.3042.
In the bigger picture, current development suggests that 0.9443 key support (2016 low) could be taken out firmly as down trend form 1.0342 extends. There are various interpretation of the price actions. But in any case, medium term outlook will stay bearish as long as 0.9772 resistance holds. Current down trend could extend to 38.2% retracement of 0.7065 (2011 low) to 1.0342 (2016 high) at 0.9090.
GBP/USD Mid-Day Outlook
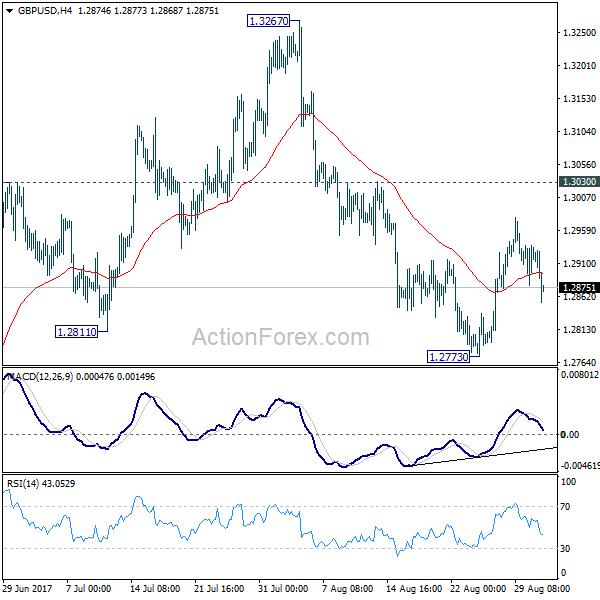
Daily Pivots: (S1) 1.2888; (P) 1.2912; (R1) 1.2947; More...
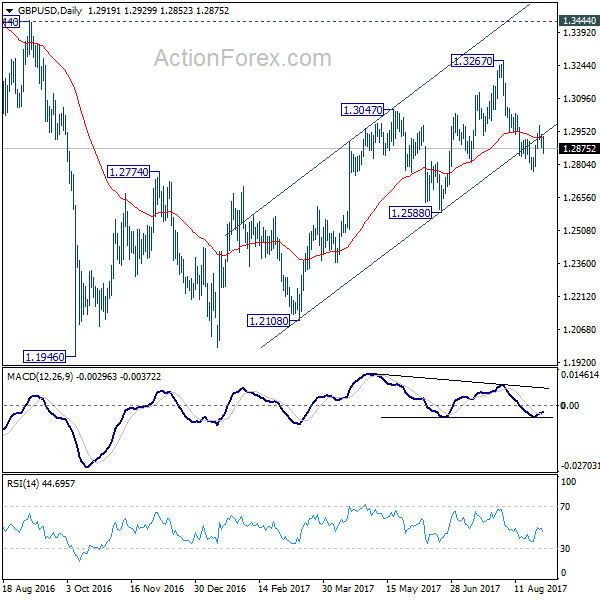
While consolidation from 1.2773 is still in progress, there is no change in the bearish outlook in GBP/USD. We're favoring the case that correction from 1.1946 is completed at 1.3267. Below 1.2773 will target 1.2588 key near term support first. Decisive break of 1.2588 will confirm our view and target a test on 1.1946 low. Though, break of 1.3030 will dampen this bearish view and turn bias back to the upside for retesting 1.3267.
In the bigger picture, overall, price actions from 1.1946 medium term low are seen as a corrective pattern. While further rise cannot be ruled out, larger outlook remains bearish as long as 1.3444 key resistance holds. Down trend from 1.7190 (2014 high) is expected to resume later after the correction completes. And break of 1.2588 will indicate that such down trend is resuming.
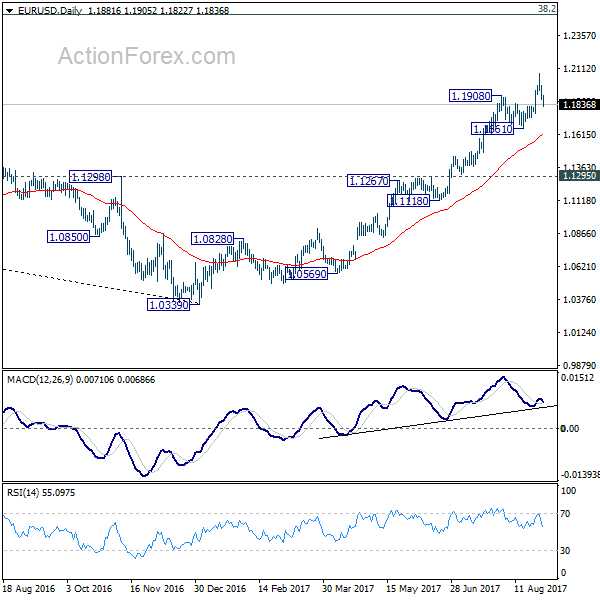
EUR/USD Mid-Day Outlook
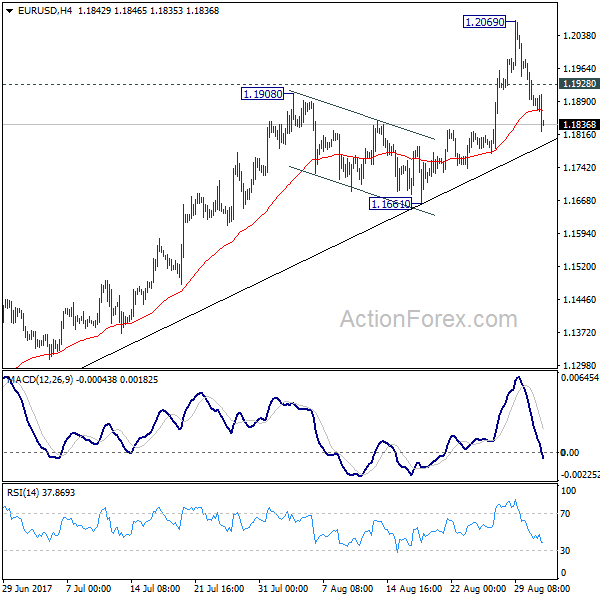
Daily Pivots: (S1) 1.1847; (P) 1.1915 (R1) 1.1950; More...
EUR/USD's pull back from 1.2069 extends to as low as 1.1822 so far today but it's staying well above 1.1661 support. That is, near term outlook remains bullish as further rise is still expected. Above 1.1928 minor resistance will turn intraday bias back to the upside for retesting 1.2069 high first. Decisive break there will resume whole up trend from 1.0339. This will remain the preferred case as long as 1.1661 holds. However, firm break of 1.1661 will confirm short term topping and bring deeper pull back.
In the bigger picture, an important bottom was formed at 1.0339 on bullish convergence condition in weekly MACD. Sustained trading above 55 month EMA (now at 1.1768) will pave the way to key fibonacci level at 38.2% retracement of 1.6039 (2008 high) to 1.0339 (2017 low) at 1.2516. While rise from 1.0339 is strong, there is no confirmation that it's developing into a long term up trend yet. Hence, we'll be cautious on strong resistance from 1.2516 to limit upside. For now, medium term outlook will remain bullish as long as 1.1295 support holds, in case of pull back.
Euro Hammered as ECB’s Concerned with Currency Strength, Dollar Outshone by Canadian Dollar
Sharp pull back in Euro and strong rebound in the Dollar are the main themes in the forex markets today. The common currency is weighed down by reports that "unnamed" ECB officials are concerned with its strength. And ECB might opt to "muddle" through the September meeting instead of announcing some solid tapering plan. That's more that offset the supposed positive boost from stronger than expected Eurozone CPI. On the other hand, Dollar continues to regain grounds as supported by positive economic data. Nonetheless, Canadian Dollar is indeed the strongest one today as lifted by stronger than expected GDP growth. New Zealand Dollar stays the weakest but Sterling catching up as another round of Brexit negotiation is concluded without any progress.
Released in US session, personal income rose 0.4% in July versus expectation of 0.3%. Personal spending rose 0.3% versus expectation of 0.4%. Headline PCE deflator was unchanged at 1.4%, in line with consensus. PCE core slowed 0.1% yoy to 1.4% yoy, meeting expectation. Initial jobless claims rose 1k to 236k in the week ended August 26, slightly below expectation of 237k. Continuing claims dropped -12k to 1.94m in the week ended August 19. From Canada, GDP rose 0.3% mom in June,, much higher than expectation of 0.1%.
ECB concerned with Euro strength, may muddle-through September meeting
Euro receives no support from stronger than expected inflation data released today. Instead, the common currency is weighed down by reports that ECB officials are very concerned with the appreciation in exchanged rated. ECB President Mario Draghi promised to discuss QE in Autumn. And markets have been expecting the central bank to announce some sort of tapering of its EUR 60b per month asset purchase program.
However, Reuters quoted an "unnamed" source saying that "the exchange rate has become a bigger issue." And "it is now less favorable for an exit and a stronger argument for a muddle-through option." Another unnamed source was quoted "the huge appreciation in the euro is already causing monetary tightening and is equivalent to an increase in interest rates." However, a third source was quoted saying that "you can't have it both ways - a strong economy and at the same time a weak currency... You should also not call it euro 'strength' but rather 'non-weakness'."
Eurozone CPI rose to 1.5% yoy in August, up from 1.3% yoy, beat expectation of 1.4% yoy. Core CPI was unchanged at 1.2% yoy, in line with consensus. Germany unemployment dropped -5k in August, unemployment rate was unchanged at 5.7%.
No decisive progress in Brexit negotiation
EU chief Brexit negotiator Michel Barnier expressed his frustration as the third round of negotiation with UK concludes today. Barnier said there has been "no decisive progress" on key issues even though there had been some "fruitful" discussions. And the negotiations are still "quite far" away from making significant progress to move on to trade agreements. And he complained there are issues of "trust" between the parties. And, he is "impatient... I am not angry... I am impatient and determined."
On the other hand, UK Brexit Secretary David Davis said there were "some concrete progress". And there were "long and detailed discussions across multiple areas". Davis reiterated that "it's only through flexibility and imagination that we will achieve a deal that works truly for both sides.
BoE Saunders: Brexit risks don't justify keeping rate low
BoE MPC member Michael Saunders, a known hawk, said that Brexit risks are not enough to justify keeping interest rate at record low. He acknowledged that "Brexit process might be bumpy, and could undermine business and consumer confidence." But he emphasized that "we should not maintain an overly loose stance as insurance against this scenario. Rather, we should be prepared to respond as needed if it happens." He used an analogy that "we do not need to be putting the brakes on so much that the economy weakens sharply." But, "our foot no longer needs to be quite so firmly on the accelerator in my view." And he urged that "a modest rise in rates would help ensure a sustainable return of inflation to target over time. Saunders have been voting for a 25bps with fellow MPC member Ian McCafferty since June.
Japan PM Abe urged "transparency and predictability" in Brexit negotiation
In Japan, Prime Minister Shinzo Abe attended a Japan-UK business forum in Tokyo today, alongside UK Prime Minister Theresa May. Abe sounded diplomatic and said he's convinced that UK will remain a "compelling" place for Japanese businesses. But he stressed that Brexit has to be "successful for UK, EU and global economy:" Abe also urged "transparency and predictability" regarding Brexit negotiations to "minimize any damage on businesses." May said that "we will also seek to ensure the freest and most frictionless trade possible between the UK and the EU, and this includes the imperative of a smooth and orderly transition for people and businesses, in the UK and in Japan."
BoJ Masai: "Momentum towards achieving the target is strengthening"
BoJ board member Takako Masai said that there is still "some distance" to achieve the 2% inflation target. And there are "geopolitical risks" that could "trigger market turmoil and hurt sentiment". But she noted that "recent data has shown some encouraging signs" And "momentum towards achieving the target is strengthening." Steady rise in household income and tightening job markets will eventually boost domestic demand and push inflation up to target. BoJ has repeatedly pushed back the timing for hitting the 2% inflation target. And now, the central bank projected it will be achieved by March 2020. Masai said that the delay was "unfortunate" and emphasized that it's important to "pursue policy to lay the groundwork for achieving 2 percent inflation."
ANZ business confidence points to broad based economic expansion
New Zealand ANZ business confidence dropped to 18.3 in August, down from 19.4. That is, a net 18.3% of firms surveyed expect general business condition to improve over the coming year. ANZ bank chief economist Cameron Bagrie said that theses are "healthy readings for confidence, activity expectation, investment and employment across all sectors and regions". And, there is a broad-based economic expansion in operation".
RBNZ governor Graeme Wheeler said yesterday that "a lower New Zealand dollar is needed to increase tradables inflation and help deliver more balanced growth." And, "the appreciation in the exchange rate has been a headwind for the tradables sector and, by reducing already weak tradables inflation, made it more difficult to reach the Bank's inflation goals."
EUR/USD Mid-Day Outlook
Daily Pivots: (S1) 1.1847; (P) 1.1915 (R1) 1.1950; More...
EUR/USD's pull back from 1.2069 extends to as low as 1.1822 so far today but it's staying well above 1.1661 support. That is, near term outlook remains bullish as further rise is still expected. Above 1.1928 minor resistance will turn intraday bias back to the upside for retesting 1.2069 high first. Decisive break there will resume whole up trend from 1.0339. This will remain the preferred case as long as 1.1661 holds. However, firm break of 1.1661 will confirm short term topping and bring deeper pull back.
In the bigger picture, an important bottom was formed at 1.0339 on bullish convergence condition in weekly MACD. Sustained trading above 55 month EMA (now at 1.1768) will pave the way to key fibonacci level at 38.2% retracement of 1.6039 (2008 high) to 1.0339 (2017 low) at 1.2516. While rise from 1.0339 is strong, there is no confirmation that it's developing into a long term up trend yet. Hence, we'll be cautious on strong resistance from 1.2516 to limit upside. For now, medium term outlook will remain bullish as long as 1.1295 support holds, in case of pull back.
Economic Indicators Update
| GMT | Ccy | Events | Actual | Forecast | Previous | Revised |
|---|---|---|---|---|---|---|
| 23:01 | GBP | GfK Consumer Confidence Aug | -10 | -13 | -12 | |
| 23:50 | JPY | Industrial Production M/M Jul P | -0.80% | -0.30% | 2.20% | |
| 01:00 | NZD | ANZ Business Confidence Aug | 18.3 | 19.4 | ||
| 01:00 | AUD | HIA New Home Sales M/M Jul | -3.70% | -6.90% | ||
| 01:00 | CNY | Manufacturing PMI Aug | 51.7 | 51.3 | 51.4 | |
| 01:00 | CNY | Non-manufacturing PMI Aug | 53.4 | 54.5 | ||
| 01:30 | AUD | Private Capital Expenditure Q2 | 0.80% | 0.20% | 0.30% | 0.90% |
| 05:00 | JPY | Housing Starts Y/Y Jul | -2.30% | -0.30% | 1.70% | |
| 06:00 | EUR | German Retail Sales M/M Jul | -1.20% | -0.60% | 1.10% | 1.30% |
| 07:55 | EUR | German Unemployment Change Aug | -5K | -6K | -9K | |
| 07:55 | EUR | German Unemployment Rate Aug | 5.70% | 5.70% | 5.70% | |
| 09:00 | EUR | Eurozone Unemployment Rate Jul | 9.10% | 9.10% | 9.10% | |
| 09:00 | EUR | Eurozone CPI Estimate Y/Y Aug | 1.50% | 1.40% | 1.30% | |
| 09:00 | EUR | Eurozone CPI - Core Y/Y Aug A | 1.20% | 1.20% | 1.20% | |
| 11:30 | USD | Challenger Job Cuts Y/Y Aug | 5.10% | -37.60% | ||
| 12:30 | CAD | GDP M/M Jun | 0.30% | 0.10% | 0.60% | |
| 12:30 | USD | Initial Jobless Claims (AUG 26) | 236K | 237K | 234K | 235K |
| 12:30 | USD | Personal Income Jul | 0.40% | 0.30% | 0.00% | |
| 12:30 | USD | Personal Spending Jul | 0.30% | 0.40% | 0.10% | 0.20% |
| 12:30 | USD | PCE Deflator M/M Jul | 0.10% | 0.10% | 0.00% | |
| 12:30 | USD | PCE Deflator Y/Y Jul | 1.40% | 1.40% | 1.40% | |
| 12:30 | USD | PCE Core M/M Jul | 0.10% | 0.10% | 0.10% | |
| 12:30 | USD | PCE Core Y/Y Jul | 1.40% | 1.40% | 1.50% | |
| 13:45 | USD | Chicago PMI Aug | 59.2 | 58.9 | ||
| 14:00 | USD | Pending Home Sales M/M Jul | 0.50% | 1.50% | ||
| 14:30 | USD | Natural Gas Storage | 43B |
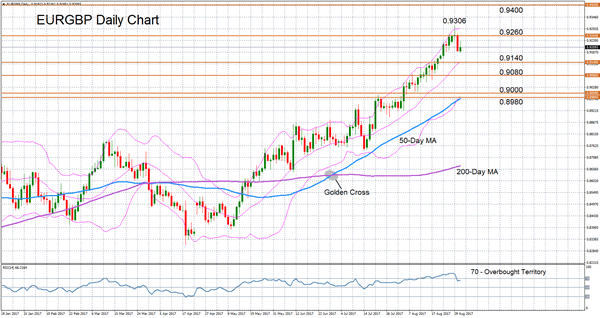
EURGBP Loses Steam But Still Strongly Bullish
EURGBP lost some steam yesterday as the pair retreated from Wednesday’s near 8-year high of 0.9306. The pull-back was expected given that the RSI had risen to extremely overbought territory. Another signal for a downside reversal came from the Bollinger bands. Prices had been trading close to the upper Bollinger band since the beginning of August and spiked above it on Wednesday.
The RSI is slightly up today and approaching the 70 level again, suggesting the near-term bias remains strongly bullish despite the easing of the upside momentum.
Should there be a further deterioration in the short-term bias, support is expected to come from the middle Bollinger band at around 0.9140. Further down, the previous support area around 0.9080 and the key 0.90 level will likely act as support. A breach of these levels would open the way towards the lower Bollinger band, which is currently just above the 50-day moving average, marking the region around 0.8980 as another important support area.
On the upside, the October 2016 peak of 0.9260 has re-emerged as a strong resistance level during the past week, with prices struggling to close above this point. A daily close above 0.9260 should enable the pair to challenge this week’s high of 0.9306. A break above this level would bring into view the psychological 0.94 handle.
Looking at the medium-term outlook, the strong bullish structure remains intact, with price action sharply above the upward sloping 50- and 200-day moving averages.