
Sample Category Title
Appetite For U.S Dollar Surges, EUR Pounded
Thursday August 31: Five things the markets are talking about
Capital markets have temporarily rediscovered an appetite for the 'big' dollar and commodities overnight as upbeat Chinese and U.S economic news has increased the demand for riskier assets globally, despite anxieties over North Korea bubbling in the background.
Data Thursday showed that China's manufacturing PMI (51.7 vs. 51.3) further strengthened this month, defying the markets forecasts for a decline. That came after a report yesterday showing U.S Q2 GDP growth reached its fastest pace in two-years on stronger household spending and gains in business investment.
Also stateside, Wednesday's ADP private payrolls indicated robust hiring in August, ahead of tomorrow's U.S non-farm payroll (NFP) report, which could give the market a clue or two on the timing of the Fed's next rate move.
This morning, the U.S releases a key personal consumption expenditure report that the Fed looks at (08:30 am EDT) ahead of tomorrow's granddaddy of economic indicators – U.S non-farm payrolls (NFP – 08:30 am EDT).
1. Stocks get the green light
In Japan, the 'big' dollars strength has taken some of the pressure off the yen (¥110.51) sending Japan equities higher. Overnight, the Nikkei share average (+0.7%) rallied to two-week highs as a weaker yen lifted cyclical stocks such as automakers and financial companies. For the month, the index has slipped -1.4%. The broader Topix gained +0.6%.
Note: Globally, investors remain nervous about the prospect of a U.S government shutdown, and a potential debt default if lawmakers don't raise the U.S debt ceiling by the end of next month, and then there is North Korea.
Down-under, Australia's S&P/ASX 500 Index added +0.8%, while South Korea's Kospi retreated -0.4%.
In Hong Kong, stocks eased overnight, but posted an eighth consecutive month of gains as China's economic recovery and continuous money inflows from the mainland sustained the bullish momentum. The Hang Seng index fell -0.4%, while the China Enterprises Index lost -0.7%. But for the month, the Hang Seng gained +2.4%.
In China, Shanghai stocks ease, but capped their third month of gains on solid earnings. The blue-chip CSI300 index fell -0.3%, while the Shanghai Composite Index shed -0.1%. For the month, CSI300 rose +2.3%, while the SSEC advanced +2.7%.
In Europe, indices continue to recover, trading modestly higher across the board, with grains ranging from +0.4% to +0.7%. Mining and construction stocks lead the decliners on the FTSE, while on the CAC, the retail sector weighs.
U.S stocks are set to open in the black (+0.3%).
Indices: Stoxx600 +0.5% at 373, FTSE +0.6% at 7412, DAX +0.5% at 12061, CAC-40 +0.5% at 5081, IBEX-35 +0.7% at 10315, FTSE MIB +0.6% at 21630, SMI +0.5% at 8897, S&P 500 Futures +0.3%
2. U.S gas hits $2 a gallon as Harvey impedes refiners, crude and gold weak
U.S gas prices have hit +$2 a gallon for the first time in two years this morning as flooding from storm Harvey knocked out almost a quarter of U.S refineries, while crude prices remain weak as demand has dropped following the outages.
Note: Due to Harvey, at least +4.4m bpd of refining capacity remains offline. The closure of so many U.S refineries has resulted in a slump in demand for crude oil for the petroleum industry.
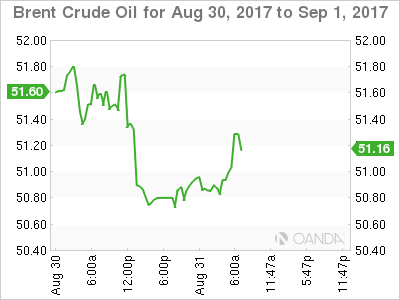
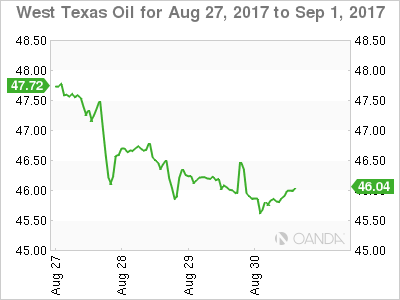
The temporary closure of refineries is a major dent to U.S crude demand and is weighing on both Brent and WTI prices. Brent crude is trading at +$50.74 a barrel, down -12c from Wednesday, when the contract fell by more than -2%. U.S West Texas Intermediate (WTI) crude futures are trading at +$46 per barrel, slightly above yesterday's close, when prices fell by -0.8% intraday.
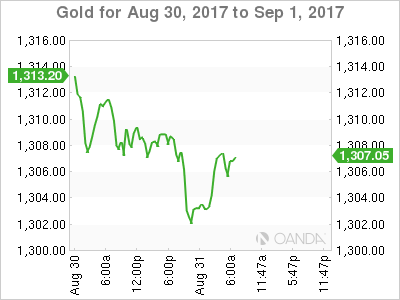
Ahead of the U.S open, gold has slipped a tad as the dollar finds some traction on positive economic data from China and the U.S over the last 24-hours, but continues to hold above the key psychological +$1,300-an-ounce level as safe haven demand due to North Korean tensions cap losses. Spot gold is down -0.4% at +$1,303.11 per ounce and remains on track for a near +3% monthly gain.
3. Sovereign yields fall on the month due to geopolitical concerns
European and U.S bond markets have been caught this week between a stronger tone to economic data globally, putting upward pressure on yields, and concern about rising tensions with North Korea which have boosted demand for safe-haven debt.
The flows back into safe-haven eurozone debt product this month came after a sharp selloff in July on concerns about a scaling back of ECB monetary stimulus.
German Bunds yields are down about -17 bps in August – the biggest fall since February. Currently, 10-year Bund yield is up just +1 bps at +0.37%, edging away from two-month lows hit earlier this week at +0.32%.
In Japan, the Bank of Japan (BoJ) plans to purchase ¥300-500B JGB's this month which mature in 5-10 years. That's -¥50B less than August's stated range.
The announcement could be seen as the BoJ tapering by stealth amid concerns it may soon hit the limit of JGB's it can buy from the market.
Elsewhere, the Bank of Korea (BoK) left its Repo Rate unchanged at +1.25% overnight (as expected), for its 14th straight pause in the current easing cycle. S. Korean policy makers reiterated to maintain the current stance of policy accommodation.
Ahead of the U.S open, the yield on U.S 10-year Treasuries have backed up +2 bps to +2.15%.
4. Dollar finds support
The USD continues its recent recovery with many attributing the need to pass a disaster relief package for Hurricane Harvey might make it easier for Congress to raise the debt ceiling next month and stronger data in the last two sessions is supporting the greenback.
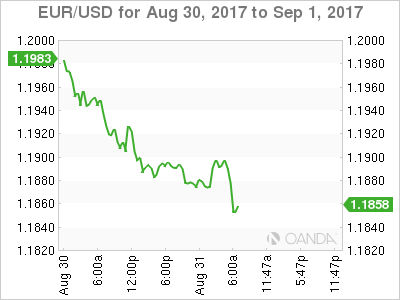
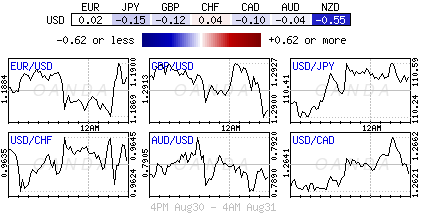
The EUR/USD (€1.1885) is trading under pressure and has backed off two-big figures from its 2 ½ high (€1.2069). The rapid rise is certainly a concern for the ECB, as it would impede the improvement on EU inflation front.
Note: The ECB meeting is coming up next week and there are rising risks of verbal intervention from Draghi on the EUR's appreciation. Already, France Finance Minister Le Mairea did some verbal intervention noting that a stronger EUR was a 'concern for their domestic economy.'
USD/JPY (¥110.63) is back at its two-week high as geopolitical worries over the Korean Peninsula situation have eased a tad. The US/South Korean military drills are nearing its scheduled end.
GBP (£1.2876) is lower and has ignored commentary by BoE 'hawk' Saunders that the U.K could handle raising interest rates and warned of getting 'behind the curve.'
5. Euro Zone Aug CPI edges higher but still distant from ECB target
Data this morning showed that inflation in the eurozone picked up markedly this month and that the jobless rate remained at its lowest level for over eight years, supporting expectations that the ECB will soon announce a gradual withdrawal from its massive stimulus programs.
The E.U's statistics agency said the region's annual inflation rate rose to +1.5% from +1.3% in July, propelled by energy prices.
Note: Despite the outcome being higher than the +1.4% expected, eurozone inflation continues to undershoot the ECB's target of 'below, but close to' 2%.
The ECB has come under pressure to wind down its stimulus programs from Germany and the market is preparing itself for next week's ECB monetary policy meeting where Draghi could potentially announce something re tapering (Sept. 7).
Other data showed that the eurozone's unemployment rate was stable at +9.1% in July, which marks the lowest level since February 2009.
EUR/USD Slips As German Retail Sales Falters
EUR/USD has posted slight gains in the Thursday session. Currently the pair is trading at 1.1860, down 0.21% on the day. On the release front, German Retail Sales declined 1.2%, weaker than the estimate of -0.5%. Euro zone CPI Flash Estimate accelerated to 1.5%, edging above the forecast of 1.4%. In the US, unemployment claims are expected to rise slightly to 237 thousand. As well, Personal Spending is expected to improve to 0.4%. On Friday, the US releases key employment data. Average Hourly Earnings is expected to edge lower to 0.2%, and the markets are braced for Nonfarm Employment Change to drop to 180 thousand.
US numbers looked sharp on Wednesday, and the dollar responded with considerable gains against the euro. Preliminary GDP (second estimate) for the second quarter was revised to 3.0%, a marked improvement from the first estimate of 2.6%. Consumer confidence and spending remain strong and helped contribute to the strong GDP report, as the economy posted its strongest gain since the first quarter of 2015. However, solid consumer spending has failed to boost inflation, which continues to hover at low levels. The lack of inflation could hamper the Federal Reserve's plans to raise interest rates, with the likelihood of a rate hike in December standing at just 35%. On the employment front, ADP Nonfarm Payrolls jumped to 237 thousand, marking a 3-month high. The official Nonfarm Payrolls report will be released on Friday, and if this indicator also beats the forecast, it would be a strong signal that the economic momentum has continued into the third quarter.
The euro has enjoyed a strong run against in the dollar in recent months, jumping 12.0% since April 1. On Tuesday, the currency pushed above the 1.20 level for the first time since January 2015. The euro has benefited from stronger growth in the eurozone in 2017, led by robust growth in Germany. As well, investors are anticipating that the ECB will provide some guidance on plans regarding its asset purchase program (QE), which is scheduled to terminate in December. The ECB is widely expected to taper its QE program early next year, but so far has been mum about its plans. ECB President Mario Draghi opted not to discuss monetary policy at last week's meeting of central bankers at Jackson Hole, which has increased speculation that the issue will be addressed at the bank's policy meeting on September 7.
AUD/USD Moving Lower
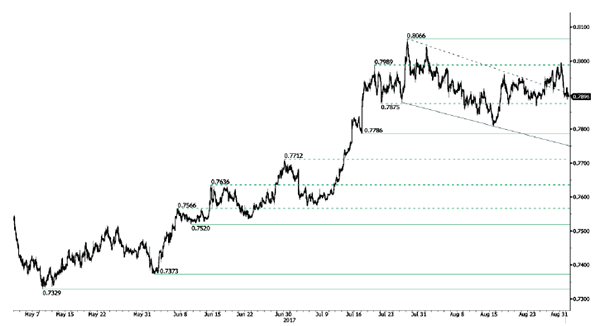
AUD/USD has broken downtrend channel. Hourly support can be found at 0.7786 (18/07/2017 low). Hourly resistance is given at 0.8066 (27/07/2017 high). Expected to further consolidate.
In the long-term, we are waiting for further signs that the current downtrend is ending. Key supports stand at 0.6009 (31/10/2008 low) . A break of the key resistance at 0.8295 (15/01/2015 high) is needed to invalidate our long-term bearish view.
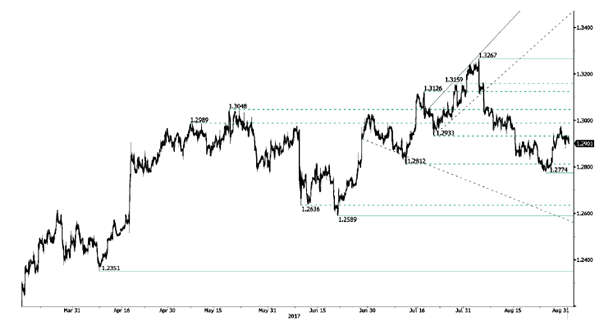
USD/CAD Heading Higher
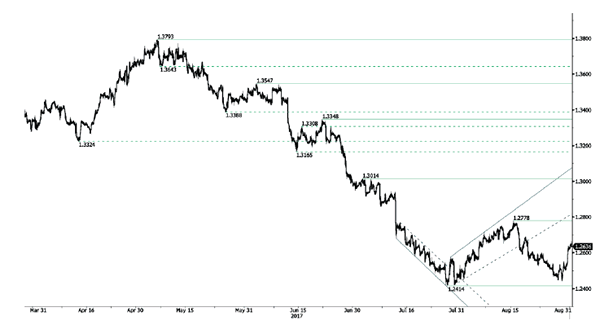
USD/CAD buying pressures are back. Hourly support is given at a distance at 1.2414 (27/07/2017 low) while resistance is now given at a distance at 1.2778 (15/08/2017 low). Expected to show renewed short-term bearish pressures if resistance at 1.2778 holds.
In the longer term, the pair has broken longterm support that can be found at 1.2461 (16/03/2015 low) before bouncing back. Strong resistance is given at 1.4690 (22/01/2016 high). The pair should head further lower.
USD/CHF Bouncing Back Higher
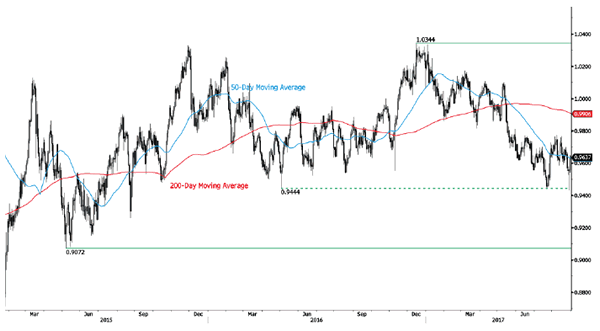
USD/CHF is trading up. Strong resistance is given at 0.9771 (15/06/2017 high). The pair is likely to head further lower way below the broken hourly support at 0.9584 (08/11/2017 low). Expected to show renewed bearish pressures.
In the long-term, the pair is still trading in range since 2011 despite some turmoil when the SNB unpegged the CHF. Key support can be found 0.8986 (30/01/2015 low). The technical structure favours nonetheless a long term bullish bias since the unpeg in January 2015
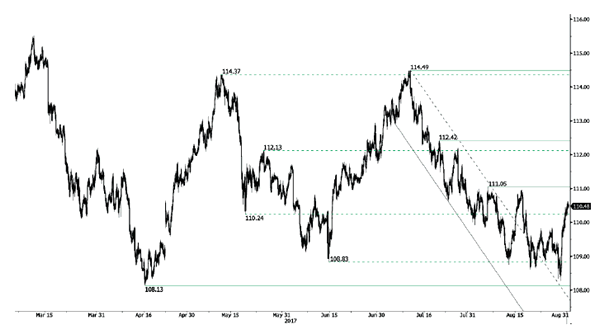
USD/JPY Short-Term Increase
USD/JPY is bouncing off support at 108.13 (17/04/2017 low). The pair is heading towards resistance at 111.05 (04/08/2017 high). Expected to show another leg higher.
We favor a long-term bearish bias. Support is now given at 96.57 (10/08/2013 low). A gradual rise towards the major resistance at 135.15 (01/02/2002 high) seems absolutely unlikely. Expected to decline further support at 93.79 (13/06/2013 low).
GBP/USD Important Downside Risks
GBP/USD bearish momentum has bounced around support given at 1.2774 (24/08/2017 high). Hourly resistance is given at 1.3031 (11/08/2017 high). Expected to show short-term bearish pressures.
The long-term technical pattern is even more negative since the Brexit vote has paved the way for further decline. Long-term support given at 1.0520 (01/03/85) represents a decent target. Long-term resistance is given at 1.5018 (24/06/2015) and would indicate a long-term reversal in the negative trend. Yet, it is very unlikely at the moment.
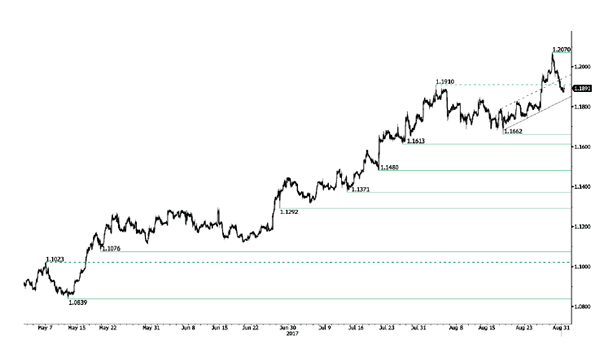
EUR/USD Continued Consolidation
EUR/USD is consolidating lower. Hourly resistance can be found at 1.2070 (29/08/2017 high) while hourly support lies at a distance at 1.1662 (17/08/2017 low). Expected to show increasing bearish pressures.
In the longer term, the momentum is now turning largely positive. We favour a continued bullish bias. Key resistance is holding at 1.2252 (25/12/2014 high) while strong support lies at 1.0341 (03/01/2017 low).
Strong Data Ignites Dollar Rally
USD buoyed amid upside surprise in growth data
The US dollar received a much needed fresh boost yesterday amid the release of better-than-expected data from the world’s largest economy. Firstly, the second print on the second quarter GDP was revised to 3%q/q (annualised) from 2.6% first estimate amid a substantial upside revision to customer spending and stronger business investment. Personal consumption edged up to 3.3%q/q (annualised) from 3%.
In the jobs market, the employment report released by ADP saw a sharp rise in payrolls in August. Us companies added 237,000 jobs in August (versus 189,000 estimated), while previous month’s reading was upwardly revised to 201,000 from 178,000. It does bode well for Friday’s NFPs!
The greenback extended gains against all G10 currencies yesterday. The worst performer was the New Zealand dollar that fell 1.35% with NZD/USD on its way to test its 200dma that currently stands at $0.7130. The Canadian dollar also suffered a small sell-off with USD/CAD climbing as high as 1.2663.
The show will go on today as a fresh batch of key data is due for release. Personal income and spending, which are both expected to have improved in July (+0.3%m/m and +0.4%m/m respectively) will be published this afternoon. Then the Fed’s favourite measure of inflation, core personal consumption expenditures, should have eased further in July as economists expect a reading of 1.4%y/y. Finally, July’s NFPs (180k exp and 205k prior), together with the complete jobs report, will be published on Friday.
The mood is slowly starting to shift in favour of the USD, finally. Therefore it is reasonable to expect the greenback to extend gains rapidly, especially should the US economy continue to surprise investors in a good way. After tumbling more 1.50% yesterday, EUR/USD takes a breather at around 1.1890. Even though we maintain our bearish on the pair, a negative surprise in data this afternoon could nip the USD recovery in the bud. Indeed, investors will remain highly sensitive to hard data ahead of the next FOMC meeting.
Hurricane Harvey may impact crude oil prices
The U.S Energy Department has released US inventories data which shows a decline of 5.932 million barrels during the week ending August 25. It is the ninth consecutive weeks of decline and crude oil has lost 1% and is now challenging its 6-week low.
The tropical storm Harvey is ravaging Houston and some US refineries out there are now closed temporarily. Yet, markets are clearly not fearing any potential shortages within the short-term. Indeed, Crude oil is most of the time very easy to replace. This is why we think that any shortage longer than a week or ten day will drive crude oil prices higher. For the time being, this natural disaster is not particularly weighing on prices.
The trend in the US rig count is bearish due to sustainable low prices. Now markets will start pricing in the next OPEC meeting late November. We do not consider that any production cut will be applied. The market share war will continue and no relief to the US refinery industry are on the roadmap.
Anyway, we keep on believing that the upside pressures on oil are likely. In particular, at the moment, there is a seasonal effect that is back. In September the demand for crude oil is likely to increase as the summer season is over and overproducing oil is definitely not a viable long-term project.
Crude Oil Drops As Harvey Swamps Inventories
Crude couldn't rally on much lower inventories as Harvey and spread trading swamps Brent Crude finally.
Hurricane Harvey submerged another massive drawdown in the official U.S. Crude Inventories last night, washing Brent by two percent in the process. The reduction came in at -5.4 million barrels against an expected 1.75 million drawdown. It continues the trend of falling oil in storage in the U.S. The data, however, was collected pre-Harvey and with fully 25% of the U.S. refining capacity offline, the stress is being felt in refined downstream products with gasoline process hitting two-year highs. Next week's inventory numbers, should the data even be able to be collected, will likely show a substantial increase as crude pumped out of the ground searches for a refinery home to go to that isn't under water.
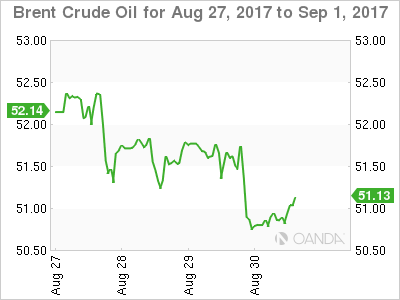
Brent
Brent spot fell from 51.75 to 50.75, trading in Asia a smidgen higher at 50.85 this morning. It has broken a rising trend line support at 51.10 in the process which becomes intraday resistance. Must hold support now is a triple bottom at 49.90 with a daily close implying a deeper correction is possible to the 47.00 area. Until this line is broken, however, the technical picture remains that Brent is in a long term consolidation of its past month's gains.
WTI
WTI spot, by contrast, fell only 50 cents overnight from 46.20 to 45.70, opening in Asia at 45.80. The relative outperformance versus Brent could be due to a couple of factors. Firstly, a lot of Hurricane Harvey bad news is now built into the price against a background of lower inventories anyway. Secondly, with the premium of Brent over WTI having moved to multi-year highs, traders may have been tempted to sell Brent and buy WTI to take advantage of this.
WTI spot has support at the 45.00 area and resistance at 47.00, but will most likely trade of Harvey headlines and spread traders.