Sample Category Title
Stronger than Expected Eurozone Flash CPI Fails to Lift Struggling Euro
Following the rise in the Eurozone's economic sentiment gauge published yesterday, which peaked at the highest level in August since the global financial crisis, inflation for the same month based on flash estimates showed signs of acceleration, while unemployment remained steady. Although the data increase the odds of policy tightening by the ECB at the policy meeting next week, the euro reacted negatively.
According to preliminary figures released by Eurostat on Thursday, Eurozone headline inflation rose to 1.5% y/y in August, after remaining flat at 1.3% the previous two months. This surprised analysts who expected flash HCPI to increase slightly to 1.4% y/y.
Eurostat anticipates that energy would be the main driver of inflation as energy prices are expected to increase by 4.0% in August, almost twice July's level of 2.2%. The remaining major components including services, food, and non-industrial goods are estimated to have held steady at 1.6%, 1.4%, and 0.5% respectively.
Core HCPI, which excludes food and energy items, matched forecasts, standing flat at 1.3% y/y.
In another report, Eurostat posted readings on Eurozone unemployment rate for the month of August. The numbers indicated that unemployment rate was in line with expectations at July's reading of 9.1%, which is the lowest rate reported since June 2009 when it was at 9.3%.
Among the three largest Eurozone economies, Germany experienced the highest increase in inflation on a yearly basis. Flash German HICP, which was released on Wednesday, jumped by 0.3 percentage points to 1.8%, surpassing the 1.7% forecasted. France and Italy, who published their readings today, saw their yearly flash index rising by 0.2 percentage points to 1.0% and 1.4%, respectively.
Month-on-month, Italy gained the most in terms of prices, with HCPI increasing by 2 percentage points to 0.1% from a negative 1.9% in July. French monthly HICP climbed by 1 percentage points to 0.6% while German HICP pulled back by 0.2 percentage points to 0.2% but was above the 0.1% expected.
Regarding unemployment rates in the above economies, the unemployment rate in Germany was unchanged at 5.7% while in Italy the rate inched up from 11.2%( upwardly revised from 11.1%) to 11.3%. French unemployment rate, which was reported earlier this month, slid to 9.5% q/q in the second quarter.
While increasing flash inflation should be good news for ECB policymakers, who are waiting for inflation to start approaching the 2% target before they decide to hike rates, concerns over a strengthening euro are mounting. This raises questions about the ECB's exit strategy from its asset purchases ahead of next Thursday's policy meeting in Frankfurt. The ECB is expected to announce its decision on tapering in the autumn before the current program expires at the end of 2017. Sources with a knowledge on the topic have said that asset purchases will be reduced only gradually.
As fears over a strengthening euro weighed on the markets, the euro failed to find support on the stronger-than-expected inflation readings. Euro/dollar dropped by 0.62% to a one-week low of 1.1822. Euro/pound reversed most of its earlier gains, falling by 0.34% to 0.9196, while euro/yen retreated by 0.52%, sinking to a session low of 130.78 before it inches up to 130.86.
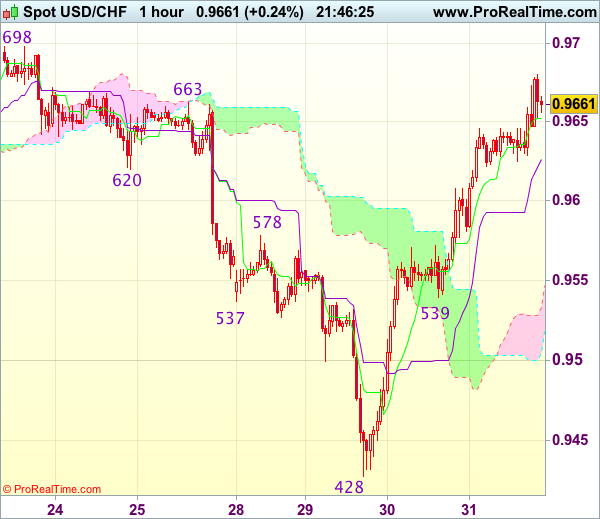
Trade Idea Update: USD/CHF – Buy at 0.9540
USD/CHF - 0.9659
Original strategy :
Buy at 0.9540, Target: 0.9640, Stop: 0.9505
Position : -
Target : -
Stop : -
New strategy :
Buy at 0.9540, Target: 0.9640, Stop: 0.9505
Position : -
Target : -
Stop : -
As the greenback surged again after this week’s rally from 0.9428, adding credence to our view that recent decline has ended there and upside bias remains for the rise from 0.9428 low to extend further gain to previous resistance at 0.9698-99, however, near term overbought condition should limit upside and reckon 0.9725-30 would hold on first testing, risk from there has increased for a retreat to take place later.
In view of this, we are looking to buy dollar on subsequent pullback as 0.9539 support should limit downside and bring another rebound later. Below 0.9500-10 would defer and suggest first leg of rise from 0.9428 has ended, risk weakness to 0.9470 but price should stay well above said support at 0.9428, bring another rebound.
Gold Trading In The Red
The yellow metal dropped significantly and resume the corrective phase. Is trading in the red even if buyers have stepped in and have pushed it above the $1306.50 per barrel. Gold decreased as the USD has managed to rebound and to recover versus all its rivals.
The USDX registered an amazing jump and is trading above the 93.30 level. The dollar index is almost to reach and retest a strong dynamic resistance, where he can find resistance again. A further USDX's increase will weaken the Gold even more.
Gold increased a little right after the United States data was released, but fundamentally should drop much deeper as the figures have come better than expected.
The Unemployment Claims increased from 235K to 236K in the previous week, has come in better versus the 237K estimate, while the Core PCE Price Index rose by 0.1%, matching expectations and the 0.1% growth in the former reading period.
The Personal Spending rose by 0.3%, less versus the 0.4% estimate, but the Personal Income surged by 0.4%, exceeding the 0.3% estimate.
You can see that the price has found strong resistance right below the warning line (WL1) of the major descending pitchfork and now has tried to retest the 23.6% retracement level, which represents an important static support.
The perspective remains bullish despite the minor decrease, technically is expected to climb much higher in the upcoming period after the breakout from the extended sideways movement.
Brent Should Hit New Lows
Price increased today and is fighting hard to recover after the impressive drop, but I'm afraid that is only a temporary rebound. Brent is expected to drop after the breakdown from the minor ascending channel.
The next downside target will be at the 50% retracement level, most likely will hit the sliding line as well. Actually, it could be attracted by the confluence between these two.
GBP/JPY Upside Paused
GBP/JPY reached new highs today, but wasn't able to stay near the 142.88 today's high and now is trading in the red. Could retest the upper median line of the minor descending pitchfork before will resume the upside movement. We'll see how long the rebound will go because has reached and important resistance area.
Trade Idea Update: GBP/USD – Hold long entered at 1.2855
GBP/USD - 1.2872
Original strategy :
Bought at 1.2855, Target: 1.2955, Stop: 1.2820
Position : - Long at 1.2855
Target : - 1.2955
Stop : - 1.2820
New strategy :
Hold long entered at 1.2855, Target: 1.2955, Stop: 1.2820
Position : - Long at 1.2855
Target : - 1.2955
Stop : - 1.2820
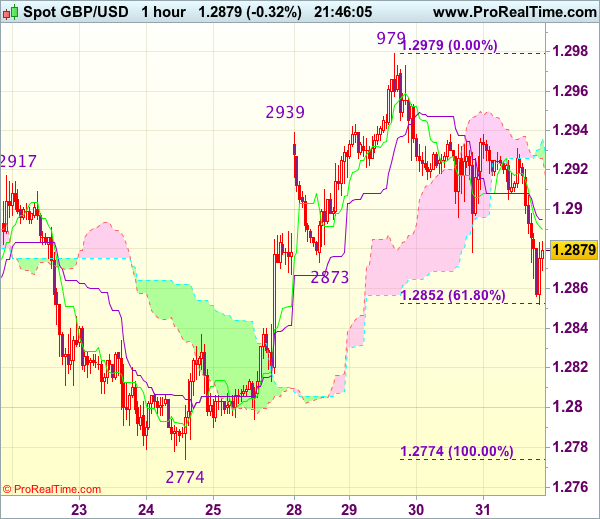
Although cable has dropped again after brief recovery and near term downside risk remains for the fall from 1.2979 (this week’s high) to extend marginal weakness, reckon downside would be limited to 1.2850-52 (61.8% Fibonacci retracement of 1.2774-1.2979) and bring rebound later, above 1.2935-40 would signal the retreat from 1.2979 has ended, bring retest of this level first.
In view of this, we are holding on to our long position entered at 1.2855. Below previous resistance at 1.2837 would defer and signal first leg of upmove from 1.2774 has ended, risk weakness to support at 1.2813 but price should stay well above support at 1.2774, bring another rebound later.
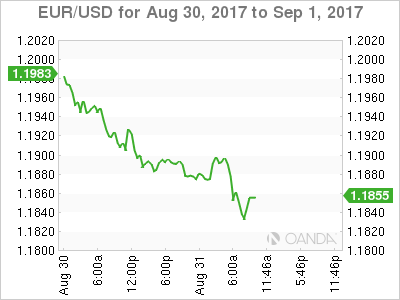
Trade Idea Update: EUR/USD – Sell at 1.1950
EUR/USD - 1.1860
Original strategy :
Sell at 1.1950, Target: 1.1850, Stop: 1.1985
Position : -
Target : -
Stop : -
New strategy :
Sell at 1.1950, Target: 1.1850, Stop: 1.1985
Position : -
Target : -
Stop : -
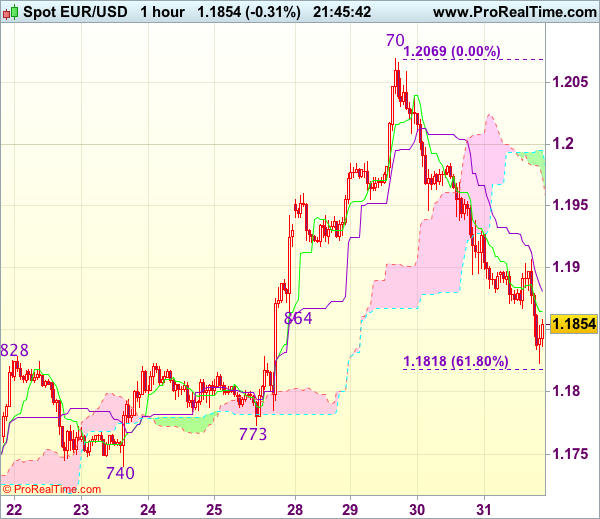
As the single currency has recovered after intra-day fall to 1.1823, suggesting consolidation above this level would be seen and corrective bounce to 1.1900-05 is likely, however, reckon upside would be limited to 1.1950-55 and bring another decline to 1.1815-18 (61.8% Fibonacci retracement of 1.1662-1.2070) but downside should be limited to 1.1790-00 and support at 1.1773 should remain intact.
In view of this, we are looking to sell euro on recovery as 1.1950-55 should limit upside. Above 1.1980-85 would risk a stronger rebound to 1.2005-10 but still reckon upside would be limited to 1.2035-40 and price should falter below said this week’s high at 1.2070, bring another retreat later.
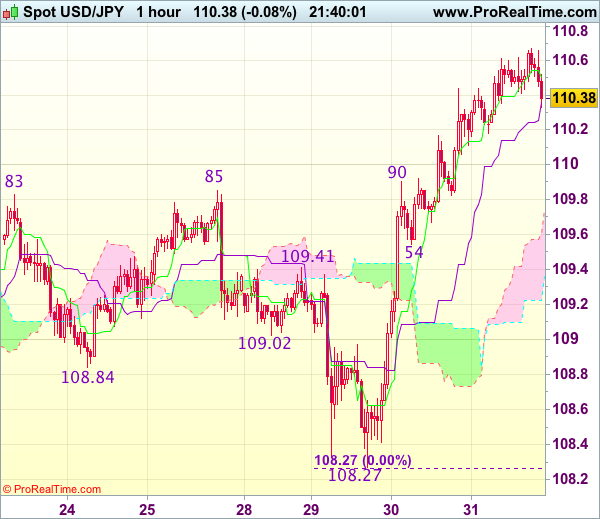
Trade Idea Update: USD/JPY – Buy at 109.80
USD/JPY - 110.39
Original strategy :
Buy at 109.95, Target: 110.95, Stop: 109.60
Position : -
Target : -
Stop : -
New strategy :
Buy at 109.80, Target: 110.80, Stop: 109.45
Position : -
Target : -
Stop : -
As the greenback has continued moving higher after rallying from 108.27 low, suggesting recent decline from 114.50 has ended there and consolidation with upside bias is seen for this move to bring retracement of said entire fall to 110.65 (38.2% Fibonacci retracement of 114.50-108.27), then towards 111.00, however, reckon upside would be limited to 111.15-20 and price should falter below 111.40 (approx. 50% Fibonacci retracement), bring retreat later due to near term overbought condition.
In view of this, would not chase this rise here and we are looking to buy dollar on pullback as previous resistance at 109.85-90 should turn into support and contain dollar’s downside. Only below support at 109.54 would abort and signal top is formed instead, bring weakness to 109.15-20.
Canadian Dollar Rises on Bets BoC to Hike after GDP Data
Canada Q2 GDP rises on exports and household spending
The Canadian economy surged in Q2, smashing all market expectations, and recorded its best 12-month run in over a decade, securing G7 strongest performer this year.
Canada's GDP rose at a +4.5% annualized rate in Q2, surpassing market expectations for a +3.7% increase.
Both exports and household spending were the main contributors toward the surprise performance.
The Q2 result likely cements the likelihood of at least one more rate increase from the Bank of Canada (BoC) in 2017. Governor Poloz in July raised its benchmark interest rate by +25 bps to +0.75%.
Fed's Inflation Conundrum Continues
The Fed's inflation conundrum shows no signs of letting up in today's U.S personal-income report.
Today's data shows that the Fed's preferred measure of inflation, the price index for personal consumption expenditures, was up +0.1% in July m/m. The price index rose +1.4% in July y/y, matching the y/y index change for prices ex-food and energy.
Note: This July price reading marked the lowest level in nearly two-years - in February, the annual inflation rate was +2.2%, and while core prices were up +1.9% y/y.
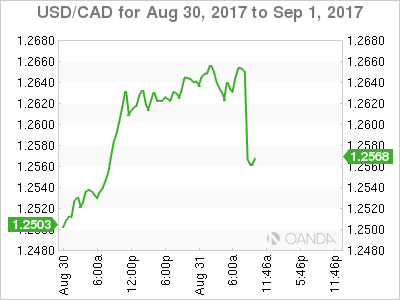
Canadian Dollar Jumps after GDP Data
Loonie jumped some 90 pips against the US dollar after Canadian GDP data showed better than expected results. Monthly GDP figure showed rise by 0.3% in June vs forecasted 0.1% increase while annualized GDP rose by 4.5% in Q2, beating forecast/Q1 result at 3.7%. Canadian dollar pared some of recent strong losses vs dollar on rally to 1.2560 zone so far, as USDCAD pair rose by 0.87% on Wednesday and extended gains today to fresh high at 1.2662 (the highest since 18 Aug). Fresh boost that Canadian dollar received from GDP data would spark further gains and stronger retracement of USDCAD's 1.2440/1.2662 recovery leg. Fresh post data acceleration took out initial support at 1.2577 (Fibo 38.2%), eyeing next supports at 1.2544 (10SMA / 4-hr cloud base) and 1.2525 (Fibo 61.8% of 1.2440/1.2662). Daily MA's are turning to full bearish setup, with negative momentum studies and overall action weighed by thick falling daily cloud, being supportive for further easing of USDCAD pair. Solid resistance lies at 1.2616, provided by 20SMA which limited double attempts above it (today/Wed) and maintains downside pressure.
Res: 1.2581; 1.2616; 1.2636; 1.2662
Sup: 1.2544; 1.2525; 1.2500; 1.2443