Sample Category Title
GBP/USD Heading Lower
GBP/USD continues to move lower. Hourly resistance is given at 1.2917 (18/08/2017 high). Hourly support at 1.2812 (12/07/2017 low) has been broken. Expected to show continued bearish pressures.
The long-term technical pattern is even more negative since the Brexit vote has paved the way for further decline. Long-term support given at 1.0520 (01/03/85) represents a decent target. Long-term resistance is given at 1.5018 (24/06/2015) and would indicate a long-term reversal in the negative trend. Yet, it is very unlikely at the moment.
EUR/USD Ready To Bounce Lower
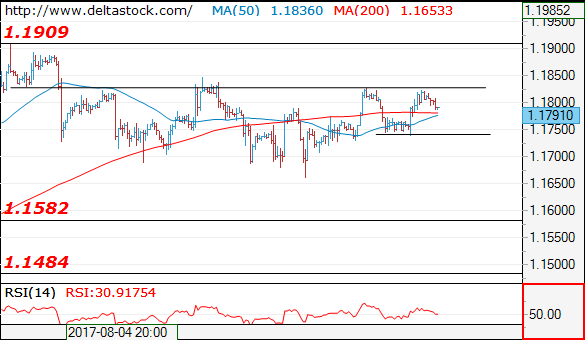
EUR/USD short-term bullish pressures are slowing down. Hourly resistance can be found at 1.1910 (02/08/2017 high) while hourly support lies at 1.1613 (26/07/2017 low). Expected to show renewed bearish pressures.
In the longer term, the momentum is now turning largely positive. We favour a continued bullish bias. Key resistance holding at 1.1871 (24/08/2015 high) has been broken while strong support lies at 1.0341 (03/01/2017 low).
All Eyes On Jackson Hole
Jackson Hole could surprise
After much hype, the annual Jackson Hole Economic Symposium is finally here. The highlight of the two day even will clearly be scheduled speeches by Fed Chair Yellen and ECB President Draghi (Aug 25th). Fed Chair Yellen expected to discuss “Financial Stability” which is likely to include views on current easing financial conditions. Perhaps it's the summer heat but the market remains blasé in not expected anything new from Yellen. However, Jackson Hole does have reputation for market moving events. Remember Draghi's game changing comment “whatever it takes to preserve the euro“. The FOMC minutes indicate the Fed is heading toward balance sheet reduction before rate hike. While balance sheet reduction are less supportive of USD we still expect a noticeable uptick as details and execution emerge.
It is possible judging from recent FOMC minutes at Yellen might argue that an increase in short-term interest rates will help support financial stability. Even if inflation outlook remains subdued (remaining view of transitory factors). In our view, confident Fed message in this direction should be viewed as hawkish and supports a rally in USD. From our perspective the markets is under-pricing Fed rate path due to recent softness in economic data and further concerns over trumps administration ability to achieve policy goals. Fed rate hikes market are pricing in a merger 40% probability of 25bp for 2017. A repricing will send short term yields higher (US 2-yr yields at 1.31%) and likely catch the markets flatfooted. Low yielding G10 currencies are particularly susceptible to a rise in US yields. In regards to Draghi we suspect he will let Yellen steer the conversations since hints on ECB monetary policy drives Euro bulls. ECB July meeting minutes revealed that members are worried about the risk of exchange rate overshoot.
Upside surprise in NZ trade balance fails to boost NZD
New Zealand's trade balance surprised to the upside in July as it rose to NZ$85m, while economists expected a deficit of NZ$200. This is the first time since 2012 that the country reports a trade surplus for the month of July. The good news came on the back of an unexpected increase in dairy exports, which jumped 51% to NZ$1.27bn. Overall, exports rose 17%y/y or NZ$668 million to reach NZ$4.63 billion. Imports were up NZ$232 (+5.4%y/y) amid sharp increase in vehicles, part and accessories imports (+15%y/y).
The unexpected surged in exports is particularly surprising as the Kiwie has been appreciating substantially since the beginning and reached 0.7558 at the end of July, its highest level against the greenback since May 2015.
In the FX market, the lack of reaction by traders showed that the rally that send NZD/USD to 0.72 wasn't driven by local economic developments but rather by the investors' appetite for higher yields. Indeed, both the Kiwi and the Aussie were in high during the summer month as the Federal Reserve prolonged the suspense about the future of its monetary policy.
Over the last three weeks, NZD/USD has broken several supports and is currently testing the key 0.7188 level (Fibonacci 50% on May-July rally). If broken the following one stands at 0.71 (Fibo 61.8% and psychological level), while on the upside a resistance lies at around 0.7330 (50-day MA). We remain bearish Kiwie - and Aussie- as we expect investors will slowly start to reload long USD position ahead of September FOMC meeting.
Euro Inches Up After Encouraging PMIs
The euro gained further yesterday, particularly versus sterling, following the release of Eurozone’s preliminary manufacturing and services PMIs for August. Even though the bloc’s services index slipped somewhat, the manufacturing print rose notably, which was enough to push the composite index higher. Despite the slowdown in services, if seen in combination, these prints signal that the bloc’s economy continues to recover at a solid pace, and they are consistent with our view that the ECB is set to announce QE changes soon.
As for Draghi, he did not reveal anything new on policy yesterday. Market focus remains on his Jackson Hole speech tomorrow. The euro could consolidate somewhat until then, given that there are no Eurozone data on the economic calendar, and that traders may be hesitant to assume new positions ahead of such a risk event. If anything, we believe there may be some hedging or liquidation of prior long-EUR positions ahead of his remarks, in case market participants are concerned that he may appear more worried than previously with regards to the latest strength of the euro.
Today’s highlights:
In the UK, the 2nd estimate of GDP for Q2 is expected to confirm the preliminary reading. If we were to see any revision, we think that it could be higher, as the only major indicator for Q2 released after the 1st GDP estimate was industrial production for June, which was stronger than expected. An upside revision could support GBP, but given the continued sell-off in the currency recently, any positive reaction may remain short-lived.
If the GDP print remains unchanged as expected, market focus may turn to the other key aspect of this data set; business investment. Back in June, BoE Governor Carney noted that a BoE rate hike may depend mainly on whether weaker consumption growth is offset by stronger business investment, and on whether wages begin to firm. Given that wages have shown little-to-no signs of firming in recent months, a pickup in business investment may be needed to keep alive some speculation for a near-term BoE hike. At the time of writing, the probability for a hike by year-end rests at 25%, according to the UK
Overnight Index Swaps.
EUR/GBP traded higher yesterday after it hit support near the 0.9150 (S1) level and at the time of writing, it is testing the resistance barrier of 0.9235 (R1). The rate continues to print higher peaks and higher troughs above the short-term uptrend line taken from the low of the 17th of July and as such, we consider the near-term outlook to be positive. A clear break above 0.9235 (R1) could set the stage for more bullish extensions, perhaps towards our next resistance level of 0.9300 (R2). Nevertheless, given that we see upside risks to the UK GDP data coming out today, we are mindful of a corrective setback before the bulls decide to take the reins again. Our short-term oscillators support the case for a pullback as well. The RSI shows signs of topping above its 70 territory, while the MACD, although above both its zero and trigger lines, has started topping as well.
Zooming out to longer-term timeframes, we see that the overall path of the pair is positive as well. The rate continues to trade above the long-term uptrend line taken from the lows of November 2015, something that increases the likelihood for EUR/GBP to continue trading higher in the foreseeable future.
In Norway, GDP data for Q2 have already been released and showed that the nation’s growth rate rose from the previous quarter, beating the forecast for remaining unchanged. This print is better than what the Norges Bank anticipated in its latest economic forecasts and thus, enhances the case for the Bank to continue shifting to a more hawkish stance at its upcoming meetings, in sync with the ECB.
USD/NOK dipped briefly below the support (now turned into resistance) of 7.8500 (R1) after the upside surprise in Norway’s GDP for Q2. The 7.8500 (R1) barrier acted as the lower bound of the sideways range that had been containing the price action since the 25th of July and as such, we think that the near-term bias may have just turned from neutral to negative. If the 7.7800 (S1).
As for the bigger picture, the break below the psychological zone of 8.000 (R3) on the 25th of July may have signaled a trend reversal on the weekly chart, which supports our view for further declines, at least in the weeks to come.
In the US, the annual Jackson Hole economic symposium will commence (24th - 26th). Even though the program with all of the speakers will only be released later today, both ECB President Mario Draghi and Fed Chair Janet Yellen have already been confirmed to speak on Friday. As for the US data, initial jobless claims for the week ended August the 18th and existing home sales for July are due out as well.
EUR/GBP
Support: 0.9150 (S1), 0.9070 (S2), 0.9000 (S3)
Resistance: 0.9235 (R1), 0.9300 (R2), 0.9415 (R3)
USD/NOK
Support: 7.7800 (S1), 7.6800 (S2), 7.6000 (S3)
Resistance: 7.8500 (R1), 7.9215 (R2), 8.0000 (R3)
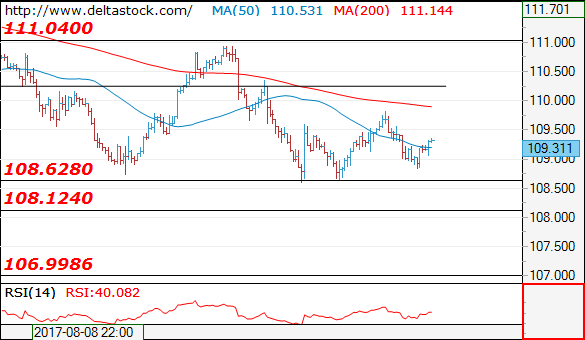
Technical Outlook: USDJPY – Daily Tenkan-Sen To Ideally Cap Extended Consolidation Above Weekly Cloud Base
The pair bounced above 109.00 handle in early Thursday's trading and recovered over 50% of previous day's losses on extension to 109.40 so far.
Near-term action is entrenched within 108.60/109.82 range in past few days, which is seen as consolidation of larger downtrend and strong support provided by weekly cloud base (108.83) as bears were unable to break support clearly.
The upper boundary of congestion is reinforced by daily Tenkan-sen (109.77) which should keep upticks limited before bears resume towards next key support at 108.11 (14 Apr low).
Recent attempts through supports at 108.83/80 (50% of larger 101.39/118.66 rally / 14 June low) so far failed to close below here and generate stronger signal for bearish resumption, signaling the pair may stay in extended consolidation before continuing lower.
Firm bearish setup of daily studies is supporting the notion.
Only sustained break above daily Tenkan-sen (109.77) and falling 20SMA (109.90) would bears on hold for stronger corrective action.
Res: 109.50, 109.77, 109.90, 110.52
Sup: 109.00, 108.84, 108.60, 108.11
NZDUSD Sees Increased Downside Pressure As Prices Test Key 0.72 Lvel
NZDUSD has shifted risk back to downside after a rebound lost steam and fell from 0.7235 to dip below the key 0.7200 level. The crossover of the shorter-period with the longer-period moving average gave a bearish signal. Yesterday the 20 SMA fell below the 50 SMA on the 4-hour chart. Meanwhile, RSI is in bearish territory below 50.
A daily close below 0.7200 would increase downside pressure and strengthen the bearish case. The market has been trading above this key level since June. An extension lower from this area would open the way towards a resistance-turned-support level at 0.7057. Breaking below the key psychological 0.7000 level would target the multi-month trough at 0.6817 (May 11 low).
Prices need to rise back above the 0.7235 high to shift the focus back to the upside towards the key 0.7300 level. Only a move above 0.7375 would retrace 50% of the downtrend from the 0.7557 peak (July 27) and indicate that near-term downward pressure has eased. A sustained break above resistance at 0.7458 could see a re-test of 0.7557 and change the short-term trend to bullish.
Forex Technical Analysis: EUR/USD, USD/JPY, GBP/USD
EUR/USD
Current level - 1.1791
Yesterday's low at 1.1740 is already a crucial one and a break through it will signal a renewal of the downtrend, towards 1.1580. Initial intraday resistance lies at 1.1830.
| Resistance | Support | ||
| intraday | intraweek | intraday | intraweek |
| 1.1830 | 1.1909 | 1.1740 | 1.1580 |
| 1.1850 | 1.2000 | 1.1580 | 1.1480 |
USD/JPY
Current level - 109.31
The overall outlook here remains bearish, for a break through 108.60, towards 108.10, en route to 107.00 area. Initial intraday hurdle lies at 109.80.
| Resistance | Support | ||
| intraday | intraweek | intraday | intraweek |
| 109.80 | 111.00 | 108.60 | 108.10 |
| 110.30 | 112.20 | 108.10 | 107.00 |
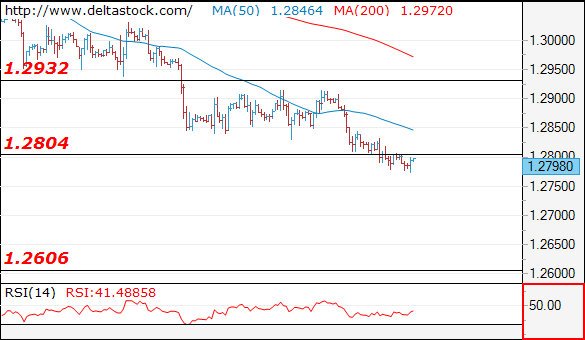
GBP/USD
Current level - 1.2798
The downtrend is intact, heading towards 1.2705, en route to 1.2600 area. Minor intraday resistance is projected at 1.2850 and crucial on the upside is 1.2915 high.
| Resistance | Support | ||
| intraday | intraweek | intraday | intraweek |
| 1.2850 | 1.3260 | 1.2705 | 1.2606 |
| 1.2930 | 1.3500 | 1.2606 | 1.2480 |
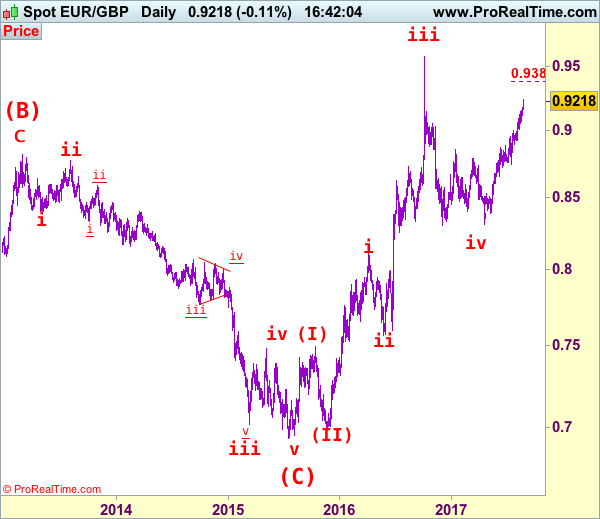
EUR/GBP Elliott Wave Analysis
EUR/GBP – 0.9216
As the single currency has continued heading north, adding credence to our view that early retreat from 0.9576 (wave iii top) has ended earlier at 0.8304 and bullishness remains for the rise from there to extend further gain to 0.9290-00, then towards 0.9350, however, near term overbought condition should prevent sharp move beyond 0.9380-85 (100% projection of 0.8312-0.8950 measuring from 0.8743) and reckon 0.9400-10 would hold from here, risk from there is seen for a retreat due to near term overbought condition.
Our latest preferred count is that the wave V of a 5-wave series from 0.5682 ended at 0.9805 earlier and major from there has possibly ended at 0.8067 as A-B-C-X-A-B-C. We are keeping our view that the entire correction from 0.9805 has possibly ended at 0.7756 and as labeled as the attached daily chart and impulsive move from 0.9084 has ended at 0.6938 as a 5-waver which marked as the (C) wave, recent impulsive rise is labeled as (I) (II), (i) (ii) series, indicated upside target at 0.9084 had been met, the retreat from 0.9576 suggest wave iii ended there and next upside target for wave v of (III) should head towards 0.9700 but price should falter well below parity .
On the downside, whilst initial pullback to 0.9150, then 0.9105-10 cannot be rule out, reckon downside would be limited to 0.9060-65 and bring another rise later. A daily close below support at 0.9008 would defer and suggest a temporary top is possibly formed, risk correction to 0.8945-50, then 0.8920-25 but reckon downside would be limited to 0.8890-95 and bring another upmove later.
Recommendation: Buy at 0.9065 for 0.9265 with stop below 0.8965
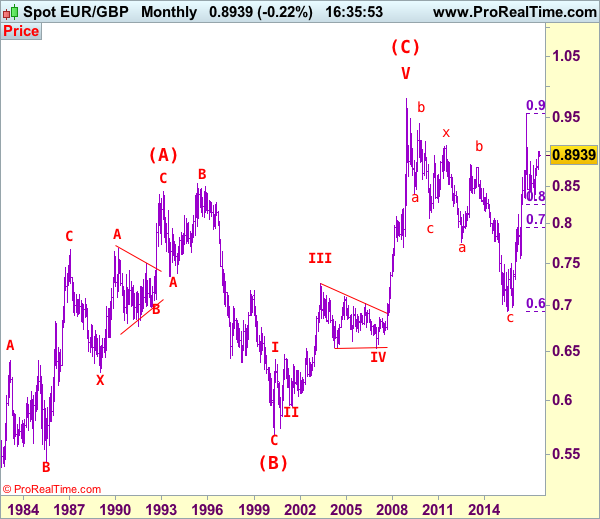
Euro's long term uptrend started in Feb 1981 at 0.5039 and is unfolding as a (A)-(B)-(C) move with (A): 0.8433 (Feb 1993), (B): 0.5682 (May 2000) and impulsive wave (C) should have ended at 0.9805 with wave III ended at 0.7254 (May 2003), triangle wave IV at 0.6536 (23 Jan 2007) and wave V as well as wave (C) has ended at 0.9805.
We are keeping an alternate count that only wave III ended at 0.9805 and the correction from there is the wave IV and has possibly ended at 0.6936, however, it is necessary to see a daily close above resistance at 0.9576 in order to change this to be the preferred count.
Investors Shaking Off Trump Concerns And Focused On Jackson Hole | Oil And Euro Lower
Markets move forward and it shows no concerns about Trump
US Government shutdown anxiety would resurface
Oil facing selling pressure due to inventory data
Euro lower against the dollar but up against Sterling
European markets have shaken off the anxieties of the US dysfunction and the focus has turned towards the Jackson Hole meeting. However, the days of Trump enacting his fiscal agenda are still looking darker. August is almost over and September could be the month of heightened volatility given the issues on hand.
Investors would remain highly sensitive to any new headlines around the US government shut down due to the debt ceiling hitting its boundary. This time the danger is real because the commander in chief is a completely unpredictable person and he has a capability to do anything. Traders are not responding positively to the US President's threats of shutting down the government.
He is using one of his tricks to get what he wants and does not seem to care about what could be the consequence of the US shutdown for the economy. The influence of such an event expands well beyond the US borders because it delivers the message that the country is not united. The investment community would respond even more adversely to that message. One can also say that such an event would leave its scar on the US debt ratings.
What matters the most for Mr Trump is to build the wall which he promised throughout his campaign. He seems to be determined on that in order to win more support of Americans and doesn't care about the message it delivers for the broader investment community.
Trump and his tweets would remain the focal point amid investors and a more adverse development could lead to a further collapse in the investor sentiment. He inserted another dose of uncertainty yesterday by menacing to pull out of NAFTA. Countries such as Canada and Mexico are leaving no stone unturned to make the agreement work. Basically, President Trump has up the ante on the tumultuous month which is full with tensions ranging from the geopolitics to shutting down the government.
The yellow metal is still struggling to move closer to the 1300 mark due to the dollar strength. An essential bullish signal would be if the price breaks the 1300 mark otherwise you can say that the uptrend has no energy. Janet Yellen could surprise the market with a less dovish approach however stagnant inflation should keep her in check. The reality is that you cannot fight the Fed or predict their action accurately every single time. The US new home sales data was underwhelming and this is the direct result of the higher interest rates. The focus will be on the existing new home sales and if we get the same message here, it would push the dollar lower and therefore the gold price could be vulnerable.
The oil price is still suffering from the crude inventory data print. Despite the fact that the headline number did show an inventory drawdown, investors are paying more attention to the fact that the drawdown was less deep as compared to the previous number and this is creating the selling pressure for the oil price.
The Euro didn't get much help from Mario Draghi's speech yesterday as it was carefully and colourlessly designed. Traders are hoping that they may get some juicy sauce during his speech. This could help them to see the internal frame work of the ECB's strategy as the bank is planning on to reduce its support for the market by curtailing its monthly purchase program.
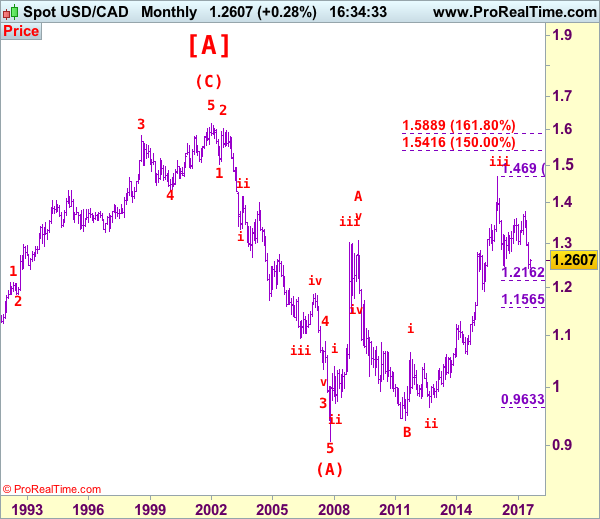
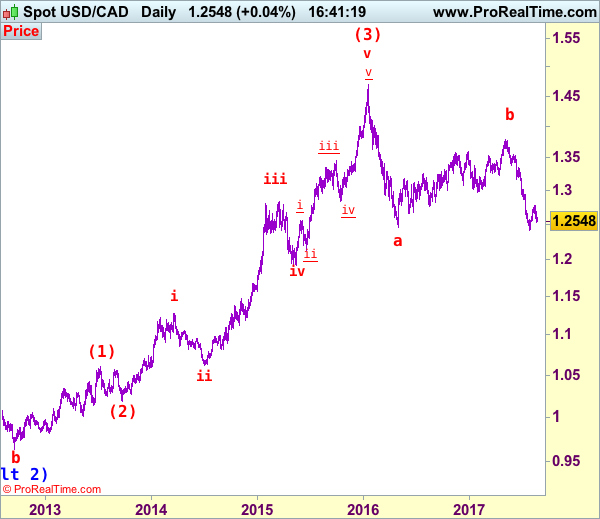
USD/CAD Elliott Wave Analysis
USD/CAD – 1.2548
As the retreat from 1.2778 has kept price under pressure, suggesting the rebound from 1.2414 has possibly ended there and consolidation with downside bias is seen for weakness to 1.2490-00, then test of 1.2451, break of latter level would signal recent decline has resumed for retest of 1.2414. Having said that, break there is needed to confirm recent wave c decline is under way for weakness to 1.2350, then 1.2300 but loss of momentum should prevent sharp fall below 1.2200-10 and price should stay well above 1.2000 level, bring rebound later. We are keeping our bearish count that wave b ended at 1.3794 and wave c has commenced for further fall to aforesaid downside targets.
We are keeping our view that the wave b from 1.0657 (a leg top) has possibly ended at 0.9633 with (a): 0.9800, wave (b): 1.0447 and wave c at 0.9633, the subsequent rise from there is now treated as wave c exceeded indicated upside target at 1.3770-80 and 1.4000 and wave (3) has possibly ended at 1.4690 and wave (4) correction has commenced for retracement back to 1.2410-20, then towards 1.2200.
On the daily chart, our latest preferred count remains that the A of (B) rally from 0.9059 low (7 Nov 2007) unfolded into an impulsive wave with i: 0.9059-1.0380, ii ended at 0.9819, iii at 1.3019 followed by triangle wave iv at 1.2026 , then wave v formed a top at 1.3066 and also ended the wave A. The wave B is unfolding as an double three a-b-c-x-a-b-c and is sub-divided as a: 1.2192, b: 1.2716 and wave c at 1.0784, followed by wave x at 1.1725, another set of a-b-c unfolded with 2nd a at 0.9931, 2nd b at 1.0674. the 2nd c has possibly ended at 0.9407, therefore, consolidation with upside bias is seen for major correction, indicated target at 1.3900 had been met and gain to 1.4700 would follow.
On the upside, whilst initial recovery to 1.2590-00 cannot be ruled out, reckon upside would be limited to 1.2650–60 and renewed selling interest should emerge there, bring another decline to aforesaid downside targets. Above resistance at 1.2691 would signal the retreat from 1.2778 has ended instead, bring another corrective bounce to this level and later towards previous support at 1.2859 but upside should be limited to resistance at 1.2944 and upside should falter well below psychological resistance at 1.3000, bring another decline later.
Recommendation: Sell at 1.2650 for 1.2450 with stop above 1.2750.
Longer term - The selloff from 1.6194 (21 Jan 2002) to 0.9059 (07 Nov 2007) is viewed as (A) wave which is a 5-waver as labeled on the monthly chart as below, the subsequently rally is labeled as (B) with impulsive A leg of (B) ended at 1.3066, wave B of (B) is unfolding which has either ended at 0.9407 or would extend one more fall but downside should be limited to 0.9200 and 0.9000 should hold.