Sample Category Title
Technical Outlook: GBPUSD Remains Under Strong Pressure Ahead Of UK Data
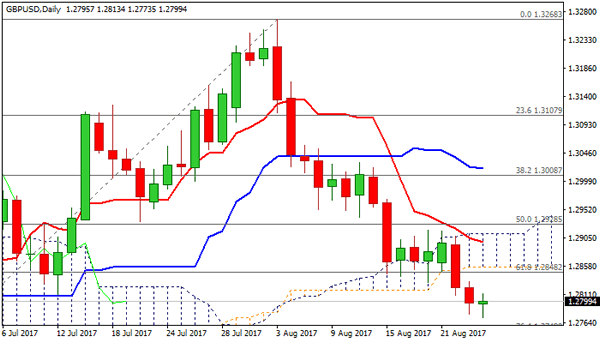
Cable hit new low at 1.2773 on Thursday, in extension of strong fall in past two days that eventually broke below daily cloud and took out another strong support at 1.2811 (12 July trough), generating strong bearish signal for continuation of the downtrend from 1.3268 (03 Aug peak). Bearish studies maintain negative near-term outlook for extension towards next target at 1.2749 (Fibo 76.4% of 1.2588/1.3268), with 200SMA (1.2649) expected to come in focus on stronger bearish acceleration. Formation of 10/100SMA bear-cross (1.2883) adds on existing bearish pressure, with broken daily cloud base now acting as strong resistance (spanned between1.2857/1.2912). Broken cloud base offers initial resistance at 1.2857, followed by 10/100SMA bear-cross (1.2883) and falling Tenkan-sen at 1.2897. Only acceleration above daily cloud would sideline bearish pressure and signal correction. UK data are in focus today, with Q2 GDP expected to come in line with previous releases (0.3% q/q, 1.7% y/y), while business investments are expected at 0.4% vs 0.6% in Q1. Weaker releases could further hurt already weak pound, while stronger than expected releases would inflate sterling.
Res: 1.2813, 1.2833, 1.2857, 1.2883
Sup: 1.2773, 1.2749, 1.2715, 1.2649
Technical Outlook: EURUSD Holds Above Bullish Flag But Still Within The Range
The Euro edged lower in Asia / early Europe after Wednesday's rally probed above 1.1800 again but was capped under Monday's high at 1.1828. The price holds within 1.1.1731/1.1828 range for the fourth straight day, with the action being supported by daily Tenkan-sen (1.1750) and daily studies in bullish setup supportive for further advance through 1.1828/46 pivots. The price is holding above the upper boundary of bullish flag that was formed on daily chart and generated signal for bullish continuation. Broken flag's upper resistance line now turned to solid support at 1.1770, followed by daily Tenkan-sen at 1.1750. Corrective easing should be ideally contained above these supports to keep near-term bulls in play. Increased downside risk could be expected on violation of Tenkan-sen support which would expose lower pivots at 1.1724/1.1694 (rising 30SMA / daily Kijun-sen. Jackson Hole meeting starts today with markets awaiting the speech ECB President Draghi, looking for firmer signals of tightening of the ECB's policy and QE tapering. However, sources close to Mario Draghi said that he may not talk about these subjects in Jackson Hole symposium but focus on the theme of the meeting regarding global economy.
Res: 1.1823, 1.1828, 1.1846, 1.1889
Sup: 1.1770, 1.1740, 1.1724, 1.1708

Trade Idea: GBP/USD – Sell at 1.2910
GBP/USD – 1.2787
Original strategy :
Sell at 1.2910, Target: 1.2710, Stop: 1.2970
Position: -
Target: -
Stop: -
New strategy :
Sell at 1.2910, Target: 1.2710, Stop: 1.2970
Position: -
Target: -
Stop:-
Although cable has remained under pressure and weakness to 1.2750-60 cannot be ruled out, loss of downward momentum should prevent sharp fall below 1.2730-35 and previous support at 1.2706 should remain intact, bring rebound later, above 1.2840-45 would bring recovery to 1.2875-80, however, resistance at 1.2917-18 should limit upside and bring another selloff later.
In view of this, would not chase this fall here and would be prudent to sell cable on recovery as said resistance at 1.2917-18 should limit upside, bring another decline. Above 1.2970-80 would defer and risk a stronger rebound to 1.3000 and possibly test of resistance at 1.3032, however, only break of latter level would abort and signal the fall from 1.3269 has ended instead, bring a stronger rebound to 1.3059 and possibly towards 1.3100 but previous support at 1.3112 (now resistance) should remain intact.
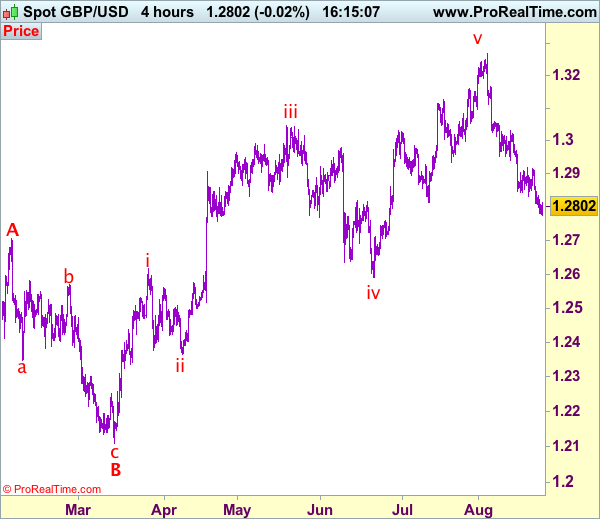
Our preferred count on the daily chart is that cable's rebound from 1.3500 (wave (A) trough) is unfolding as a wave (B) with A ended at 1.7043, followed by triangle wave B and wave C as well as wave (B) has ended at 1.7192, the subsequent selloff is the larger degree wave (C) which is still unfolding with minor wave (III) of larger degree wave 3 ended at 1.1986, hence wave (IV) correction is in progress which could either be a triangle wave (IV) of a complex formation but upside should be limited to 1.3500 and price should falter well below 1.4000, bring another decline in wave (V) of 3 for weakness to 1.1500, then 1.1200.
EUR/USD Analysis: Surges As Draghi Speaks
As it was expected, previous trading session the currency exchange rate spent in an upward movement that was inspired to some extent by a combination of the weekly PP together with the 100- and 200-hour SMAs, but mostly by a speech delivered by Mario Draghi in the early morning. The only unexpected thing was that the pair managed to cross the upper boundary of a senior descending channel.
On the other hand, this overstepping had a short-term effect, which means that the pair might return back into formation. However, an aggregate of technical indicators for the 5H and 1D timeframes suggests that the rate is going to continue the surge. In the meantime, market sentiment stays 70% bearish.
Trade Idea: GBP/JPY – Sell at 141.40
GBP/JPY - 139.90
Original strategy:
Sell at 141.40, Target: 139.40, Stop: 142.00
Position: -
Target: -
Stop: -
New strategy :
Sell at 141.40, Target: 139.40, Stop: 142.00
Position: -
Target: -
Stop:-
Although the British pound has remained under pressure after resuming recent decline, loss of downward momentum should prevent sharp fall below 139.00 and reckon previous support at 138.70 would hold on first testing, risk from there has increased for a corrective rebound to take place soon.
In view of this, would not chase this fall here and we are looking to sell sterling on subsequent recovery as 141.40-50 should limit upside and bring such a decline. Only a break of resistance at 142.05 would suggest low is possibly formed instead, bring a stronger rebound to 142.50-60 but resistance at 143.20 should remain intact and bring another decline later.
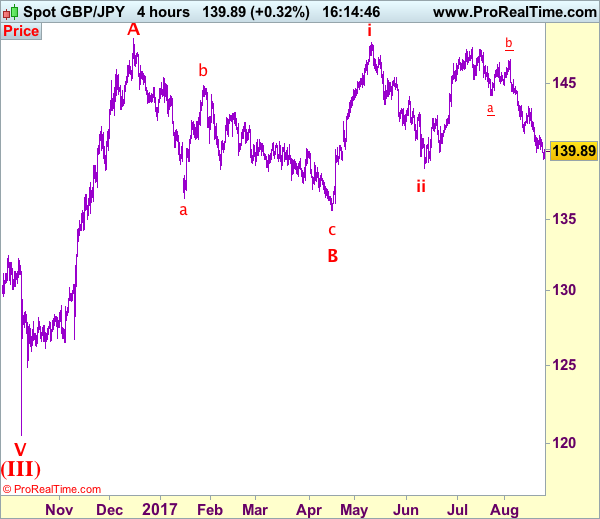
Our preferred count is that larger degree wave V with circle is unfolding from 251.12 with wave (I) 219.34, (II): 241.38 and wave (III) is subdivided into 1: 192.60, 2: 215.89 (23 Jul 2008) and wave 3 ended at 118.87 earlier in 2009. The correction from there to 162.60 is wave 4 which itself is a double three and is labeled as first a-b-c ended at 151.53, followed by wave x at 139.03, 2nd a ended at 162.60, 2nd b at 146.75 and 2nd c leg of wave 4 ended at 163.00. Therefore, the decline from 163.00 to 116.85 is now treated as wave 5 which also marked the end of larger degree wave (III), hence wave (IV) major correction has commenced for retracement of the wave (III) from 241.38 and upside target at 183.95-00 (50% Fibonacci retracement of the wave (II) from 241.38) had been met, a drop below 160.00 would suggest wave (IV) has ended at 195.85, bring decline in wave (V) for initial weakness to 130 (already met) and 120.
GBP/USD Analysis: Expectedly Passes 1.2799
As forecasted on Wednesday, the British Pound continued to lose value against the American Dollar and slipped right through the weekly S1, which is located at the 1.2199 level. Such outcome additionally confirms that the pair is moving in a clearly expressed downtrend.
As a result, the exchange rate has no technical indicators on its way that might force it to start moving in the opposite direction. For instance, the closest support level, which is set up by the weekly S2, is located only at the 1.2720 level. On the other hand, at 8:30 GMT there will be a release a Second Estimate GDP that might cause certain volatility and lead to a short-term recovery of the Sterling.
USD/JPY Analysis: Returns Back To 108.82
Unfortunately for the buck, the assumption about an existence of a short-term ascending channel did not confirm, as the currency rate once again slipped to the monthly S1. A quite sharp fall indicated that the pair had a chance bypass this support level, but in the early Thursday morning the Greenback started to actively recover ahead of the Jackson Hole symposium. An aggregate of technical indicators suggests the pair will continue to move downwards despite the two failed attempts to slide below the 108.82 level. That might be true, especially taking into account that the pair is simultaneously moving a senior descending channel. On the other hand, there will be also a release of the US housing data that might accelerate the fall, or help the buck to continue to recover further.
XAU/USD Analysis: Heads Towards 1,292.91
The way the bullion moved yesterday confirmed that a theory that a support area formed by a combination of the 200-hour SMA and the weekly PP near 1,284.70 was a stronger barrier than the 55- and 100-hour SMAs.
As a result, the pair broke to the top and has practically reached the monthly R1 at 1,292.91. Most probably, today the yellow metal is going to repeat this attempt. Such assumption is supported by an aggregate of technical indicators, which sends a strong buy signal. However, even if the gold will lose some value while waiting for beginning of the Jackson Hole Symposium, the drop is unlikely to go below the above combined support level.
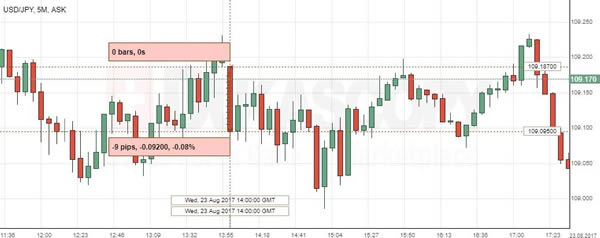
USD/JPY: New Home Sales
The report showing an unexpected drop in the US new home sales in July boosted an initial fall in the USD/JPY. The Yen strengthened against the US dollar by 0.08% to reach the 109.39 mark, albeit the pair returned to testing pre-data levels in the Thursday’s morning session.
The Commerce Department revealed that new home sales in the US fell 9.4% to a seasonally adjusted amount of 571K units in July, which was the strongest decline since December 2016. Weak figures raised concerns over the future recovery and healthy growth of the country’s property market. Data would be closely watched to evaluate whether enhanced supply conditions would help reinforce sales conditions in the next couple of months.
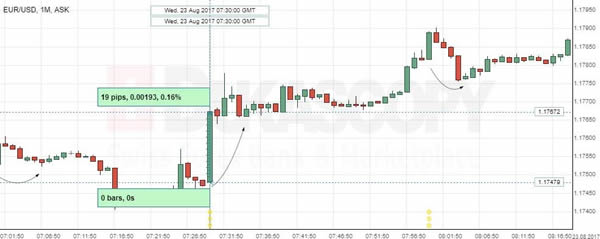
EUR/USD: German Flash Manufacturing PMI
The EUR/USD currency pair started a robust increase after the August PMI reports for Germany and the Euro zone came in. The Markit report were published simultaneously with the ECB President’s Mario Draghi speech, which together with better-than-expected Germany’s data caused a 19 base points gain in the European single currency against the Greenback, while the following report for the EZ confirmed the upmove above the 1.1762 mark.
Markit showed that the German Flash Services PMI matched estimates with a 53.4 rate, while the Manufacturing Index rose to 59.4, despite expectations for a decline in August. Data are set to diminish concerns about the stronger Euro capable of affecting manufacturing growth.