
Sample Category Title
Currencies: Dollar Resists Trump’s Comments Rather Well
Sunrise Market Commentary
- Rates: More neutral positioning into Jackson Hole speeches?
Core bond markets are rather dovish positioned. More subdued inflation readings questioned central banks' urge to complete a near term tightening push. Expectations of pre-announced policy changes by Draghi and/or Yellen tomorrow are (too) low. Therefore, some investors might be willing to take some chips off the table, resulting in more neutral positioning. - Currencies: Dollar resists Trump's comments rather well
Yesterday, USD soon found a bottom after a series of unconventional comments from US president Trump. Today, more wait-and-see trading can be expected going into the Jackson Hole symposium. Draghi needs to convince investors that the ECB will go very slowly to trigger a meaningful correction of EUR/USD. EUR/GBP extends its impressive ascent.
The Sunrise Headlines
- US equities managed to limit losses to 0.4% yesterday, despite US President Trump's latest controversial comments on NAFTA and a government shutdown. Asian stock markets are mixed with China and Japan underperforming.
- ECB policy maker Hansson said he isn't currently concerned about the strength of the euro as officials prepare to discuss how to wind down their bondpurchase program.
- The ECB should quickly end asset buys next year as the outlook does not warrant the extension of its €2.3 trillion scheme, Bundesbank President Weidmann said, weighing in on the biggest issue facing the ECB this autumn.
- Fitch Ratings said that it could put the US's top-notch 'AAA' sovereign rating on review for a possible downgrade if lawmakers fail to raise the country's debt limit in a timely manner.
- Dallas Fed President Kaplan reiterated that he wants to be patient on raising interest rates, adding that he's not saying it should happen again this year. The central bank should start soon in paring its balance sheet, he said.
- The UK's financial sector is seeking an 'ambitious' trade pact between Britain and the EU to try to prevent a costly shift of jobs and business to the continent once the country leaves the bloc, according to a draft report seen by Reuters.
- Today's eco calendar contains the second reading of UK Q2 GDP, US weekly jobless claims and US existing home sales. The annual Jackson Hole Economic Symposium starts.
Currencies: Dollar Resists Trump's Comments Rather Well
Modest USD damage after Trump comments
A new wave of unconventional comments of US president Trump on NAFTA and on a government shutdown aborted Tuesday's USD rebound. Poor US housing data were also a slight additional USD negative. At the same time, the euro was supported by strong EMU PMI's. EUR/USD returned north of 1.18 and closed the session at 1.1807. USD/JPY drifted to the 109 barrier, but the pace of the decline slowed during US session as the damage from the Trump comments on equities remained modest.
Overnight, Asian equities mostly show modest gains with Japan and China underperforming. Volumes remain thin as investors look forward to the Jackson Hole symposium. ECB's Hansen, a hawk, isn't overly worried about recent euro strength. At the same time, he left plenty of options open on the degree of monetary policy stimulation. At least for now, his comments don't cause any further euro gains. EUR/USD stabilizes in the 1.18 area. USD/JPY holds in the low 109 area. So, for now, the 108.60 ST correction low 'survived' the unconventional trump comments.
The EMU calendar contains only second tier national data which are unlikely to affect EUR/USD trading in a profound way. Also the US initial claims, Existing Home sales and the Kansas Fed manufacturing survey will at best only have intraday significance as traders are focused on Jackson Hole. The meeting starts today, but key speeches of Yellen and Draghi are only scheduled for tomorrow . Regarding the Fed: the timing of the start of the tapering but also the Fed's views on the missing link between buoyant employment, wages and ultimately inflation are important. Regarding the ECB, the outlook for the tapering of the APP programme matters most. Inflation, the ECB target, and the strength of the euro are crucial variables. Today, we expect more wait-and-see trading in EUR/USD. The market needs a 'reassurance' from Draghi that the ECB will move extremely slowly to trigger a meaningful correction of the EUR/USD. The modest reaction of USD/JPY (and of equities) on Tuesday's Trump comments suggest that the decline of USD/JPY is taking a pause, awaiting more clear guidance from central bankers and the Trump administration
Broader context and technical picture. Late June, EUR/USD started a new upleg as investors anticipated a reduction of ECB bond buying to be announced in autumn. The Fed was expected to remove policy stimulation only in a very gradual way as US inflation remains soft. Uncertainty on the policy of the Trump administration was an secondary negative factor for the dollar. EUR/USD set a new correction top north of 1.19 before consolidating in a narrow 1.1662/1.1910 range. We expect this range to hold going into the Jackson Hole symposium. If US data remain ok (as most were this month) and if Draghi gives little information on next ECB steps, there might be room for a modest USD comeback. A return of EUR/USD to the 1.15/16 area is possible. Pockets of US political risk are a (negative) wildcard for the dollar. A downward correction in core (US and European) yields supported the yen in August. USD/JPY declined from mid 114 mid-July to 108.60. The April correction low (108.13) remains the line in the sand. For now, this level won't be easy to break as quite some USD bad news is discounted after the recent protracted setback. A cautious buy-on-dips approach (with stop-loss protection below 108) may be considered.
EUR/US: awaiting clearer CB guidance
EUR/GBP
EUR/GBP: another day, another new ST top
Yesterday, sterling selling persisted. There were plenty of press articles on the role of the ECJ (Court of Justice) and on how the UK and the EMU will handle juridical disputes post-Brexit. Some comments considered the British language that it will accept no 'DIRECT' jurisdiction of the court as an easing on earlier tough separation rhetoric, but it didn't help sterling. EUR/GBP jumped north of 0,92, admittedly in the first place due to strong EMU PMI's. Cable also dropped below 1.28. The lack of progress in the Brexit talk still makes selling sterling the way of least resistance. EUR/GBP closed the session at 0.9224. Cable finished the day at 1.2800.
Today, the details of the UK Q2 GDP and the CBI August retail data will be published. UK growth is expected to be confirmed at a soft 0.3% Q/Q and 1.7% Y/Y. The details (e.g. on private consumption) are interesting, but the report is a bit outdated to have a lasting impact on sterling. CBI retail sales data are expected to have eased in August. However, we expect a slight positive surprise, as UK activity data weren't too bad of late. Still, it won't be a sterling game-changer. The focus for trading remains the Brexit negotiations and to a lesser extent inflation. Sterling's decline can't however continue till eternity without a pause or a temporary correction on which we put our money.
From a technical point of view, EUR/GBP cleared the 0.8854/80 resistance (top end June), opening the way for further gains. The move was the result of euro strength (strong EMU data and expectations of the ECB QE reduction). At the same time, UK price data rare soft enough to keep the BoE side-lined as the Brexit negotiations continue. MT, we maintain a buy EUR/GBP on dips approach as we expect the combination of relative euro strength and sterling softness to persist. The 0.9415 'flash-crash spike' is the next target on the charts. However, we don't jump on the up-trend and wait for a correction, e.g. to the technical support in the 0.88/89 area
EUR/GBP: uptrend continues unabatedly. Is the sky the limit?
Trump’s Threats Unnerve Markets
Concerns have risen that the US housing market recovery is stalling, as the US Commerce Department data on US new home sales dropped 9.4% last month to the lowest level since December 2016. The drop confounded many market analysts, who were expecting a 0.3% gain. A separate report on Wednesday from the US Mortgage Bankers Association indicated mortgage applications also decreased. A lethargic housing market weighs on US GDP.
Markets got more rhetoric from President Trump on Wednesday, with him warning that he might terminate the NAFTA trade treaty with Mexico and Canada after 3-way talks failed to bridge deep differences. At a political rally in Phoenix, Arizona Trump stated; “Personally, I don't think we can make a deal. I think we'll probably end up terminating NAFTA at some point”. Such comments again raise concerns that his administration is unable to deliver on fiscal plans and caused USD to give back recent gains.
Latest government data showed that, whilst US crude stockpiles slid last week with a drawdown of -3.327 (expected -3.450M) production was steady. The latest EIA report marks the 8th straight week of crude oil inventory declines. Production remained flat on the week at 9.5 million bpd giving further, albeit temporary, cause for optimism.
Today starts the Jackson Hole Symposium. Speeches from Fed chair Janet Yellen and ECB President Mario Draghi are not expected until Friday, however, it is not uncommon for potentially policy-relevant remarks to be made by attendees on the sidelines of the event.
EURUSD improved 0.5% on Wednesday, reaching a high of 1.18195. Currently, EURUSD is trading around 1.1800.
USDJPY rose to 109.821 on Wednesday, before USD bears pushed the pair lower. Currently, USDJPY is trading around 109.15.
GBPUSD traded in a narrow range on Wednesday and is currently trading around 1.2785.
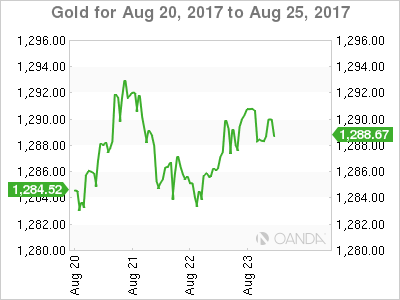
Gold appears to be stuck in a narrow trading range of less than $10, with it currently trading around $1,289.
WTI reacted favourably to the latest EIA report, seeing it gain >1.5% on Wednesday. Currently, WTI is trading around $48.40pb.
At 09:30 BST, National Statistics will release UK Gross Domestic Product YoY and QoQ for Q2. Market expectations are for both releases to be unchanged at 1.7% & 0.3% respectively. Any deviation from the consensus will have an impact on GBP.
At 13:30 BST, the US Department of Labor will release Initial Jobless Claims for the week ending August 18th. Consensus is calling for an increase to 238K from the previous 232K. At the same time, Continuing Jobless Claims for the week ending August 11th will be released. Consensus is calling for a slight reduction of 1.950M from the previous release of 1.953M. Whilst a reduction is expected the markets are unlikely to buy USD unless it is significantly lower than expected.
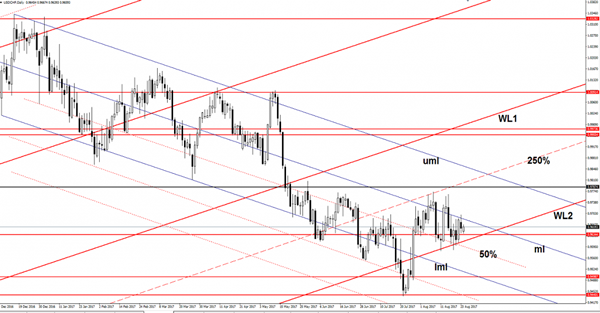
USD/CHF Needs A Bullish Spark
The USD/CHF is trading in the green and is setting up for the next move. Is narrowing and should give birth to a significant move very soon. Price is located above the 0.9634 static support and above the second warning line (WL2) of the major ascending pitchfork, but needs a bullish spark to be able to breakout above the median line (ml) of the minor descending pitchfork. A valid breakout will almost confirm the Inverse Head and Shoulders pattern.
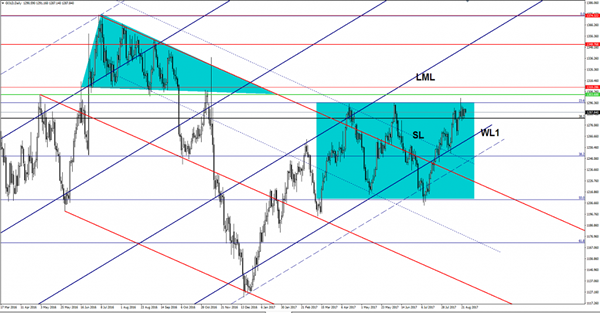
Gold Consolidating The Latest Gains
Price moves in range right above the 38.2% retracement level and tries to recapture more directional energy before will try to breakout from the extended sideways movement. You can see that we had a false breakout on Friday, that’s why the rate has come back to confirm the major static support (resistance turned into support).
Technically should climb towards new highs as long as is located above the mentioned support level, only a valid breakdown will open the door for a broader drop.
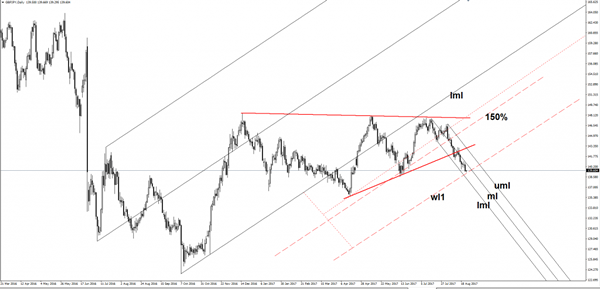
GBP/USD Throwback?
Price shown little movement in the early morning, but we may have a some action later, after the United Kingdom will release the high impact data. Price hovers right above a major dynamic support, we'll see how will react in the upcoming days, a breakdown is still favored as the Nikkei stock index is located in the seller's territory.
The JP225 posted little gains and tries to recover after the yesterday's drop. Continues to stay above the 19309 low. I've said in a former article that the index has signaled an oversold on the short term, remains to see if this will be an accumulation or a distribution movement.
The UK's Second Estimate GDP should bring life on the GBP/JPY, it is expected to increase by 0.3% in the Q2, matching the 0.3% growth in the first quarter. You should keep an eye on the economic calendar because more UK's data will be released.
Price is into a corrective phase and is almost to reach the next major downside target from the first warning line (WL1) of the major ascending pitchfork. A rebound will appear if the Nikkei will stay above the 19309 level. Could increase also because the GBP/JPY failed to reach the lower median line (lml) once again, signaling that is losing the bearish momentum.
However, I want to remind you that the pair remains under massive selling pressure on the short term after the breakdown from the chart pattern. Only a valid breakdown will confirm a further drop.
Trading Tentative Ahead Of Jackson Hole Central Bankers Meeting
Dollar Pressured By Trump Comments On Government Shutdown. The dollar slid down as investors began to take seriously threats of Trump's government shutdown over funding for a wall on the Mexican border. The dollar fell 0.55 percent to 108.96 yen, with the dollar index slipping 0.4 percent to 93.167.
Euro Gains On Positive Eurozone Data. The euro recouped some of its losses from the earlier trading session as traders kept their hopes up for tapering remarks in Draghi's Jackson Hole speech. The upbeat survey was the latest sign of economic recovery in the single currency bloc, which may lead the European Central Bank to start scaling back its stimulus program. The euro was propped up by strong German and French PMI survey readings (both countries registering strong private-sector growth in August), although analysts warned its gains could be short-lived due to concerns about heavy one-sided bets. The euro rose 0.5 percent to $1.1818.
New Zealand Posts First July Trade Surplus Since 2012. The New Zealand Dollar appreciated against its major counterparts after July's merchandise trade balance crossed the wires. New Zealand's monthly trade surplus came in at 85m as opposed to a forecasted deficit of 200m.
British Pound Is Subject To A Negative Bias At Present. Sterling fell below $1.28 for the first time since late June. Concerns about Britain's economic prospects and the Brexit process encouraged investors to push the pound lower.
Oil Steady On Falling Crude Inventories. Oil prices were little changed in early trade on Thursday, holding most of their gains from the previous session after another fall in U.S. crude inventories which is seen as a sign of a tighter market.
Gold Eases Ahead Of Central Bankers Meeting. Gold edged lower early Thursday, giving up some of its gains made after U.S. President Donald Trump's threat of a government shutdown, while investors began to focus on a major central bankers' conference in Jackson Hole.
Daily Technical Analysis: EUR/USD Retests Resistance Of Bull Flag Pattern At 1.1825
Currency pair EUR/USD
The EUR/USD is challenging the resistance trend line (red) of the bull flag chart pattern. At the moment it is unable to break and a correction back to the support trend lines is possible. The next breakout above resistance (red) of the contracting triangle pattern should see the continuation of wave 3 (blue).
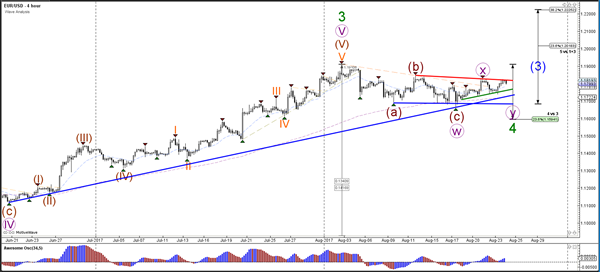
The EUR/USD has arrived at a break spot. A break below support (light green) could see price challenge the bigger support zones (green/blue) and perhaps even the 23.6% Fib of wave 4 vs 3, whereas a break above resistance could lead to an uptrend continuation. There is the possibility of an ABC (brown) correction before wave 4 (green) is ready but a break above the major resistance (red) would invalidate that and indicate a potential bullish breakout.
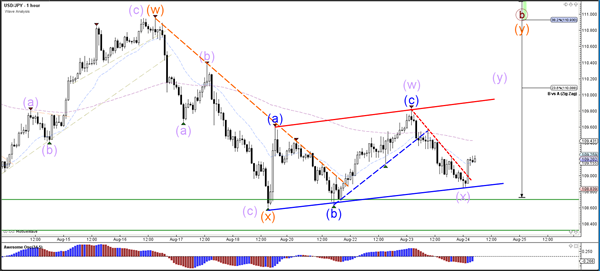
Currency pair USD/JPY
The USD/JPY is again retesting the support zone (green lines). A bounce could see price move higher towards the Fib levels of wave B vs A whereas a bearish break could indicate a downtrend continuation.
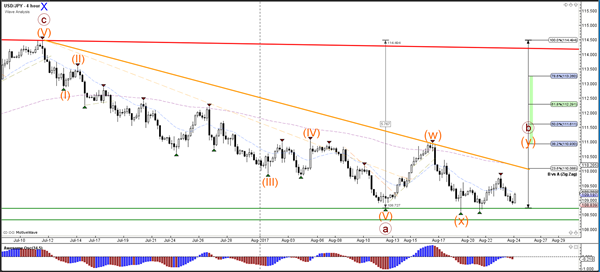
The USD/JPY is building a channel (red/blue lines) at the support zone (green).
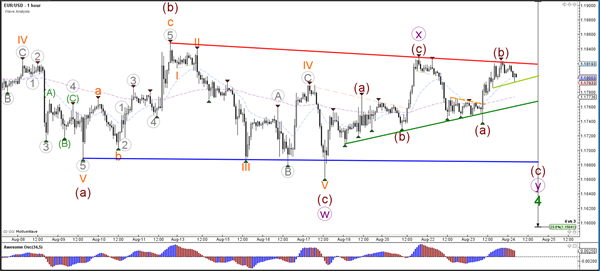
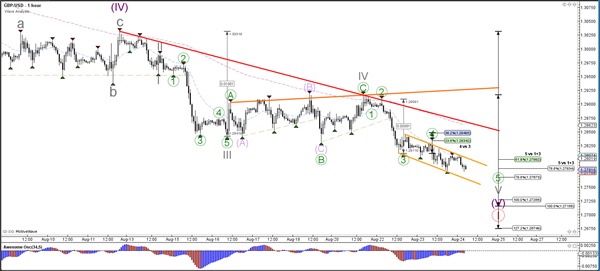
Currency pair GBP/USD
The GBP/USD is moving lower within the downtrend channel (red). The round quarter level of 1.2750 could act as a support zone.
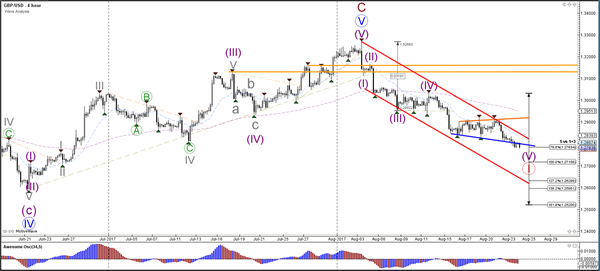
The GBP/USD indeed completed a wave 4 (green) correction and is moving lower in a smaller channel (orange lines).
Daily Technical Outlook And Review: EUR/USD, GBP/USD, AUD/USD
A note on lower timeframe confirming price action...
Waiting for lower timeframe confirmation is our main tool to confirm strength within higher timeframe zones, and has really been the key to our trading success. It takes a little time to understand the subtle nuances, however, as each trade is never the same, but once you master the rhythm so to speak, you will be saved from countless unnecessary losing trades. The following is a list of what we look for:
- A break/retest of supply or demand dependent on which way you're trading.
- A trendline break/retest.
- Buying/selling tails ... essentially we look for a cluster of very obvious spikes off of lower timeframe support and resistance levels within the higher timeframe zone.
- Candlestick patterns. We tend to only stick with pin bars and engulfing bars as these have proven to be the most effective.
We typically search for lower-timeframe confirmation between the M15 and H1 timeframes, since most of our higher-timeframe areas begin with the H4. Stops are usually placed 1-3 pips beyond confirming structures.
EUR/USD
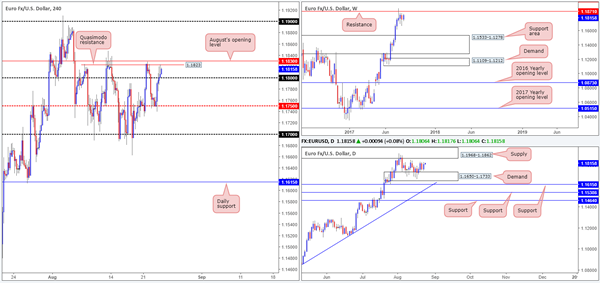
EUR buyers managed to find their feet early on in the day on Wednesday, bolstered by the H4 mid-level support at 1.1750. As a result of this, H4 price broke and eventually closed above the 1.18 handle. As you can see though, the unit failed to generate much follow through after this, due to a nearby Quasimodo resistance level at 1.1823 (shadowed closely by August’s opening level at 1.1830). However, considering that the USDX shows room for the H4 candles to push down as far as the trendline support extended from the low 11853, we may see the two noted H4 resistances give way sometime today.
The story over on the weekly chart shows that the buyers and sellers remain battling for position below a major resistance at 1.1871. A similar picture can be seen on the US dollar index (USDX), only inverse from a weekly support drawn in at 11854. Looking down to the daily timeframe, price is currently seen sandwiched between a supply zone coming in at 1.1968-1.1862 and a demand base lodged at 1.1650-1.1733.
Suggestions: A decisive close above 1.1830 on the H4 chart likely clears the footpath north up to the 1.19 band. While this may be true on the H4 timeframe, the bigger picture shows we have both the underside of the current daily supply at 1.1862 and the weekly resistance at 1.1871 to contend with before 1.19 can be achieved. This, for us, makes buying beyond 1.1830 just too much of a risk.
Data points to consider: US Jackson Hole symposium (all day), Unemployment claims at 1.30pm GMT+1.
Levels to watch/live orders:
- Buys: Flat (stop loss: N/A).
- Sells: Flat (stop loss: N/A).
GBP/USD
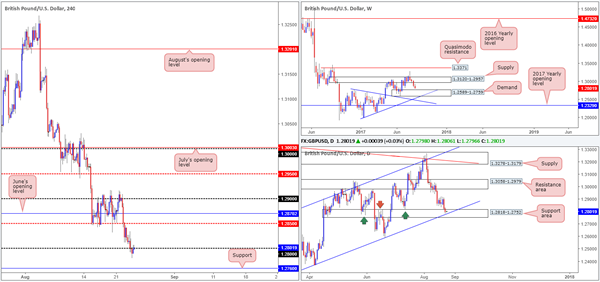
GBP/USD staged a modest selloff on Wednesday, forcing the H4 candles beyond the 1.28 handle. While there will be traders looking to sell this recent break, it might be worth noting what price actually broke into! Over on the daily timeframe, price entered into the walls of a support area drawn from 1.2818-1.2752, which intersects beautifully with a channel support line etched from the low 1.2365. Also notable is the nearby weekly demand seen at 1.2589-1.2759!
Suggestions: In view of the unit’s close proximity to the weekly demand, as well as price currently interacting with a daily support area, we’re reluctant to take on any medium/long-term shorts at this time. Ultimately, what we’re looking for is a decisive H4 close back above the 1.28 neighborhood. This, alongside a retest and a reasonably sized H4 bullish candle (preferably printed in the shape of a full, or near-full-bodied candle) would, in our opinion, be enough to validate a long trade. The first area of concern would be the H4 mid-level resistance at 1.2850, followed closely by June’s opening level at 1.2870.
Data points to consider: UK (second estimate) growth figures q/q at 9.30am. US Jackson Hole symposium (all day), Unemployment claims at 1.30pm GMT+1.
Levels to watch/live orders:
- Buys: Watch for H4 price to close above 1.28 and then look to trade any retest seen thereafter ([waiting for a reasonably sized H4 bullish candle to form following the retest is advised] stop loss: ideally beyond the candle’s tail).
- Sells: Flat (stop loss: N/A).
AUD/USD:
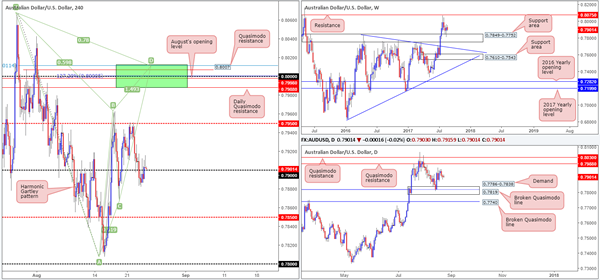
In recent trading, we saw the H4 candles inch back above the 0.79 handle after clocking a low of 0.7887. Should this number hold as support, the 0.7950 line is likely going to be the next target. Beyond this number, however, we have our eye on the 0.80 line. As highlighted in previous reports, apart from 0.80 being a watched round number, there are several nearby structures that deserve mention:
The daily Quasimodo resistance level at 0.7988.
A H4 Quasimodo resistance level at 0.8007.
A H4 127.2% Fib ext. point at 0.80 taken from the low 0.7807.
August’s opening level at 0.7998.
A H4 Harmonic Gartley reversal point at the 78.6% Fib resistance line drawn from 0.8011.
Suggestions: While the above structures on the H4 timeframe (green sell zone) boast attractive confluence, one must take into account that a fakeout may be seen up to the daily Quasimodo resistance level at 0.8030 sited just above the green zone. Traditionally, when trading Gartley patterns, the stop-loss order should go beyond the X point (0.8065). If you were to follow this, a fakeout up to the daily Quasimodo resistance is not a concern. It is more for the aggressive traders who will likely look to position stops just beyond the green zone. Should you be one of those traders, you may want to consider waiting for the H4 candles to prove seller intent (in the form of either a full, or near-full-bodied candle), before pressing the sell button. This will help avoid a fakeout should it occur.
At current price, nevertheless, we see little opportunity to trade. A long from 0.79 is, of course, an option, but given the recent H4 bearish selling wick printed just above this level, we’re reluctant to pull the trigger. Unless 0.80 comes into view today, we will likely remain on the sidelines.
Data points to consider: US Jackson Hole symposium (all day), Unemployment claims at 1.30pm GMT+1.
Levels to watch/live orders:
- Buys: Flat (stop loss: N/A).
- Sells: 0.8011/0.7988 (stop loss: either wait for a H4 bearish candle to form in the shape of a full, or near-full-bodied candle, and place stops above the candle’s wick. Another option is to enter at 0.80 and place stops above the H4 Harmonic X point at 0.8067).
Oil And Gold Consolidate Gains
Oil and Gold had relatively calm sessions overnight with both crude and gold quietly consolidating their recent gains ahead of Jackon Hole.
OIL
Oil prices rose by just over one percent overnight as the Energy Information Administration (EIA) Crude Inventories showed a drop of 3.3 million barrels, continuing the trend of declines of crude oil in storage in the U.S. Although the number was slightly less than predicted, crude also got a boost from continued supply disruptions in Libya as well as potential weather related disruptions in the Gulf of Mexico.
The street appears to be in a wait and said mode now, firstly from Yellen's keynote speech at Jackson Hole, and secondly for more substantial evidence of OPEC compliance and a tightening of supplies globally rather than just the United States. The market seems unwilling to pull the trigger and test higher ranges on either Brent or WTI until this happens, even as the short end of the Brent futures curve moves into backwardation.
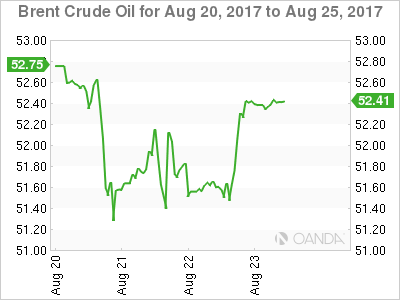
Brent spot is trading flat at 52.65, just below its upper range boundary at 52.70. A break opens up a test of 53.50 as Brent's price action and premium over WTI spot continues to be the more constructive of the two. Only a move below 51.20 would shake confidence at this stage.
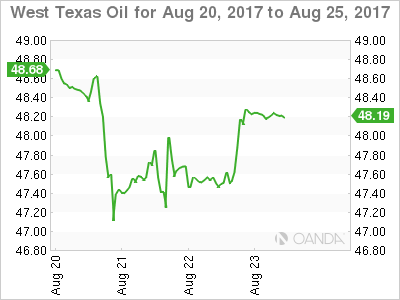
WTI spot is also flat from its New York close at 48.20. The short term technical show a converging triangle with lower and upper boundaries at 47.65 (also the 100-day average) and 48.50. A break of either level opens an extension of the price action below 47.00 and above 49.00 respectively.
GOLD
The summer doldrums continued overnight as gold produced a sideways day ahead of the start of the Jackson Hole Symposium. The trend line support, today at 1281.00, remained untested overnight as gold traded quietly higher to close near the top of its range at 1288.00.
Ms. Yellen's speech will decide the near term fate of the U.S. dollar and thus gold as well so patience will be required until her keynote speech tomorrow.
In the meantime, however, gold's price action continues to be constructive as its quietly goes about its work consolidating the gains of the last ten days. Resistance appears initially at 1296.00 followed by the Friday high at 1301.00.
European Open Briefing: Asian Equity Markets Gained Slightly On Thursday
Global Markets:
- Asian stock markets: Nikkei lost 0.28 %, Shanghai Composite lost 0.07 %, Hang Seng up 0.09 %, ASX 200 gained 0.04 %
- Commodities: Gold at $1294.98 (+0.02 %), Silver at $17.06 (+0.10 %), WTI Oil at $48.36 (-0.10 %), Brent Oil at $52.55 (-0.02 %)
- Rates: US 10-year yield at 2.17, UK 10-year yield at 1.06, German 10-year yield at 0.36
News & Data:
- USD New Home Sales 571 K vs 611 K expected
- USD Crude Oil Inventories -3.3 M vs -8.9 M expected
- EUR French Flash Manufacturing PMI 55.8 vs 54.5 expected
- EUR French Flash Services PMI 55.5 vs 55.9 expected
- EUR German Flash Manufacturing PMI 59.4 vs 57.7 expected
- EUR German Flash Services PMI 53.4 vs 53.4 expected
- EUR Flash Manufacturing PMI 57.4 vs 56.3 expected
- EUR Flash Services PMI 54.9 vs 55.4 expected
Markets Update:
Asian equity markets gained slightly on Thursday in spite of the concerns about the Trump administration’s ability to enact its fiscal agenda. Most indexes were seen trading in a tight range as investors await guidance from a key meeting of global central bankers.
EURUSD buyers managed to find their feet early on in the day on Wednesday eventually closing the day above 1.1800, post this the Euro continued to trade within a very small range as there were very little factors driving it. Currently the Euro is seen trading close to it’s opening price around 1.1806 against the US Dollar losing a few points (net) on the session.
USDJPY has been quite active early on Thursday in spite of the very light data inflow. The yen slipped 0.2 percent as the US dollar popped over 30 pips from early session lows under 108.90 and is currently seen trading at 109.2.
AUDUSD gained a few points early in the session reaching highs of 0.79160, but it didn't last as price dipped back and is now little net changed on the session. The 0.7950 line is likely going to be the next target for the Aussie should the round number 0.7900 hold as support.
Upcoming Events:
- 08:30 GMT – (GBP) Second Estimate GDP q/q
- 08:30 GMT – (GBP) Prelim Business Investment q/q
- 12:30 GMT – (USD) Unemployment Claims
- 14:00 GMT – (USD) Existing Home Sales