
Sample Category Title
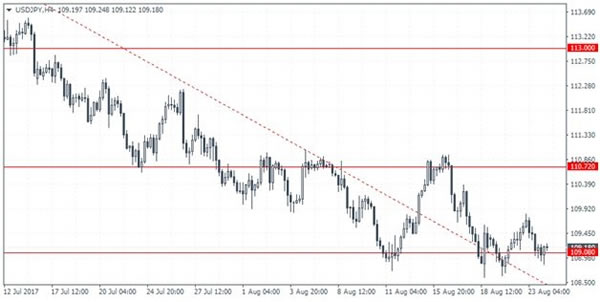
USDJPY Intraday Analysis
USDJPY (109.18): The USDJPY continues to consolidate around the support level of 109.15. The currency pair fell back to this level after earlier attempts to bounce off this level faded. The support level at 109.08 thus continues to remain a strong level of support. To the upside, USDJPY will be looking towards targeting the resistance level at 110.72. However, the potential for a downside breakout in prices could formalize. Below 109.08, USDJPY could initially slip towards 109.00 followed by further declines depending on the daily close.
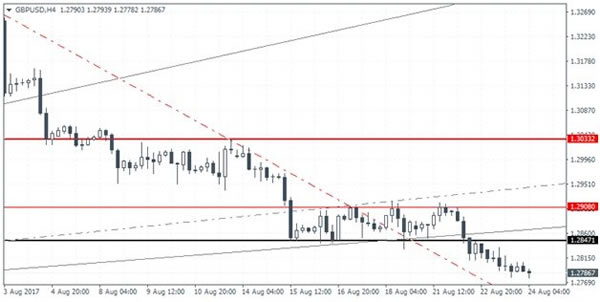
GBPUSD Intraday Analysis
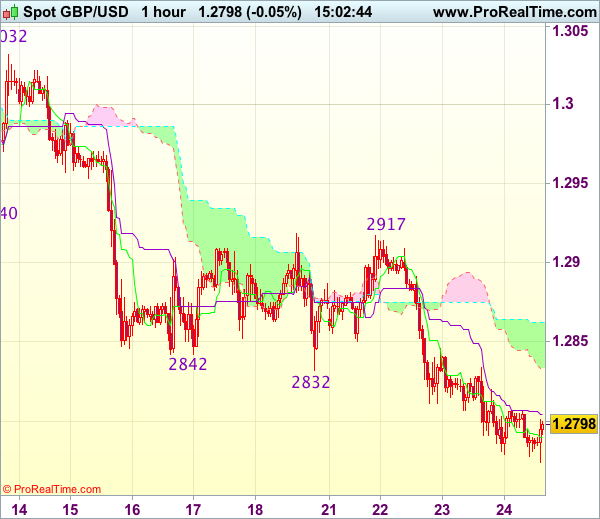
GBPUSD (1.2786): The British pound extended the declines below 1.2847 support level, and further declines could be expected in the near term. The next main support level is at 1.2628. In the near term, any retracement could be limited to the support level of 1.2847 which could be tested in order for resistance to be established. In the event that GBPUSD posts a stronger retracement, we can expect the sideways pattern to play out within the ranges of 1.2908 and 1.2847.
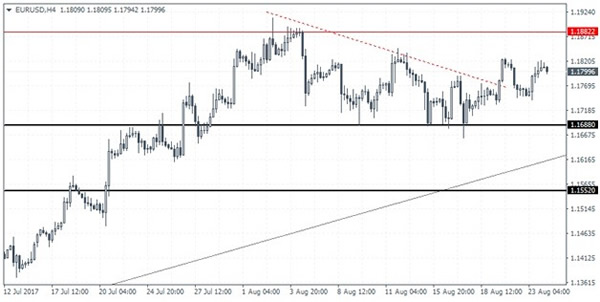
EURUSD Intraday Analysis
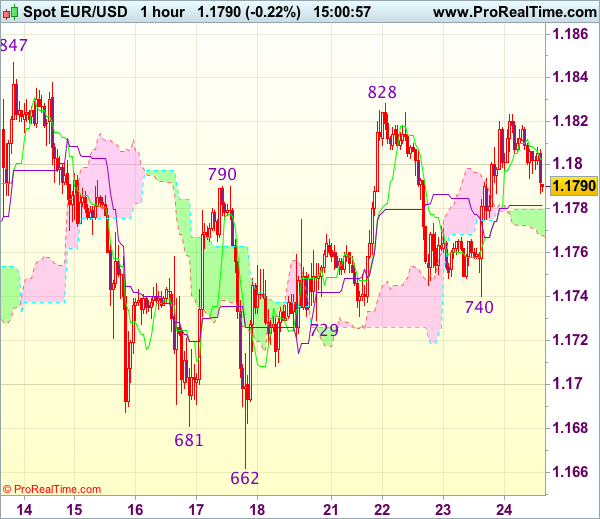
EURUSD (1.1799): The EURUSD remains trading flat with price action posting some gains yesterday, reaching to 1.1815. The sideways range saw price briefly retesting the breakout level from the ascending triangle pattern. Resistance is seen at 1.1815 - 1.1820 with the potential for an upside breakout. This could send the common currency to test the previous resistance level of 1.1882 with further gains expected on a break above this resistance level. To the downside, a close below yesterday's low near of 1.1749 could keep EURUSD falling back to retest the support level at 1.1688.
Trump’s Remarks Keep The Greenback Subdued
The US dollar remained weak yesterday as investors digested the news about the latest threats from President Trump. Speaking at an event in Arizona the day before, Trump threatened to shut down the government if he did not receive funding to build the wall at the Mexican border. Further to this, the fact that the US debt ceiling will be hit by October further accentuated the remarks.
On the economic front, new home sales fell 9.4% more than the forecasts of a flat reading. However, the previous three month new home sales data was revised significantly higher offsetting the declines. Markit's flash manufacturing PMI for the US fell to 53.3 falling below the estimates of 52.5 but services PMI rose to 56.9.
In the Eurozone, flash composite PMI continued to rise, especially with the manufacturing PMI hitting a six and a half year high. Services PMI for August, however, slipped to a 7-month low.
Looking ahead, the annual Jackson Hole symposium starts today. On the economic front, the UK's second revised GDP estimate for the quarter ending June will be coming out. Estimates point to no change in the quarterly GDP, but business investment is expected to decline.
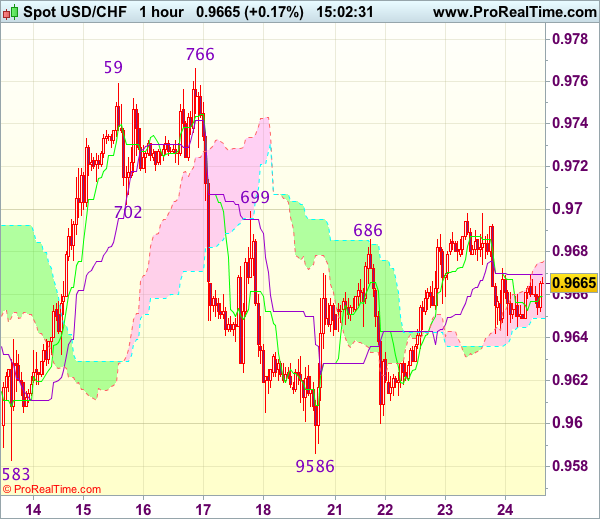
Trade Idea : USD/CHF – Buy at 0.9620
USD/CHF - 0.9656
Most recent candlesticks pattern : N/A
Trend : Sideways
Tenkan-Sen level : 0.9659
Kijun-Sen level : 0.9670
Ichimoku cloud top : 0.9675
Ichimoku cloud bottom : 0.9649
Original strategy :
Buy at 0.9620, Target: 0.9720, Stop: 0.9585
Position : -
Target : -
Stop : -
New strategy :
Buy at 0.9620, Target: 0.9720, Stop: 0.9585
Position : -
Target : -
Stop : -
Dollar’s retreat after faltering below resistance at 0.9699 suggests initial downside risk remains for weakness to 0.9620-30, however, as long as support at 0.9586 holds, prospect of another rebound remains, above indicated resistance at 0.9699 would signal the retreat from 0.9766 has ended at 0.9586 last week and mild upside bias is seen for gain to 0.9720, then 0.9740, having said that, reckon resistance at 0.9766-73 would cap upside and bring further consolidation. Only a break of 0.9773 would retain bullishness and signal early rise from 0.9438 has resumed and extend gain to 0.9800.
In view of this, we are looking to buy dollar on further pullback as 0.9620-30 should limit downside. Below 0.9600 would risk test of strong support at 0.9583-86 but only break there would signal a downside break of recent broad range has occurred, bring subsequent fall to 0.9550.
What Does A Government Shutdown Mean For The U.S. Markets?
'If we have to close down our government, we're building that wall' Donald Trump
After stocks and the dollar surged on Tuesday, following a Politico report that Trump's team have taken a significant step on tax reforms, the President's threatson Tuesday night to shut down the government and terminate the NAFTA agreement,were not well received by investors, who responded by dragging both equities and the dollar lower.
History reveals that markets tend to experience modest weakness during shutdowns, with the S&P 500 falling an average of 0.6% over the period of closure. However, markets don'talways drop. Equities gained eight times out of the 18 shutdowns from 1976 to 2013, and the largest recorded rally was during Obama's era in 2013, with gains exceeding 3%. However, when one party controlled the Presidency, Senate, and the House, it looked different. From 1977 until 1979, when Democrats lead by Jimmy Carter, controlled all three branches, the government was shut down five times,markets dropped on four of these occasions, with average losses of 2.7%. If a shutdown can'tbe avoided, investors hope it looks more like an Obama than a Carter era.
A shutdown isn't the biggest threat right now, the more pressing issue is the timing of the delivery of a detailed plan on tax reforms. The longer such reforms are delayed, the more anxiety will be felt in financial markets, thus expect to see further weakness in U.S. equities in September.
Investors in wait-and-see mode
Financial assets, whether it's equities, currencies, or fixed income,are trading in very tight ranges early Thursday, and I expect such moves to continue throughout the day. With the lack of tier one economic data, investors are bracing for some hints from the annual central bank gathering at Jackson Hole, which kicks off today.
ECB's Mario Draghi refrained from giving any indications on future policy,when he delivered a speech at a conference in Germany yesterday. It seems he is trying to avoid commenting on monetary policy, after the Euro surged by more than 12% on expectations of QE getting closer to an end. I believe Euro bulls will also be disappointed when Draghi speaks on Friday, as he'll continue to shy away from any specific timing on tapering bond purchases. However, given the strength in economic activity and diminishing outstanding bonds available to purchase, the ECB has no alternative but to begin the normalization process, and any pull back in the Euro will be seen as an opportunity to get in.
Fed Chair, Janet Yellen will also be speaking Friday on financial stability. Her speech is of great importance, given the recent warnings from the Fed on vulnerabilities associated with asset valuations. Few disagree that the global easy monetary policies have created overstretched valuations. Whether it's stocks, fixed income, real estate or bitcoins, there is a bubble somewhere. Sooner or later some sort of significant correction in prices should occur, but central bankers want to make sure that economic stability won'tbe impacted and this isn't an easy task.
Trade Idea : GBP/USD – Buy at 1.2770
GBP/USD - 1.2800
Most recent candlesticks pattern : N/A
Trend : Near term down
Tenkan-Sen level : 1.2790
Kijun-Sen level : 1.2804
Ichimoku cloud top : 1.2862
Ichimoku cloud bottom : 1.2833
New strategy :
Buy at 1.2770, Target: 1.2870, Stop: 1.2735
Position : -
Target : -
Stop : -
Although cable has remained under pressure and near term downside risk remains for recent selloff to extend one more fall, loss of downward momentum should prevent sharp fall below 1.2750-55, risk from there has increased for a rebound to take place soon, above 1.2845-50 would suggest a temporary low is possibly formed, bring a stronger rebound to 1.2870, break there would add credence to this view, then retracement of recent decline would commence for further gain to 1.2900.
In view of this, we are inclined to turn long on next decline. Below 1.2740-50 would risk weakness to 1.2720-25, however, still reckon downside would be limited to 1.2700-05 (100% projection of 1.3269-1.2940 measuring from 1.3032) and risk from there remains for another rebound to take place later.
Trade Idea : EUR/USD – Hold long entered at 1.1765
EUR/USD - 1.1791
Most recent candlesticks pattern : N/A
Trend : Sideways
Tenkan-Sen level : 1.1803
Kijun-Sen level : 1.1782
Ichimoku cloud top : 1.1780
Ichimoku cloud bottom : 1.1768
Original strategy :
Bought at 1.1765, Target: 1.1865, Stop: 1.1770
Position : - Long at 1.1765
Target : - 1.1865
Stop : - 1.1770
New strategy :
Hold long entered at 1.1765, Target: 1.1865, Stop: 1.1770
Position : - Long at 1.1765
Target : - 1.1865
Stop : - 1.1770
As the single currency has retreated after faltering below resistance at 1.1828, suggesting minor consolidation would be seen, however, as long as 1.1765-70 holds, mild upside bias remains for another rebound, above said resistance at 1.1828 would extend the rise from 1.1662 low to resistance at 1.1847, break there would provide confirmation that the pullback from 1.1910 has ended and encourage for headway to 1.1870-80 but reckon said resistance at 1.1910 would hold from here.
In view of this, we are holding on to our long position entered at 1.1765. Only below 1.1740 support would abort and suggest the rebound from 1.1662 has ended instead, risk weakness to 1.1695-00 first.
Trade Idea : USD/JPY – Stand aside
USD/JPY - 109.35
Most recent candlesticks pattern : N/A
Trend : Near term down
Tenkan-Sen level : 109.11
Kijun-Sen level : 109.21
Ichimoku cloud top : 109.54
Ichimoku cloud bottom : 109.23
New strategy :
Stand aside
Position : -
Target : -
Stop : -
Despite falling initially to 108.84 earlier today, the subsequent rebound suggests decline is not ready to resume yet and further consolidation is in store, hence risk of another bounce to 109.55-60 is seen, however, reckon resistance at 109.83 (yesterday’s high) would hold and bring retreat later. Only a break of 109.83 would signal low has been formed at 108.60 earlier, bring further gain to 110.00 and later towards previous resistance at 110.37.
On the downside, below 109.00 would bring test of 108.84 but only break of said support at 108.60 would revive bearishness and confirm recent decline has resumed for further weakness to 108.30 (1.618 times projection of 110.95-109.67 measuring from 110.37), then towards 108.00. As near term outlook is still mixed, would be prudent to stand aside in the meantime.

Aussie Dollar At Risk Of Breakdown Vs Japanese Yen
Key Highlights
- The Aussie Dollar is struggling against the Japanese Yen and just holding the 86.00 support.
- There is a steep bearish trend line with resistance at 86.20 forming on the 4-hours chart of AUD/JPY.
- Japan’s Leading Economic Index for June 2017 posted an increase from the last revised reading of 104.7 to 105.9.
- Japan’s Coincident Index for June 2017 posted an increase from the last revised reading of 115.8 to 117.1.
AUD/JPY Technical Analysis
The Aussie Dollar after a close below 86.60 struggled a lot against the Japanese Yen. The AUD/JPY pair is trading above a crucial 86.00 support, but remains at a risk of a breakdown.
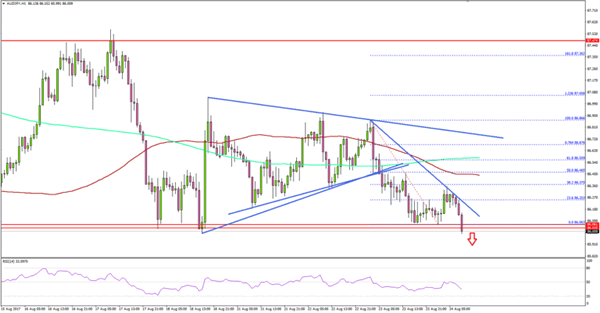
The pair has almost breached the 86.00 support area and poised to extend declines. On the upside, there is a steep bearish trend line with resistance at 86.20 forming on the 4-hours chart.
The pair recently failed to break the 38.2% Fib retracement level of the last decline from the 86.86 high to 86.06 low. Therefore, there are high chances of it breaking 86.00 and declining further.
The pair is also well below the 100 and 200 simple moving average (positioned near 86.50-60). Overall, as long as the pair does not overtake the 86.50 resistance, it remains at a risk of a downside break below 86.00.
Japan’s Leading Economic and Coincident Index
Today, Japan saw releases of the Leading Economic and the Coincident index for June 2017 by the Cabinet Office.
The Leading Economic index was forecasted to remain unchanged from the last reading of 106.3. However, the end result was mixed, as the Leading Economic index came in at 105.9, and the last reading was revised down from 106.3 to 104.7. So, there was a net increase of 1.2 points.
Similarly, the Coincident index was forecasted to remain unchanged from the last reading of 117.2. However, the end result was neutral, as the Coincident index came in at 117.1, and the last reading was revised down from 117.2 to 115.8. So, there was a net increase of 1.3 points.
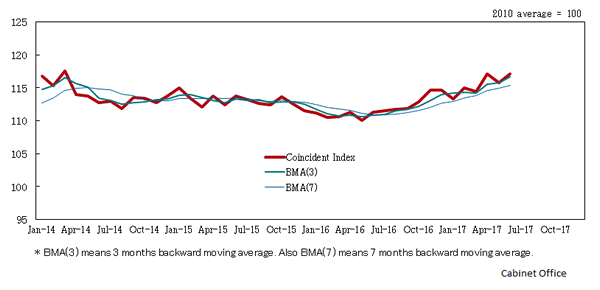
The Coincident index is stable around the BMA (3), which is 3 months backward moving average. And, the index is now well above BMA (7), which is 7 months backward moving average.