
Sample Category Title
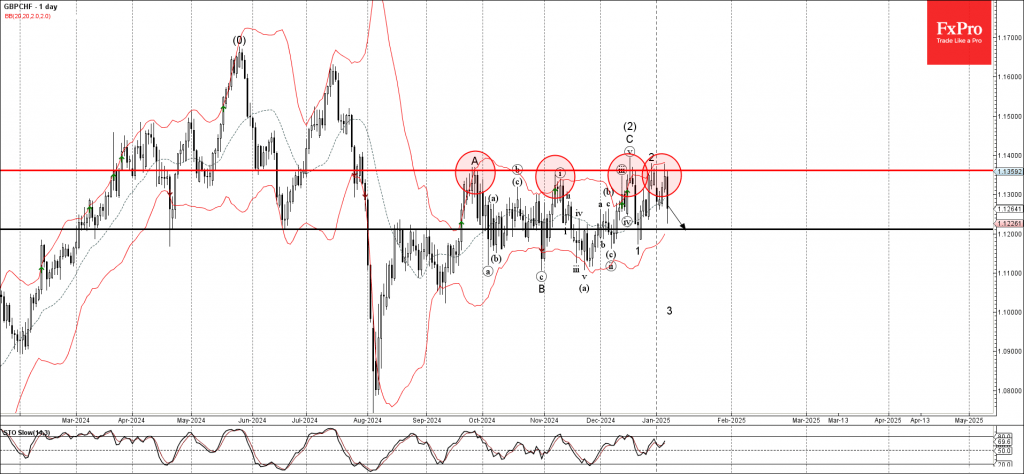
GBPCHF Wave Analysis
- GBPCHF reversed from resistance zone
- Likely to fall to support level 1.1200
GBPCHF currency pair recently reversed down from the resistance zone located between the strong multi-month resistance level 1.1360 (which has been reversing the price from September) and the upper daily Bollinger Band.
The downward reversal from this resistance zone is likely to form the daily Evening Star Japanese candlesticks reversal pattern.
Given the strength of the nearby resistance level 1.1360, GBPCHF currency pair can be expected to fall to the next support level 1.1200.
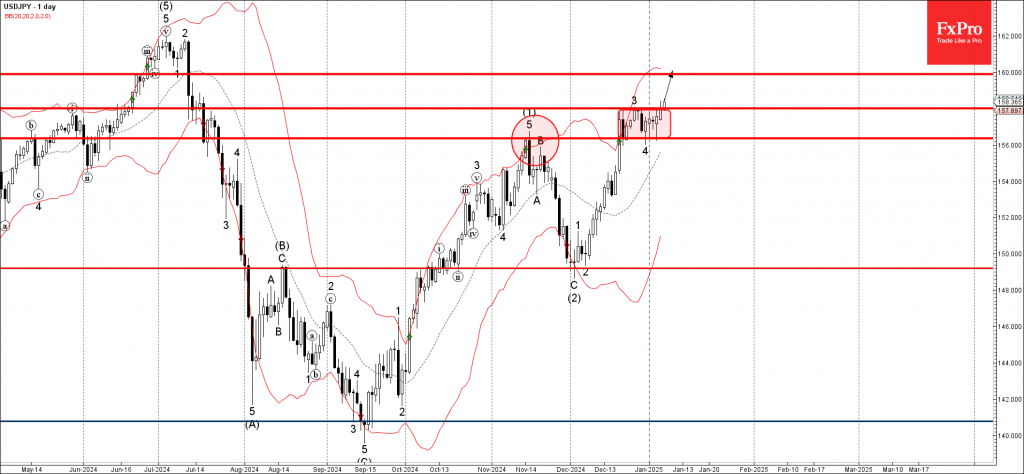
USDJPY Wave Analysis
- USDJPY broke resistance level 158.00
- Likely to rise to resistance level 160.00
USDJPY currency pair recently broke the resistance level 158.00, which is the upper border of the narrow sideways price range inside which the pair has been trading from December.
The breakout of the resistance level 158.00 should accelerate the active minor impulse wave 5 of the intermediate impulse wave (3) from the start of December.
Given the clear daily uptrend and the continued bullish US dollar sentiment, USDJPY currency pair can be expected to rise to the next resistance level 160.00.
FOMC minutes signal nearness to slow pace of rate cuts
The minutes from Fed's December meeting revealed divided sentiment among policymakers regarding the latest rate cut. While the decision to lower rates was ultimately made, it was described as “finely balanced,” with some participants emphasizing the "merits" of pausing rate reductions given persistent challenges in curbing inflation.
The minutes highlighted a growing sense within the FOMC that monetary easing might need to slow. After a cumulative 100 basis points of cuts in 2024, participants noted that the Committee is “at or near the point at which it would be appropriate to slow the pace of policy easing.” Most agreed that a more cautious approach would be prudent when considering additional rate adjustments.
The inflation outlook remained a key area of focus. While participants expected inflation to gradually align with the 2% target, recent higher-than-anticipated inflation readings and uncertainty stemming from potential changes in trade and immigration policy raised concerns.
These developments suggest that the disinflation process may "take longer than previously anticipated", with some participants observing signs that progress might have stalled temporarily.
(FED) Minutes of the Federal Open Market Committee
December 17–18, 2024
A joint meeting of the Federal Open Market Committee and the Board of Governors of the Federal Reserve System was held in the offices of the Board of Governors on Tuesday, December 17, 2024, at 10:30 a.m. and continued on Wednesday, December 18, 2024, at 9:00 a.m.1
Developments in Financial Markets and Open Market Operations
The manager turned first to a review of developments in financial markets. Nominal Treasury yields fluctuated over the intermeeting period and were slightly higher, on net, than in early November. Treasury yields had risen notably since their trough in mid-September, with the rise in the 10-year nominal yield driven largely by increases in real yields. Liquidity in Treasury markets deteriorated somewhat following the U.S. election but remained well within the ranges observed over the past three years. With near-term measures of inflation compensation a little higher over the intermeeting period and longer-term measures little changed, the manager noted that there were few signs of concern about persistent inflationary pressures in market prices. Equity prices largely sustained the gains that they had experienced in anticipation of, and immediately following, the U.S. election.
The manager noted that market expectations for the path of the federal funds rate were little changed over the intermeeting period. Markets had almost fully priced in a 25 basis point cut in the target range for the federal funds rate at this meeting, and all respondents from the Open Market Desk's Survey of Primary Dealers and Survey of Market Participants expected the same. Survey respondents anticipated that the pace of rate cuts would slow considerably in 2025, with the median respondent expecting 75 basis points of cuts for the full year; options and futures prices suggested a somewhat lower level of expected policy easing in 2025. However, in discussing both survey and market expectations, the manager noted that there was considerable uncertainty among market participants about the path of the federal funds rate in the year ahead.
The manager also discussed balance sheet policy expectations. The average estimate of survey respondents for the timing of the end of balance sheet runoff shifted a bit later, to June 2025. This shift mainly reflected revisions to estimates by respondents who had expected balance sheet runoff to end in the last quarter of 2024 or in early 2025.
Regarding international developments, the manager noted that market participants expected central banks in nearly all advanced foreign economies (AFEs) to continue to reduce their policy rates in 2025. In contrast to the U.S., market expectations for policy rates at the end of 2025 in most AFEs had shifted lower over the intermeeting period. The manager noted that this widening between U.S. and foreign interest rates appeared to be a major contributor to the increase in the trade-weighted U.S. dollar index observed over the intermeeting period.
The manager then turned to money markets and Desk operations. Unsecured overnight rates had remained stable over the intermeeting period, and with the exception of temporary pressures around month-end and Treasury auction settlement dates, rates on overnight repurchase agreements (repo) were little changed. The manager noted that, on average, market participants appeared to be expecting upward pressure in repo markets around year-end comparable with that seen at the September quarter-end. Based on term and forward-settling repo volumes, market participants appeared to have been more proactive than in recent years in preparing for the year-end, which the manager judged could help mitigate somewhat the extent of upward pressure on repo rates during that time.
Pricing in the federal funds market continued to be insensitive to day-to-day changes in the supply of reserves over the intermeeting period. The manager noted that this outcome was consistent with reserves remaining abundant and that various other indicators, as well as responses about banks' desired reserve levels from the Federal Reserve's Senior Financial Officer Survey, pointed to the same conclusion. Looking ahead, the manager raised the possibility that the potential reinstatement of the debt limit in 2025 could result in substantial shifts in Federal Reserve liabilities that could pose challenges in assessing reserve conditions.
Usage of the overnight reverse repurchase agreement (ON RRP) facility continued its decline over the intermeeting period. The recent decrease in ON RRP usage was attributable in part to increases in net Treasury bill issuance, which made Treasury bill rates more attractive. In the near term, the manager judged that ON RRP volumes were likely to rise because of an expected decline in net Treasury bill issuance and typical year-end dynamics. The manager also noted that the potential reinstatement of the debt limit could keep ON RRP balances elevated for some time in 2025.
The manager discussed market expectations regarding a technical adjustment that would lower the ON RRP offering rate to the bottom of the target range for the federal funds rate. Based on the Desk surveys and market outreach, most market participants expected such an adjustment at this meeting. Market participants' views varied on how much downward pressure this adjustment would put on money market rates, but repo rates were generally expected to fall more than the federal funds rate.
The manager concluded by noting that the Desk was planning to add a second standing repo facility (SRF) auction on each day of the week spanning year-end. The manager viewed these additional auctions as technical exercises that could improve the Federal Reserve's understanding of how SRF auction times can support effective policy implementation and market functioning during periods of expected money market pressures.
By unanimous vote, the Committee ratified the Desk's domestic transactions over the intermeeting period. There were no intervention operations in foreign currencies for the System's account during the intermeeting period.
Staff Review of the Economic Situation
The information available at the time of the meeting indicated that real gross domestic product (GDP) had continued to expand at a solid pace in 2024. Labor market conditions had eased since early 2024, but the unemployment rate remained low. Consumer price inflation was below its year-earlier rate but was still somewhat elevated.
Total consumer price inflation—as measured by the 12-month change in the price index for personal consumption expenditures (PCE)—was 2.3 percent in October, below the 3.0 percent rate seen a year earlier. Core PCE price inflation—which excludes changes in consumer energy prices and many consumer food prices—was 2.8 percent in October, lower than its 3.4 percent rate a year earlier. In November, the 12-month change in the consumer price index (CPI) was 2.7 percent, and core CPI inflation was 3.3 percent; both were below their year-earlier rates. Given both the CPI and producer price index data, the staff estimated that total PCE price inflation would be reported as 2.5 percent over the 12 months ending in November and that core PCE price inflation would be 2.8 percent.
Recent data suggested that labor market conditions had eased slightly further but remained solid. Average monthly nonfarm payroll gains over October and November were a little below their pace in the third quarter. The staff estimated that job gains were held down by the effects of labor strikes and hurricanes in October and were boosted by a similar amount in November after those effects unwound. The unemployment rate ticked up to 4.2 percent in November, and both the labor force participation rate and the employment-to-population ratio moved down a bit further. The unemployment rates for African Americans and for Hispanics also moved up, and both rates were above those for Asians and for Whites. The ratio of job vacancies to unemployment held steady at 1.1 in November, slightly lower than its level just before the pandemic. Average hourly earnings for all employees rose 4 percent over the 12 months ending in November—the same rate as in the previous month.
Real GDP posted a solid gain in the third quarter that was similar to its second-quarter pace. Real private domestic final purchases (PDFP)—which comprises PCE and private fixed investment and which often provides a better signal than GDP of underlying economic momentum—rose faster than real GDP in the third quarter. Exports rose briskly in the third quarter; import growth was even faster. In the fourth quarter, available economic indicators suggested that real GDP growth remained solid, with growth of real PDFP still outpacing that of real GDP. Imports fell more than exports in October, with real imports of capital goods dropping back after brisk growth earlier in the year.
Foreign economic growth picked up in the third quarter, notably in the euro area and in Mexico. Recent economic indicators, however, suggested much weaker momentum in foreign economies in the fourth quarter, with lackluster manufacturing activity and subdued private consumption spending. In China, growth in retail sales slowed, suggesting that domestic demand remained weak. Strength in high-tech goods production continued abroad, mainly in Asia excluding China, supported by buoyant U.S. demand.
Inflation in foreign economies continued to ease. In most AFEs, headline inflation slowed to near or below target levels, mainly reflecting the pass-through of lower energy prices earlier in the year. Services inflation, however, remained high in some of those economies. In China, inflation remained close to zero, in part due to falling food prices. By contrast, in some Latin American countries, most notably Brazil, inflation continued to increase, partly because of currency depreciation.
Staff Review of the Financial Situation
The market-implied path of the federal funds rate over the next year edged higher, on net, since the U.S. election, as investors assessed the implications of incoming inflation data and potential economic policy changes for the near-term economic outlook. Communications by Federal Reserve officials contributed to investors' perceptions of a slower timeline for policy rate reductions. Nominal Treasury yields across the maturity spectrum initially increased but then reversed those increases, ending the intermeeting period little changed. Measures of near-term inflation compensation moved up, while those of longer-term inflation compensation were little changed.
Broad equity prices rose, with more pronounced increases in stock prices in cyclical sectors amid increased investor optimism for corporate profits, and high-yield bond spreads narrowed. The VIX—a forward-looking measure of near-term equity market volatility—fell notably and remained well below pre-election levels.
Foreign financial market pricing reflected weaker-than-expected foreign data releases, expectations of further policy easing by foreign central banks, and potential changes in U.S. trade policy. Accordingly, foreign bond yields generally declined relative to their U.S. counterparts, contributing to dollar appreciation against most foreign currencies. Foreign equities generally underperformed U.S. equities, in part reflecting investors' expectations of economic growth diverging further between the U.S. and the rest of the world.
Many foreign central banks eased their policy rates during the intermeeting period, including the Bank of Canada, the European Central Bank, and the Swiss National Bank, among the AFEs, and the central banks of Hong Kong, India, Korea, and Mexico, among the emerging market economies. An exception was the Central Bank of Brazil, which increased its policy rate 100 basis points and signaled further hikes in the face of inflationary pressures.
Conditions in U.S. short-term funding markets remained generally stable over the intermeeting period, with the lowering of the target range for the federal funds rate in November fully passing through to both secured and unsecured reference rates. Money market funds' (MMFs) usage of the ON RRP facility was lower, on average, than in the previous intermeeting period, reflecting increased holdings of Treasury bills amid sizable net bill issuance. Overall, MMF assets under management stayed near record highs. Spreads of unsecured commercial paper maturing over year-end remained within typical ranges, and global offshore dollar funding markets continued to be stable.
In domestic markets, borrowing costs for households, businesses, and municipalities remained elevated despite small declines in most credit segments. Rates on 30-year fixed-rate conforming residential mortgages declined but stayed elevated. Interest rates on credit cards and new auto loans continued to be at historical highs, although interest rates on new auto loans decreased further. Borrowing costs for leveraged loan borrowers declined slightly. Interest rates on newly originated commercial and industrial (C&I) loans ticked down in the third quarter, and interest rates on short-term loans to small businesses remained unchanged. Yields on an array of fixed-income securities, including investment- and speculative-grade corporate bonds and commercial mortgage-backed securities (CMBS), decreased slightly but remained elevated.
Financing in capital markets continued to be broadly available for large-to-midsize businesses and municipalities. For small businesses, however, credit availability remained relatively tight, and loan originations stayed subdued in October. C&I loans by banks increased moderately in October and were flat through November after modest growth in the third quarter. After stalling in the third quarter, commercial real estate (CRE) loan growth picked up moderately in October and remained subdued through late November. Meanwhile, agency CMBS issuance continued to be weak in October, while non-agency CMBS issuance was strong in October and in the first three weeks of November, reflecting a high volume of refinancing activity.
Credit continued to be generally available for most households. Even so, auto loans were little changed in the third quarter, and growth of revolving credit was weak into November. Credit in the residential mortgage market continued to be readily available for high-credit-score borrowers, while credit availability for low-credit-score borrowers improved, on net, over the six months through October.
Credit quality remained solid for large-to-midsize firms, municipalities, and most home mortgage borrowers. The credit performance of corporate bonds and leveraged loans was generally stable. At banks, delinquency rates on C&I loans were stable and remained within the range observed over the past decade. Delinquency rates on small business loans continued to increase through October, as did delinquencies on small business credit cards through September. In CRE markets, credit performance deteriorated further as aggregate CMBS delinquency rates rose through October, driven by delinquencies on office loans. At banks, delinquency rates on CRE loans ticked up through September from already elevated levels. Regarding household credit quality, delinquency rates on most residential mortgages were largely unchanged and stood near historical lows. However, the delinquency rate on Federal Housing Administration mortgages, which are disproportionately used by borrowers with lower credit scores and smaller down payments, remained above pre-pandemic levels. Delinquency rates on credit cards continued to increase, albeit at a slower pace than earlier in the year, while delinquency rates on auto loans were unchanged.
Staff Economic Outlook
The staff projection at the December meeting was for economic conditions to stay solid. Given the elevated uncertainty regarding specifics about the scope and timing of potential changes to trade, immigration, fiscal, and regulatory policies and their potential effects on the economy, the staff highlighted the difficulty of selecting and assessing the importance of such factors for the baseline projection and featured a number of alternative scenarios. After incorporating the recent data and preliminary placeholder assumptions about potential policy changes, real GDP growth was projected to be slightly slower than in the previous baseline forecast, and the unemployment rate was expected to be a bit higher but to remain near the staff's estimate of its natural rate.
In the staff's baseline projection, the inflation forecast for 2024 was slightly higher than the one prepared for the previous meeting, reflecting upside surprises in some recent data. Inflation in 2025 was expected to remain at about the same rate as in 2024, as the effects of the staff's placeholder trade policy assumptions held inflation up. Thereafter, inflation was forecast to decline to 2 percent by 2027, the same as in the projection at the November meeting.
The staff continued to view the uncertainty around the baseline projection as within the range seen over the past 20 years, a period that encompassed a number of episodes during which uncertainty about the economy and federal policy changes was elevated. The staff judged that the risks around the baseline forecasts for employment and real GDP growth were balanced, as concerns about downside risks from a marked cooling in labor market conditions had eased in recent months. The risks around the inflation forecast were seen as tilted to the upside, as core inflation had not come down as much as expected in 2024 and the effects of trade policy changes could be larger than the staff had assumed.
Participants' Views on Current Conditions and the Economic Outlook
In conjunction with this FOMC meeting, participants submitted their projections of the most likely outcomes for real GDP growth, the unemployment rate, and inflation for each year from 2024 through 2027 and over the longer run. These projections were based on participants' individual assessments of appropriate monetary policy, including their projections of the federal funds rate. The longer-run projections represented each participant's assessment of the rate to which each variable would tend to converge under appropriate monetary policy and in the absence of further shocks to the economy. The Summary of Economic Projections was released to the public after the meeting.
In their discussion of inflation developments, participants noted that although inflation had eased substantially from its peak in 2022, it remained somewhat elevated. Participants commented that the overall pace of disinflation had slowed over 2024 and that some recent monthly price readings had been higher than anticipated. Nevertheless, most remarked that disinflationary progress continued to be apparent across a broad range of core goods and services prices. Notably, some participants observed that in the core goods and market-based core services categories, excluding housing, prices were increasing at rates close to those seen during earlier periods of price stability. Many participants noted that the slowing in these components of inflation corroborated reports received from their business contacts that firms were more reluctant to increase prices, as consumers appeared to be more price sensitive and were increasingly seeking discounts. With respect to core services prices, a majority of participants remarked that increases in some components had exceeded expectations over recent months; many noted, however, that the increases were concentrated largely in non-market-based price categories and that price movements in such categories typically have not provided reliable signals about resource pressures or the future trajectory of inflation. Most participants also remarked that increases in housing services prices remained somewhat elevated, though they continued to slow gradually, as the pace of rent increases for new tenants continued to moderate and would eventually be reflected further in housing services prices.
With regard to the outlook for inflation, participants expected that inflation would continue to move toward 2 percent, although they noted that recent higher-than-expected readings on inflation, and the effects of potential changes in trade and immigration policy, suggested that the process could take longer than previously anticipated. Several observed that the disinflationary process may have stalled temporarily or noted the risk that it could. A couple of participants judged that positive sentiment in financial markets and momentum in economic activity could continue to put upward pressure on inflation. All participants judged that uncertainty about the scope, timing, and economic effects of potential changes in policies affecting foreign trade and immigration was elevated. Reflecting that uncertainty, participants took varied approaches in accounting for these effects. A number of participants indicated that they incorporated placeholder assumptions to one degree or another into their projections. Other participants indicated that they did not incorporate such assumptions, and a few participants did not indicate whether they incorporated such assumptions.
Several participants remarked that insofar as recent solid increases in real GDP reflected favorable supply developments, the strength of economic activity was unlikely to be a source of upward inflation pressures. Participants cited various factors as being likely to put continuing downward pressure on inflation, including waning business pricing power, the Committee's still-restrictive monetary policy stance, and well-anchored longer-term inflation expectations. Some participants noted that nominal wage growth had continued to move down. Further, several observed that, with supply and demand in the labor market being roughly in balance and in light of recent productivity gains, labor market conditions were unlikely to be a source of inflationary pressure in the near future. However, several remarked that nominal wage growth remained slightly above the pace likely to be consistent over time with 2 percent inflation.
In discussing labor market developments, participants viewed recent readings on a range of indicators as consistent with an ongoing gradual easing in labor market conditions even as the unemployment rate remained low. Participants cited declines in job vacancies, the quits rate, the rate at which the unemployed were obtaining jobs, and turnover as consistent with a gradual easing in labor demand. Participants generally noted, however, that there were no signs of rapid deterioration in labor market conditions, as layoffs remained low. Participants generally judged that current labor market conditions were broadly consistent with the Committee's longer-run goal of maximum employment.
With regard to the outlook for the labor market, participants anticipated that under appropriate monetary policy, conditions in the labor market would likely remain solid. Participants generally noted that labor market indicators merited close monitoring. Several participants observed that the evaluation of underlying trends in labor market developments had continued to be challenging and that assessments of the outlook for the labor market were associated with considerable uncertainty. Some participants noted that the labor market could soften further, as the recent pace of payroll growth had been below the rate that would likely keep the unemployment rate constant, given a stable labor force participation rate.
Participants observed that economic activity had continued to expand at a solid pace and that recent data on economic activity and consumer spending in particular were, on balance, stronger than anticipated. Participants remarked that consumption had been supported by a solid labor market, rising real wages, and elevated household net worth. Several participants cautioned that low- and moderate-income households continued to experience financial strains, which could damp their spending. A couple of participants cited continued increases in rates of delinquencies on credit card borrowing and automobile loans as signs of such strains.
With regard to the business sector, several participants noted that favorable aggregate supply developments—including increases in labor supply, business investment, and productivity—continued to support a solid expansion of business activity. A majority of participants remarked that the behavior of equity markets reflected positive sentiment on the part of investors. Many participants also remarked that District contacts generally reported greater optimism about the economic outlook, stemming in part from an expectation of an easing in government regulations and changes in tax policies. In contrast, some participants noted that contacts reported increased uncertainty regarding potential changes in federal government policies. A couple of participants remarked that the agricultural sector continued to face significant strains stemming from low crop prices and high input costs.
In their evaluation of the risks and uncertainties associated with the economic outlook, the vast majority of participants judged the risks to the attainment of the Committee's dual-mandate objectives of maximum employment and price stability to be roughly in balance. In particular, participants saw two-sided risks to achieving those goals. Almost all participants judged that upside risks to the inflation outlook had increased. As reasons for this judgment, participants cited recent stronger-than-expected readings on inflation and the likely effects of potential changes in trade and immigration policy. Other reasons mentioned included possible disruptions in global supply chains due to geopolitical developments, a larger-than-anticipated easing in financial conditions, stronger-than-expected household spending, and more persistent shelter price increases. A few participants remarked that, in the period ahead, it might be difficult to distinguish more persistent influences on inflation from potentially temporary ones, such as those stemming from changes in trade policy that could lead to shifts in the level of prices. Most participants noted that risks to the achievement of the Committee's maximum-employment goal appeared to be roughly balanced, though some saw risks to the labor market as tilted to the downside. Participants pointed to various risks to economic activity and employment, including downside risks associated with weaker output growth abroad, increased financial vulnerabilities stemming from overvaluation of risky assets, or an unexpected weakening of the labor market, and upside risks associated with increased optimism and continued strength in domestic spending as upside factors.
In their consideration of monetary policy at this meeting, participants generally noted that inflation had made progress toward the Committee's objective but remained somewhat elevated. Participants also observed that recent indicators suggested that economic activity had continued to expand at a solid pace, labor market conditions had generally eased since earlier in the year, and the unemployment rate had moved up but remained low. The vast majority of participants viewed it as appropriate to lower the target range for the federal funds rate by 25 basis points to 4¼ to 4½ percent. They assessed that such a further lowering of the target range for the policy rate would help maintain the strength in the economy and the labor market while continuing to enable further progress on inflation. A majority of participants noted that their judgments about this meeting's appropriate policy action had been finely balanced. Some participants stated that there was merit in keeping the target range for the federal funds rate unchanged. These participants suggested that the risk of persistently elevated inflation had increased in recent months, and several of these participants stressed the need for monetary policy to help foster financial conditions that would be consistent with inflation returning sustainably to 2 percent. Participants judged that it was appropriate to continue the process of reducing the Federal Reserve's securities holdings.
In discussing the outlook for monetary policy, participants indicated that the Committee was at or near the point at which it would be appropriate to slow the pace of policy easing. They also indicated that if the data came in about as expected, with inflation continuing to move down sustainably to 2 percent and the economy remaining near maximum employment, it would be appropriate to continue to move gradually toward a more neutral stance of policy over time. Some participants observed that, with the target range for the federal funds rate having been lowered a total of 100 basis points with this meeting's decision, the policy rate was now significantly closer to its neutral value than when the Committee commenced policy easing in September. In addition, many participants suggested that a variety of factors underlined the need for a careful approach to monetary policy decisions over coming quarters. These factors included recent elevated inflation readings, the continuing strength of spending, reduced downside risks to the outlook for the labor market and economic activity, and increased upside risks to the outlook for inflation. A substantial majority of participants observed that, at the current juncture, with its policy stance still meaningfully restrictive, the Committee was well positioned to take time to assess the evolving outlook for economic activity and inflation, including the economy's responses to the Committee's earlier policy actions. Participants noted that monetary policy decisions were not on a preset course and were conditional on the evolution of the economy, the economic outlook, and the balance of risks.
In discussing risk-management considerations that could bear on the outlook for monetary policy, the vast majority of participants agreed that risks to achieving the Committee's employment and inflation goals remained roughly in balance. Many participants observed that the current high degree of uncertainty made it appropriate for the Committee to take a gradual approach as it moved toward a neutral policy stance. Participants noted that although inflation was on course to return sustainably to 2 percent over the next few years and the Committee was determined to restore and maintain price stability, the likelihood that elevated inflation could be more persistent had increased. Most participants remarked that, with the stance of monetary policy now significantly less restrictive, the Committee could take a careful approach in considering adjustments to the stance of monetary policy. Many participants noted that the Committee could hold the policy rate at a restrictive level, or ease policy more slowly, if inflation remained elevated, and several remarked that policy easing could take place more rapidly if labor market conditions deteriorated, economic activity faltered, or inflation returned to 2 percent more quickly than anticipated.
Committee Policy Actions
In their discussions of monetary policy for this meeting, members agreed that recent indicators suggested that economic activity had continued to expand at a solid pace. Labor market conditions had generally eased since earlier in the year, and the unemployment rate had moved up but remained low. Members concurred that inflation had made progress toward the Committee's 2 percent objective but remained somewhat elevated. Almost all members agreed that the risks to achieving the Committee's employment and inflation goals were roughly in balance. Members viewed the economic outlook as uncertain and agreed that they were attentive to the risks to both sides of the Committee's dual mandate.
In support of its goals, the Committee agreed to lower the target range for the federal funds rate by 25 basis points to 4-1/4 to 4-1/2 percent. One member voted against that decision, preferring to maintain the target range for the federal funds rate at 4-1/2 to 4-3/4 percent. In light of their judgment that, after this meeting, the Committee would likely slow the pace of further adjustments to the stance of monetary policy, members agreed to indicate that, in considering the extent and timing of additional adjustments to the target range for the federal funds rate, the Committee would carefully assess incoming data, the evolving outlook, and the balance of risks. Members agreed to continue to reduce the Federal Reserve's holdings of Treasury securities and agency debt and agency mortgage-backed securities. Members also judged that it was appropriate to make a technical adjustment to the rate offered at the ON RRP facility by setting it equal to the bottom of the target range for the federal funds rate, thereby bringing the rate back into an alignment that had existed when the facility was established as a monetary policy tool. All members agreed that the postmeeting statement should affirm their strong commitment both to supporting maximum employment and to returning inflation to the Committee's 2 percent objective.
Members agreed that, in assessing the appropriate stance of monetary policy, the Committee would continue to monitor the implications of incoming information for the economic outlook. They would be prepared to adjust the stance of monetary policy as appropriate if risks emerged that could impede the attainment of the Committee's goals. Members also agreed that their assessments would take into account a wide range of information, including readings on labor market conditions, inflation pressures and inflation expectations, and financial and international developments.
At the conclusion of the discussion, the Committee voted to direct the Federal Reserve Bank of New York, until instructed otherwise, to execute transactions in the System Open Market Account in accordance with the following domestic policy directive, for release at 2:00 p.m.:
"Effective December 19, 2024, the Federal Open Market Committee directs the Desk to:
- Undertake open market operations as necessary to maintain the federal funds rate in a target range of 4-1/4 to 4-1/2 percent.
- Conduct standing overnight repurchase agreement operations with a minimum bid rate of 4.5 percent and with an aggregate operation limit of $500 billion.
- Conduct standing overnight reverse repurchase agreement operations at an offering rate of 4.25 percent and with a per-counterparty limit of $160 billion per day. Setting this rate at the bottom of the target range for the federal funds rate is intended to support effective monetary policy implementation and the smooth functioning of short‑term funding markets.
- Roll over at auction the amount of principal payments from the Federal Reserve's holdings of Treasury securities maturing in each calendar month that exceeds a cap of $25 billion per month. Redeem Treasury coupon securities up to this monthly cap and Treasury bills to the extent that coupon principal payments are less than the monthly cap.
- Reinvest the amount of principal payments from the Federal Reserve's holdings of agency debt and agency mortgage‑backed securities (MBS) received in each calendar month that exceeds a cap of $35 billion per month into Treasury securities to roughly match the maturity composition of Treasury securities outstanding.
- Allow modest deviations from stated amounts for reinvestments, if needed for operational reasons.
- Engage in dollar roll and coupon swap transactions as necessary to facilitate settlement of the Federal Reserve's agency MBS transactions."
The vote also encompassed approval of the statement below for release at 2:00 p.m.:
"Recent indicators suggest that economic activity has continued to expand at a solid pace. Since earlier in the year, labor market conditions have generally eased, and the unemployment rate has moved up but remains low. Inflation has made progress toward the Committee's 2 percent objective but remains somewhat elevated.
The Committee seeks to achieve maximum employment and inflation at the rate of 2 percent over the longer run. The Committee judges that the risks to achieving its employment and inflation goals are roughly in balance. The economic outlook is uncertain, and the Committee is attentive to the risks to both sides of its dual mandate.
In support of its goals, the Committee decided to lower the target range for the federal funds rate by 1/4 percentage point to 4-1/4 to 4-1/2 percent. In considering the extent and timing of additional adjustments to the target range for the federal funds rate, the Committee will carefully assess incoming data, the evolving outlook, and the balance of risks. The Committee will continue reducing its holdings of Treasury securities and agency debt and agency mortgage‑backed securities. The Committee is strongly committed to supporting maximum employment and returning inflation to its 2 percent objective.
In assessing the appropriate stance of monetary policy, the Committee will continue to monitor the implications of incoming information for the economic outlook. The Committee would be prepared to adjust the stance of monetary policy as appropriate if risks emerge that could impede the attainment of the Committee's goals. The Committee's assessments will take into account a wide range of information, including readings on labor market conditions, inflation pressures and inflation expectations, and financial and international developments."
Voting for this action: Jerome H. Powell, John C. Williams, Thomas I. Barkin, Michael S. Barr, Raphael W. Bostic, Michelle W. Bowman, Lisa D. Cook, Mary C. Daly, Philip N. Jefferson, Adriana D. Kugler, and Christopher J. Waller.
Voting against this action: Beth M. Hammack.
President Hammack dissented because she preferred to maintain the target range for the federal funds rate at 4-1/2 to 4-3/4 percent, in light of uneven progress in returning inflation to 2 percent, the strength of the economy and the labor market, and the state of financial conditions. In her view, with the current federal funds rate not far from neutral, holding the funds rate at a modestly restrictive stance for a time was appropriate to ensure that inflation returns to 2 percent in a timely fashion.
Consistent with the Committee's decision to lower the target range for the federal funds rate to 4-1/4 to 4-1/2 percent, the Board of Governors of the Federal Reserve System voted unanimously to lower the interest rate paid on reserve balances to 4.4 percent, effective December 19, 2024. The Board of Governors of the Federal Reserve System voted unanimously to approve a 1/4 percentage point decrease in the primary credit rate to 4.5 percent, effective December 19, 2024.2
It was agreed that the next meeting of the Committee would be held on Tuesday–Wednesday, January 28–29, 2025. The meeting adjourned at 10:10 a.m. on December 18, 2024.
Notation Vote
By notation vote completed on November 25, 2024, the Committee unanimously approved the minutes of the Committee meeting held on November 6–7, 2024.
Attendance
Jerome H. Powell, Chair
John C. Williams, Vice Chair
Thomas I. Barkin
Michael S. Barr
Raphael W. Bostic
Michelle W. Bowman
Lisa D. Cook
Mary C. Daly
Beth M. Hammack
Philip N. Jefferson
Adriana D. Kugler
Christopher J. Waller
Susan M. Collins, Austan D. Goolsbee, Alberto G. Musalem, Jeffrey R. Schmid, and Sushmita Shukla, Alternate Members of the Committee
Patrick Harker, Neel Kashkari, and Lorie K. Logan, Presidents of the Federal Reserve Banks of Philadelphia, Minneapolis, and Dallas, respectively
Joshua Gallin, Secretary
Matthew M. Luecke, Deputy Secretary
Brian J. Bonis, Assistant Secretary
Michelle A. Smith, Assistant Secretary
Mark E. Van Der Weide, General Counsel
Richard Ostrander, Deputy General Counsel
Trevor A. Reeve, Economist
Stacey Tevlin, Economist
Beth Anne Wilson, Economist
Shaghil Ahmed, James A. Clouse, Brian M. Doyle, Edward S. Knotek II, David E. Lebow, Sylvain Leduc, and William Wascher, Associate Economists
Roberto Perli, Manager, System Open Market Account
Julie Ann Remache, Deputy Manager, System Open Market Account
Stephanie R. Aaronson, Senior Associate Director, Division of Research and Statistics, Board
Jose Acosta, Senior System Engineer II, Division of Information Technology, Board
Andrea Ajello, Section Chief, Division of Monetary Affairs, Board
David Altig, Executive Vice President, Federal Reserve Bank of Atlanta
Roc Armenter, Executive Vice President, Federal Reserve Bank of Philadelphia
Alyssa Arute,3 Assistant Director, Division of Reserve Bank Operations and Payment Systems, Board
Alessandro Barbarino, Special Adviser to the Board, Division of Board Members, Board
Michele Cavallo, Special Adviser to the Board, Division of Board Members, Board
Stephanie E. Curcuru, Deputy Director, Division of International Finance, Board
Riccardo DiCecio, Economic Policy Advisor, Federal Reserve Bank of St. Louis
Eric M. Engen, Senior Associate Director, Division of Research and Statistics, Board
Eric C. Engstrom, Associate Director, Division of Monetary Affairs, Board
Andrew Figura, Associate Director, Division of Research and Statistics, Board
Glenn Follette, Associate Director, Division of Research and Statistics, Board
Jenn Gallagher, Assistant to the Board, Division of Board Members, Board
Michael S. Gibson, Director, Division of Supervision and Regulation, Board
Joseph W. Gruber, Executive Vice President, Federal Reserve Bank of Kansas City
Christopher J. Gust,3 Associate Director, Division of Monetary Affairs, Board
James Hebden, Principal Economic Modeler, Division of Monetary Affairs, Board
François Henriquez, First Vice President, Federal Reserve Bank of St. Louis
Valerie S. Hinojosa, Section Chief, Division of Monetary Affairs, Board
Bart Hobijn, Senior Economist and Economic Advisor, Federal Reserve Bank of Chicago
Jane E. Ihrig, Special Adviser to the Board, Division of Board Members, Board
Jordan R. Keitelman,3 Senior Financial Institution Policy Analyst II, Division of Reserve Bank Operations and Payment Systems, Board
Michael T. Kiley, Deputy Director, Division of Financial Stability, Board
Don H. Kim, Senior Adviser, Division of Monetary Affairs, Board
Anna R. Kovner, Executive Vice President, Federal Reserve Bank of Richmond
Andreas Lehnert, Director, Division of Financial Stability, Board
Kurt F. Lewis, Special Adviser to the Chair, Division of Board Members, Board
Laura Lipscomb, Special Adviser to the Board, Division of Board Members, Board
David López-Salido, Senior Associate Director, Division of Monetary Affairs, Board
Dina Tavares Marchioni,3 Director of Money Markets, Federal Reserve Bank of New York
Jonathan P. McCarthy, Economic Research Advisor, Federal Reserve Bank of New York
Benjamin W. McDonough, Deputy Secretary and Ombudsman, Office of the Secretary, Board
Karel Mertens, Senior Vice President, Federal Reserve Bank of Dallas
Ann E. Misback, Secretary, Office of the Secretary, Board
Edward Nelson, Senior Adviser, Division of Monetary Affairs, Board
Alyssa O'Connor, Special Adviser to the Board, Division of Board Members, Board
Anna Orlik, Principal Economist, Division of Monetary Affairs, Board
Michael G. Palumbo, Senior Associate Director, Division of Research and Statistics, Board
Ander Perez-Orive, Principal Economist, Division of Monetary Affairs, Board
Eugenio P. Pinto, Special Adviser to the Board, Division of Board Members, Board
Albert Queralto,4 Section Chief, Division of International Finance, Board
Odelle Quisumbing,5 Assistant to the Secretary, Office of the Secretary, Board
Andrea Raffo, Senior Vice President, Federal Reserve Bank of Minneapolis
Denise L. Redfearn,6 Administrative Specialist, Office of the Secretary, Board
Achilles Sangster II, Lead Information Manager, Division of Monetary Affairs, Board
Shane M. Sherlund, Associate Director, Division of Research and Statistics, Board
Clara Vega, Special Adviser to the Board, Division of Board Members, Board
Min Wei, Senior Associate Director, Division of Monetary Affairs, Board
Randall A. Williams, Group Manager, Division of Monetary Affairs, Board
Paul R. Wood, Special Adviser to the Board, Division of Board Members, Board
Ines Xavier, Senior Economist, Division of Monetary Affairs, Board
Egon Zakrajsek, Executive Vice President, Federal Reserve Bank of Boston
_______________________
Joshua Gallin
Secretary
1. The Federal Open Market Committee is referenced as the "FOMC" and the "Committee" in these minutes; the Board of Governors of the Federal Reserve System is referenced as the "Board" in these minutes. Return to text
2. In taking this action, the Board approved requests to establish that rate submitted by the Board of Directors of the Federal Reserve Banks of Boston, New York, Philadelphia, Cleveland, Richmond, Atlanta, Chicago, and San Francisco. The vote also encompassed approval by the Board of Governors of the establishment of a 4.5 percent primary credit rate by the remaining Federal Reserve Banks, effective on December 19, 2024, or the date such Reserve Banks inform the Secretary of the Board of such a request. (Secretary's note: Subsequently, the Federal Reserve Banks of St. Louis, Minneapolis, Kansas City, and Dallas were informed of the Board's approval of their establishment of a primary credit rate of 4.5 percent, effective December 19, 2024.) Return to text
3. Attended through the discussion of developments in financial markets and open market operations. Return to text
4. Attended Tuesday's session only. Return to text
5. Attended through the discussion of the economic and financial situation. Return to text
6. Attended opening remarks for Tuesday session only. Return to text
Global Market Outlook 2025: Trends, Risks, and Opportunities for Traders
Global financial markets are preparing for an important year, 2025. Changes in currency markets and commodity prices will bring both challenges and opportunities for investors, traders, and market analysts. This detailed guide looks at five major themes that will shape the markets in 2025, providing useful insights to help you plan and make smart choices.
Emerging market currencies in 2025
Emerging markets have become increasingly popular for traders and investors, and emerging market currencies play a significant role in the global foreign exchange markets. This article examines the outlook for emerging market currencies in the first quarter of 2025.
Profit and risk dynamics
Currency traders always have to balance profit versus risk, and emerging markets have become attractive for investors with a high tolerance for risk. Trading in emerging market currencies offers the opportunity of higher returns than in developed markets, but the risk is higher than in more traditional markets. Emerging market currencies often experience sharp fluctuations, and traders and investors need to be prepared for sudden shifts in which the currency can drop sharply.
As a case in point, at the December 2024 policy meeting, the Federal Reserve surprised the market when it lowered its rate cut projection for 2025. The Fed said that it planned to cut rates just twice next year, down from four times in the September 2024 forecast. The US dollar posted sharp gains in reaction to the Fed forecast, and emerging currencies fell sharply. The Indian rupee and Brazilian real dropped to record lows, while the Indonesian rupiah dropped to a four-month low.
Will Q1 spell trouble for EM currencies?
The Fed’s plan to slow the pace of rate cuts in 2025 means that it might not cut at all in the first quarter, which would be bullish for the US dollar. In the words of one analyst, “the US dollar is king right now”, and that could spell trouble for emerging currencies in early 2025.
In addition to the Fed’s hawkishness in its rate plans, emerging markets also have to contend with the expected policies of the incoming Trump administration in January 2025. Trump has pledged new tariffs on US trading partners, which would hurt the export sectors of emerging market economies and likely send emerging market currencies lower against the US dollar.
Also, Trump has promised to cut taxes and further deregulation, which would boost US growth and likely boost the US dollar. If the Trump administration quickly enacts a protectionist trade policy, emerging markets could see a decline in exports, which would weaken their currencies.
Can emerging markets compete with the rising US stock market?
As we mentioned earlier, emerging currencies tend to show significant volatility, which presents the opportunity for profit but also carries a high degree of risk. In 2024, the US stock markets performed very well – the S&P 500 soared 25% and the Dow Jones climbed 14%. These handsome profits involved much less risk for investors than emerging market currencies, which could mean that investors will choose to park their funds in the US stock market rather than in risky emerging market currencies.
An important point to keep in mind is that in 2024, most of the major emerging market currencies lost value against the US dollar. This raises the interesting possibility that traders and investors of emerging market currencies might employ a strategy of shorting these currencies against the US dollar, which means that the trader would profit if the emerging market currency fell against the US dollar. Short selling is, however, a risky strategy, particularly in the case of emerging market currencies.
As we move into 2025, the outlook for emerging markets is not encouraging. The US dollar has looked very sharp in recent months, and the strong US economy shows no signs of slowing down. With the incoming Trump administration promising to slap tariffs on US trading partners and emerging market currencies struggling against the strong US dollar, emerging market currencies could lose ground in Q1 of 2025.
Precious Metals in 2025
Investors and market participants often turn to gold, silver, and platinum not only for diversification but also for stability during times of economic and geopolitical volatility. Here’s a closer look at the market outlook for these key commodities in 2025 given the volatile geopolitical climate globally.
Gold
Gold enters 2025 following a robust 2024 that saw prices rise nearly 28% due to central bank purchases and geopolitical tensions. Moving forward, prices may see moderate growth but face downward pressure from higher interest rates and a strengthening US dollar.
Demand Drivers
Central banks in Asia are expected to continue increasing gold reserves as a hedge against economic uncertainty.
Risks
Prolonged Federal Reserve monetary tightening could cap price growth.
Market Participants
Market participants should keep a close eye on Central Bank monetary policy. This coupled with potential geopolitical risks could be key to market moves in 2025.
Silver
Silver continues to benefit from the gap between actual demand and supply. Silver, valued both for industrial applications and as an investment, is also poised to benefit from the push for renewable energy, particularly solar technologies. However, weaker global manufacturing activity and a strong US dollar could introduce volatility and cap the potential gains for silver prices in 2025.
The chart below shows the discrepancy between silver supply and demand.
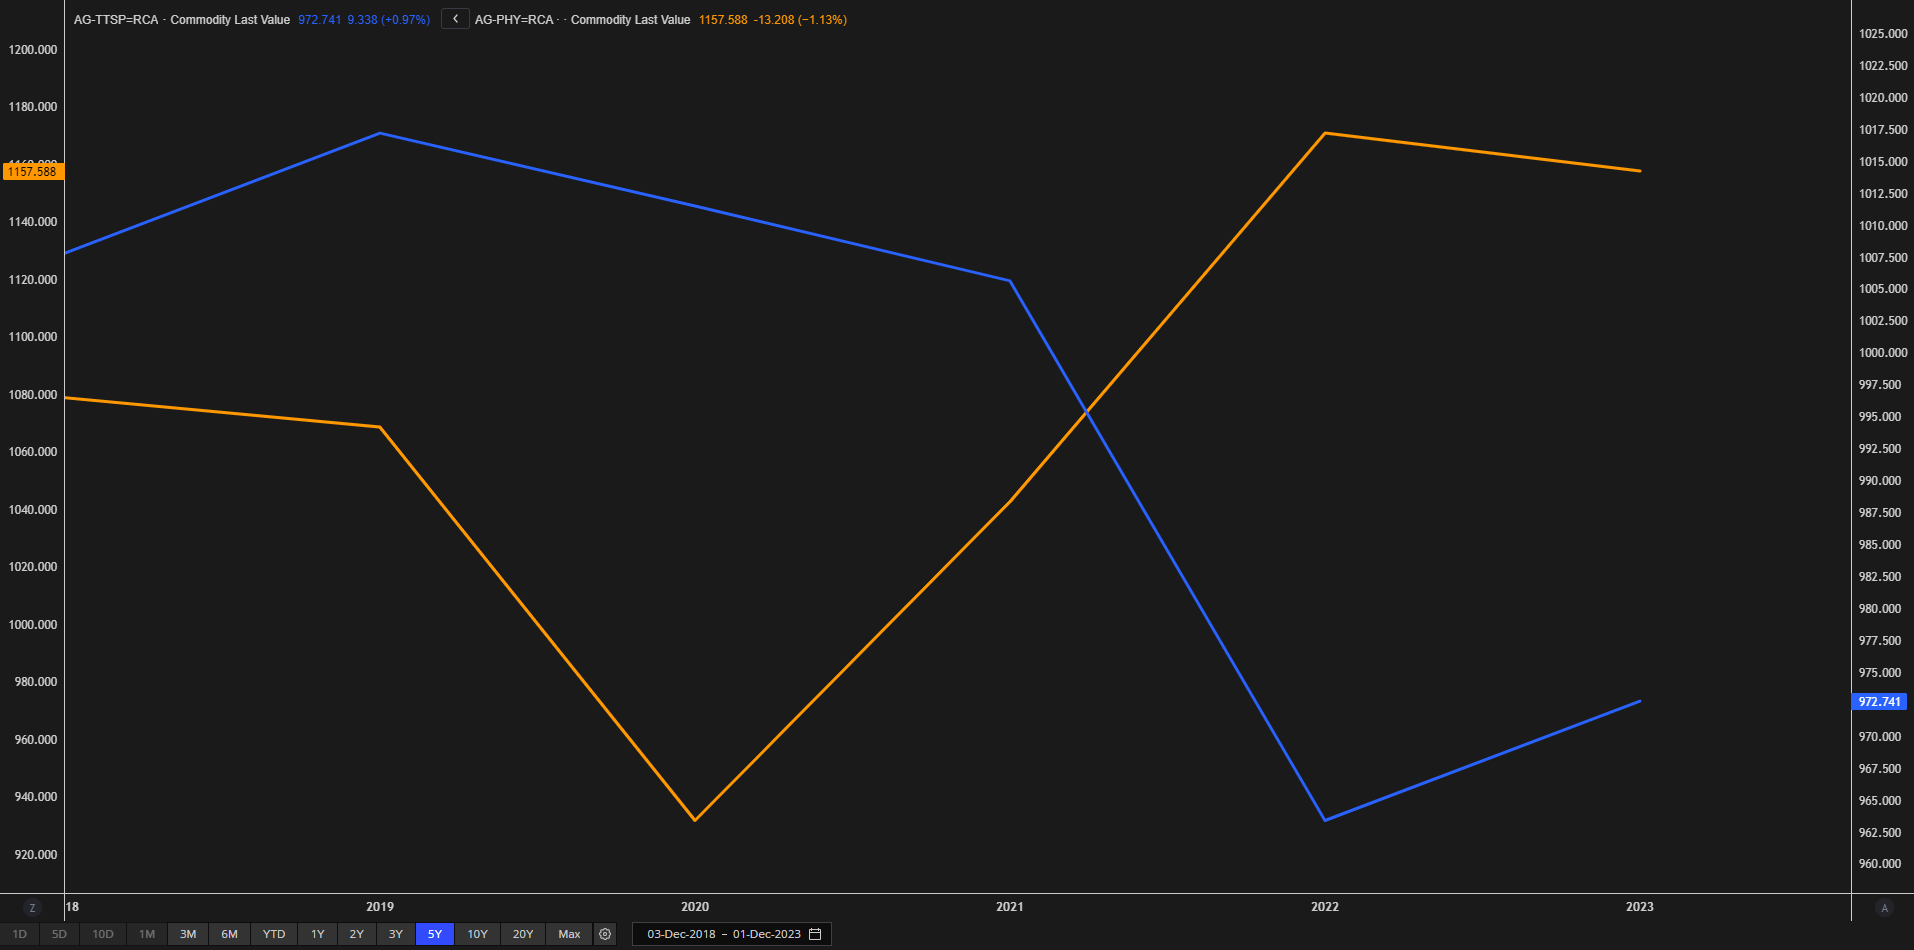
Source: LSEG. Supply Line – Blue. Demand Line – Orange (click to enlarge)
Key Areas to focus on
China and the economic recovery could be a good sign for silver prices, as this will likely lead to an increase in demand in 2025. Heightened demand, and the current supply available should, in theory, push silver prices higher.
US economy and its impact in 2025
The US economy will remain a focal point for global markets as inflationary trends, monetary policy, and fiscal changes shape the global trading environments.
The resurgence of the King Dollar may add downside pressure on the AUD and CNH
Incoming US President-elect Trump’s White House administration has already significantly impacted the financial markets even before Trump’s inauguration day on 20 January 2025 as the 47th president of the US.
Trump’s proposed deep cut on the corporation tax rate from 21% to 15% will likely further increase the US budget deficit. In addition, the proposed higher trade tariffs of 60% on Chinese products and the rest of the world’s exports to the US, ranging from 10% to 20% may also revive inflationary pressure in the US economy.
The net effect of Trump’s proposed policies is higher longer-term US Treasury yields, which the bond vigilantes have already responded to in the past four weeks.
The start of the current US Federal Reserve interest rate cut cycle on 18 September 2024 saw a jumbo 50 basis points (bps) cut on the Fed funds rate. In contrast, the longer-term 10-year US Treasury yield traded higher and rallied by 88 bps from its 17 September 2024 low of 3.60% to print a high of 4.47% on US presidential election day, 5 November 2024.
After a brief three weeks consolidation from 13 November to 2 December 2024, the impulsive upmove sequence of the 10-year US Treasury yield has resumed, and it staged a bullish breakout above a significant resistance of 4.49% that potentially eyes the 5.20% major resistance in the coming first quarter of 2025.
The latest bullish impetus of the 10-year US Treasury yield has been the 18 December 2024 FOMC monetary policy guidance, where the Fed has signalled a transition from a “dovish” pivot to a “normalization” pivot, that suggests a less dovish monetary policy in the US in 2025 with an impending risk of zero rate cuts due to the policies of Trumponomics 2.0 that may ignite inflationary pressure in the US.
The boomerang effects of Trumponomics 2.0 have triggered a stronger US dollar, which is apparent in the movement of the US dollar index, which added to its gains since the ongoing medium-term uptrend that has taken form since late September this year. It rallied by another 2.4% from the day of the US presidential election, 5 November to 12 November 2024.
Incoming hawkish relations toward China
According to various media reports, Trump is poised to pick two personnel with track records of harshly criticizing China for key positions in his administration, indicating that the current frosty state of US-China relations may deteriorate further.
Senator Macro Rubio who is being sanctioned by China is likely to be appointed as the Secretary of State. House Representative Mike Waltz, who has declared that the US was in a “Cold War with the Chinese Communist Party” in 2021 is set to become national security adviser.
Hence, it is likely that Trump, who is being surrounded by hawkish trade relations advisers, may follow through on his campaign trail with proposed trade policies of higher tariffs on Chinese products heading to the US in the coming year.
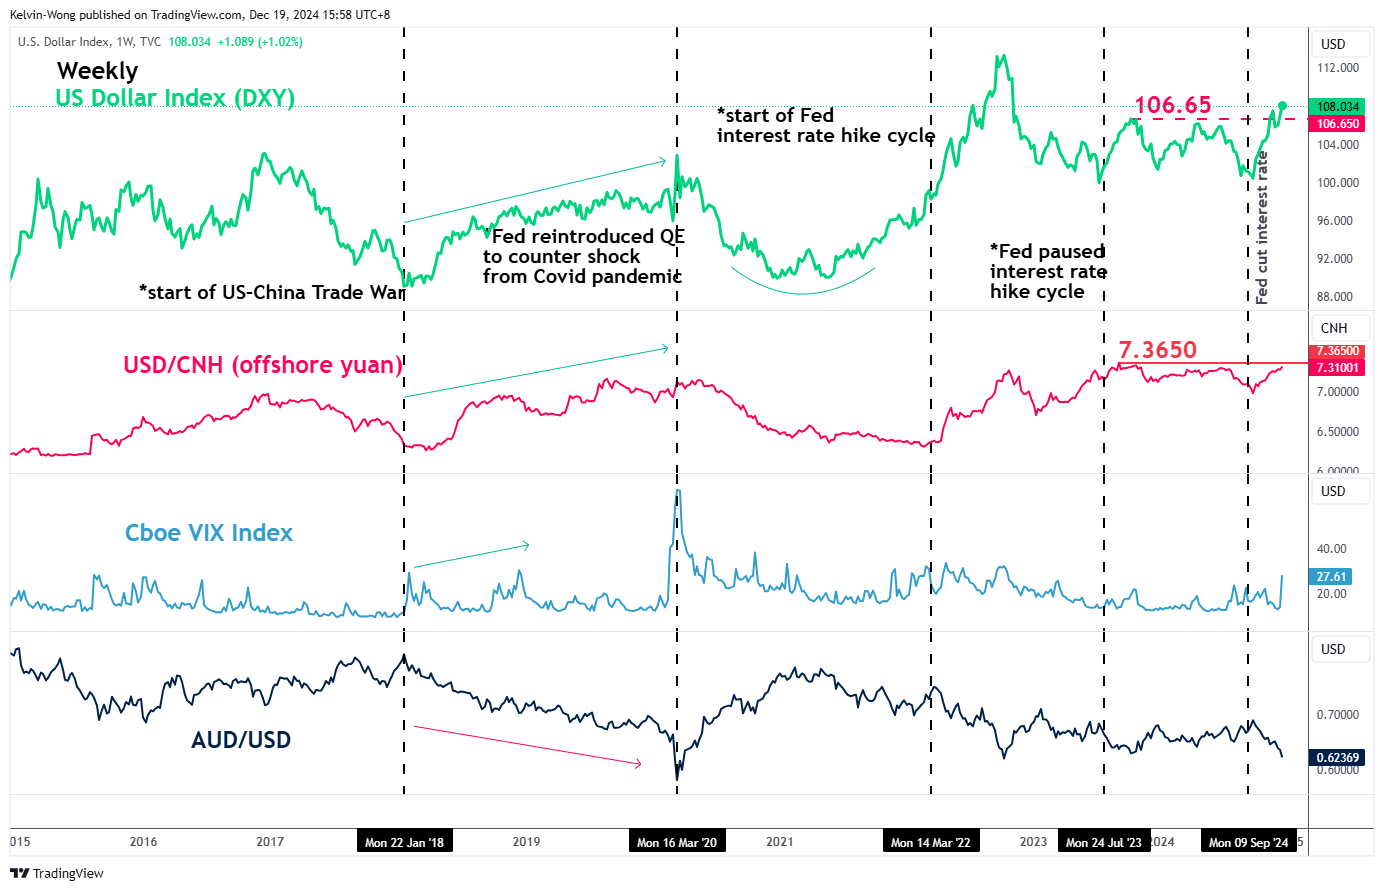
Fig 1: Major trends of US Dollar Index, USD/CNH, AUD/USD & VIX as of 19 Dec 2024 (Source: TradingView, click to enlarge chart). A weaker yuan is a headwind to AUD/USD
During Trump’s first administration in 2016, he kickstarted the US-China Trade War in January 2018 when China countered with retaliatory tariffs on US agriculture products and a deliberate weakening of the yuan against the US dollar.
It was the yuan weakness that triggered a significant negative feedback loop into the Aussie dollar. From the start of the US-China Trade War 1.0 in January 2018 to March 2020, the US dollar rallied against the offshore yuan (USD/CNH) by 12% (see Fig 1).
The high-beta Aussie dollar (AUD/USD) is also dependent on the economic growth prospect of China due to Australia being a major exporter of industrial commodities such as iron ore. Hence, a weaker yuan may see less demand for Australia’s iron ore, which in turn may put downside pressure on the AUD/USD.
The fear of such a negative feedback loop may resurface due to a potential US-China Trade War 2.0, and market participants have started to react accordingly.
The US dollar index has already staged a significant bullish breakout above a key resistance at 106.65 which reinforces a potential multi-month impulsive upmove sequence of US dollar strength.
Next up to watch is the 7.3650 key resistance on the USD/CNH. A clear break out above it may ignite a profound negative sentiment towards the AUD/USD.
Technical analysis of AUD/USD
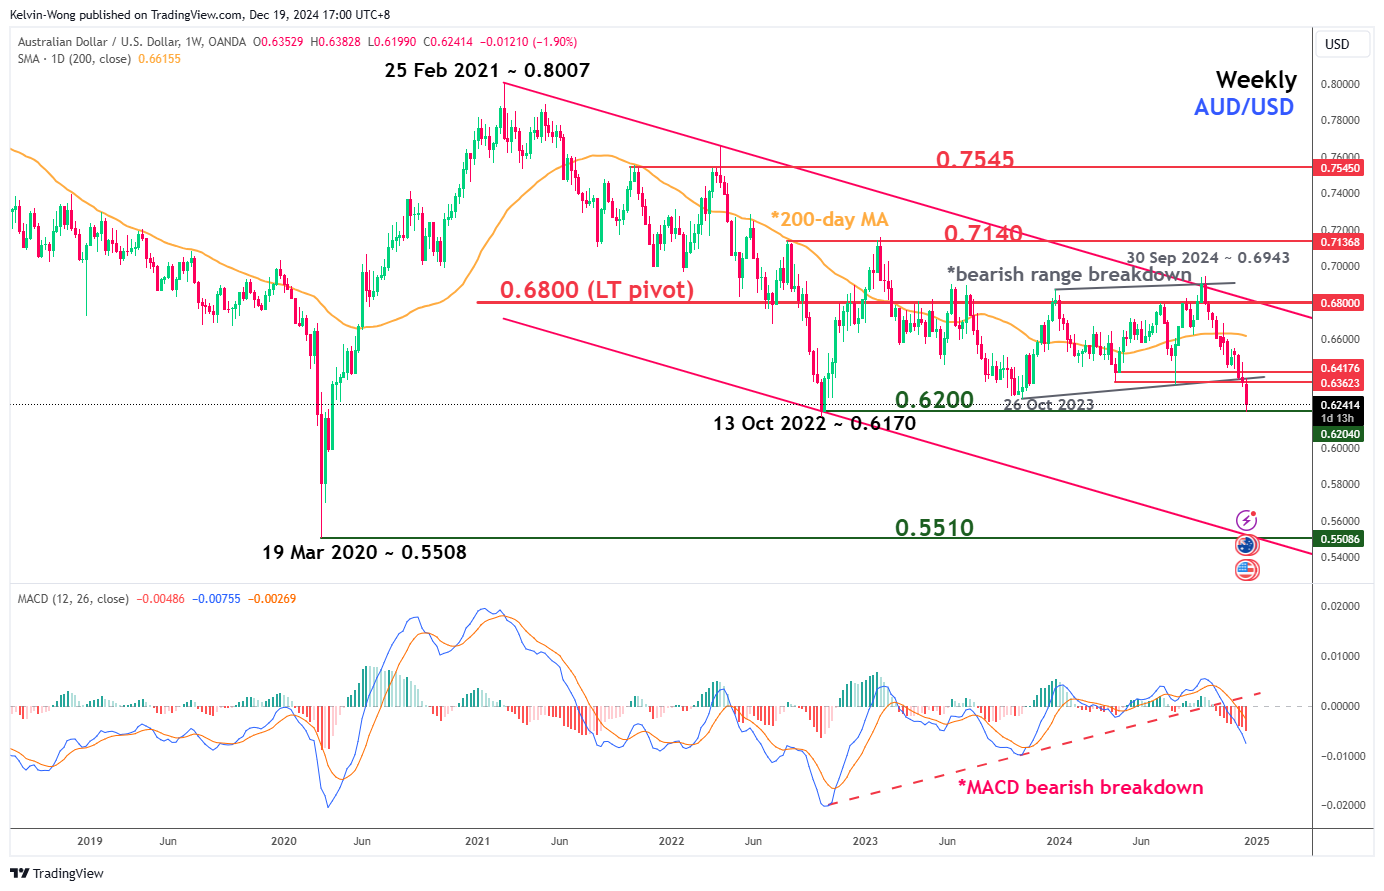
Fig 2: AUD/USD major trend as of 19 Dec 2024 (Source: TradingView, click to enlarge chart). Past performance is not indicative of future results.
The Aussie dollar has weakened dramatically against the US dollar since its 30 September 2024 high of 0.6943, where it tumbled by 10.7% to print an intraday low of 0.6200 on 19 December.
In the lens of technical analysis, the recent movement of the AUD/USD has exited a one-year-long sideways range consolidation since the 26 October 2023 low that is considered a major bearish breakdown below its former sideways range support of 0.6420/6360.
In addition, the weekly MACD trend indicator has continued to decelerate below its zero centreline after a prior bearish breakdown in the week of 11 November 2024 which suggests a potential entrenched major (multi-month) bearish trend is in place on the AUD/USD.
0.6800 key long-term pivotal resistance and a break with a weekly close below 0.6200 exposes the next major support of 0.5510 (see Fig 2).
On the flip side, a clearance above 0.6800 invalidates the bearish scenario to see the next major resistances coming in at 0.7140 and 0.7545.
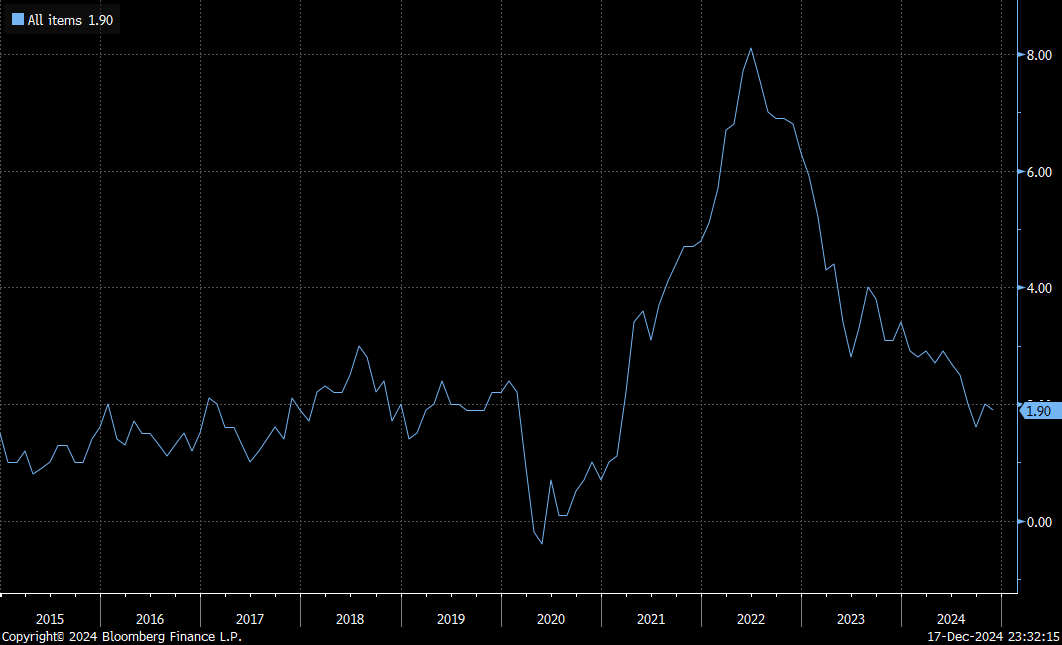
US inflation in 2024 and 2025 outlook
Traders in 2024 remained focused throughout the entire year on inflation data; the US CPI opened the year at 3.12%, and its latest reading for November 2024 was 2.74%, showing that the disinflation process continued in 2024; however, the decline was held back by the services component. The core services started the year at 3.12%, with its latest reading in November at 2.76%. The Shelter component, under Services, was the most stubborn inflation component and the slowest to decline, with minor improvements seen only in November 2024. Shelter costs kept inflation data high throughout 2024.
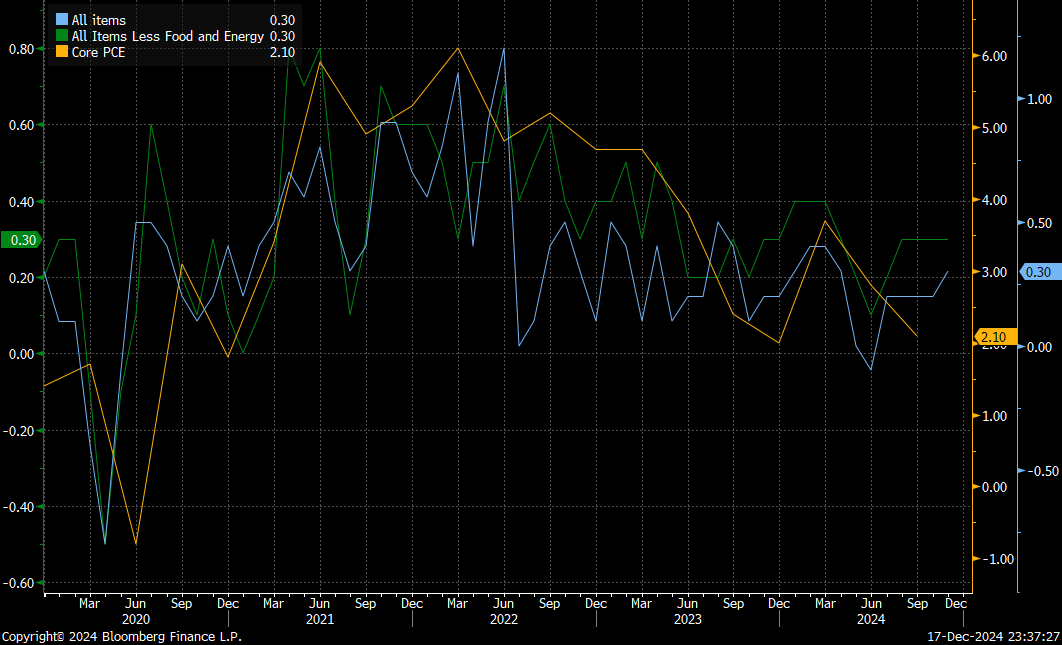
Source: Bloomberg terminal – US CPI – Core CPI – Core PCE. Past performance is not indicative of future results.
The FED’s preferred indicator, core PCE, also reflects the disinflation process. It shows that the services sector decline throughout 2024 was also minimal, as most components, including financial services, insurance, and healthcare, held steady levels throughout the year. The only contributors that showed improvement under PCE Services were food services, housing, and utilities.
According to Bloomberg’s analyst surveys, the disinflation process will resume slowly in 2025. Specific contributors, such as insurance and healthcare, are also forecasted to remain at their current levels and may increase. The US CPI is predicted to be at 2.4% in 2025, compared to its average of 2.9% in 2024. Meanwhile, Core PCE is forecasted to drop further in 2025 to 2.3% compared to its 2024 average of 2.8%.
Other risk factors may impact inflation in 2025. Following Donald Trump’s victory in the US elections, the threat of tariffs and trade wars became real. Following Trump’s announcement that he plans to impose a 25% tariff on Canada and Mexico, the Canadian dollar and the Mexican peso fell as traders reacted to the news. Although the price moves corrected after, the increase in the US dollar against the Canadian dollar took price action above critical levels, which was previously a challenge.
The Federal Reserve’s actions and interest rate outlook for 2025
The Federal Reserve has had a tough job over the past few years; it began with COVID when the FOMC cut rates back to its range of 0.25% to stimulate the economy, which was then in 2022 followed by 11 interest rate hikes to fight the historical high inflation that followed. The FOMC took interest rates back to 525 to 550 within 11 months. The Federal Reserve pivot came in December 2023 when Jerome Powell announced that the FED would pivot and assured the markets that the FED monetary policy decisions would be data dependent; the Fed has consistently mentioned that the committee is monitoring data closely and will take action when necessary.
In 2024, traders remained on edge as they monitored data and positioned themselves ahead of the Fed’s decision-making days throughout the year. At its September 2024 meeting, the FOMC cut interest rates by 50 basis points, the first cut since 2020. As we approach 2025, traders may need to pay more attention to the incoming economic data, tariffs, and significant fiscal policy changes. Unless there is an important event or change, markets should still see further rate cuts in 2025; however, the size and frequency of the cuts will be challenging to assess in 2025. So far, according to Bloomberg analyst’s surveys for 2025, markets are looking at an average of 3 interest rate cuts of 25 bps each in 2025, distributed almost evenly among the eight FOMC meetings scheduled in 2025. These projections and percentages will change as markets react to events and the incoming economic data.
Canada’s Economy and BOC’s Actions in 2024
Source: Bloomberg terminal – Canada CPI. Past performance is not indicative of future results.
The Canadian economy grew steadily in 2024 at an annualized rate of 2.1% in the second quarter of 2024, surpassing expectations of 1.8%. Growth was supported by lower-than-expected inflation and expectations for aggressive interest rate cuts by the Bank of Canada (BOC). However, the growth didn’t last and dropped sharply in the third quarter to an annualized rate of 1%, less than the 1.5% BOC estimate; the drop was mainly due to weakness in goods production. On June 5th, 2024, the Bank of Canada was the first major central bank to cut its interest rate by 25 basis points; the decision took place as inflation data continued to decline. BOC’s move came ahead of the Federal Reserve a day earlier than the European Central Bank.
Inflation in Canada declined sharply in 2024; all items CPI opened the year at 3.4% in January and 1.9% in November 2024. The shelter component of Canadian inflation includes rented and owned accommodation, water, fuel, and electricity. Higher interest rates and higher rent costs were key reasons for higher inflation since early 2021. Improvements were only seen in the first half of 2024 as BOC began its rate-cut cycle, which helped ease the cost of owned accommodation. However, the rented accommodation remained above its average. Higher demand for rental units can be attributed to higher immigration, which led to higher demand. Immigration has also impacted the Canadian job market as more participants join the labor force.
According to Bloomberg’s analyst surveys, the median expectation for Canada’s CPI Y/Y in 2025 is to remain steady near the BOC’s inflation rate target of 2.0%. The BOC’s interest rate cut path began gradually by cutting three times x 25 bps each, followed by two aggressive cuts of 50 bps each in October and November 2024, bringing interest rates down from 5% to 3.25%. The analysts’ surveys suggest that expectations remain mixed regarding rate cut frequency for 2025. However, the overall forecast sees an average of 2 – 3 further 25 bps cut in 2025, bringing the rates down between 2.5% – 3.0%, with the highest expectations for January 29th, 2025, and April 16th, 2025 meetings.
Technical analysis
EUR/USD weekly chart
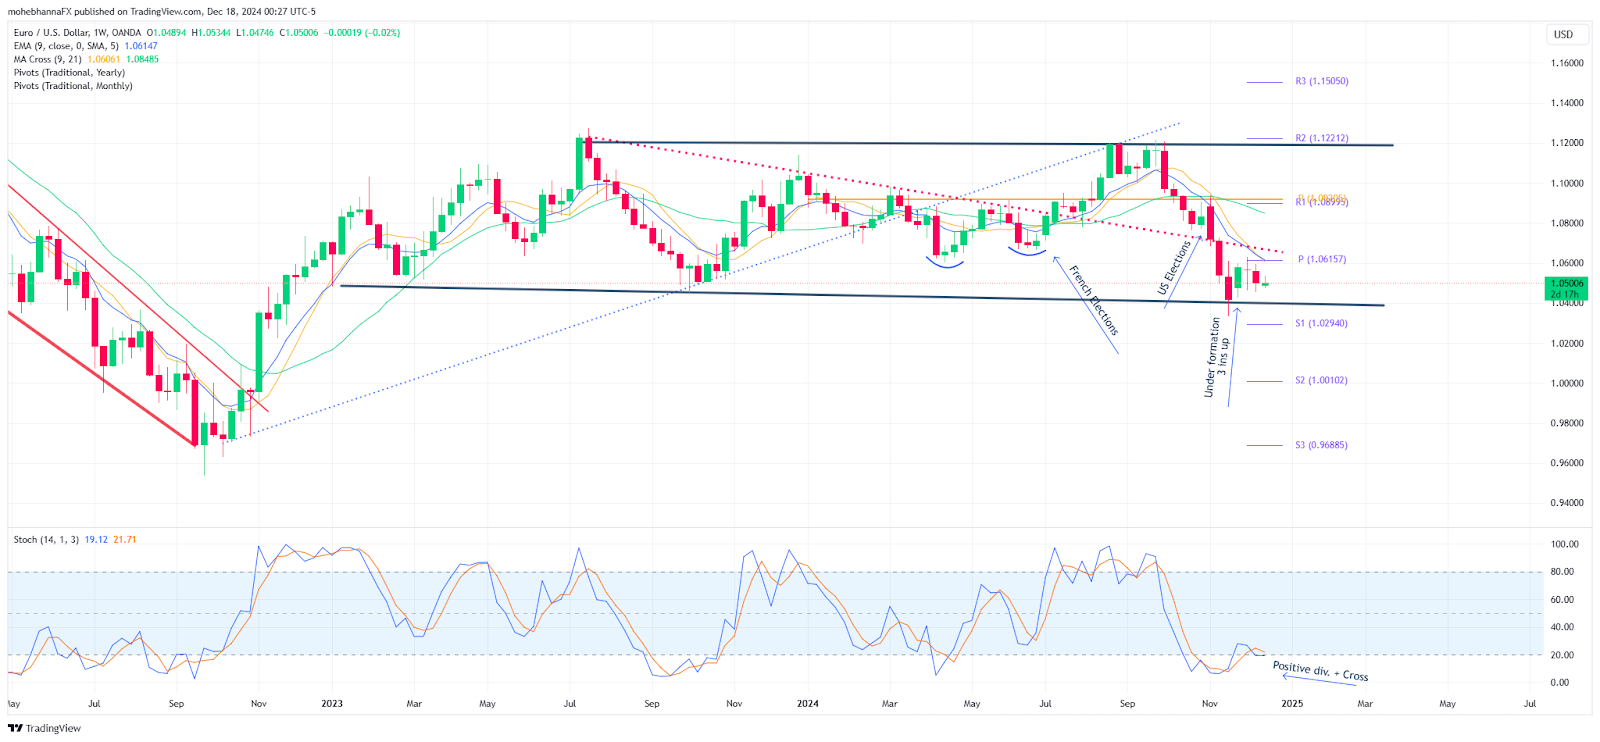
Source: Tradingview.com. Past performance is not indicative of future results.
The overall long-term chart context reflects a “Rising Wedge” formation for the downtrend, which began in mid-2021 (red line). Price action attempted to break below the lower pattern border several times, but this only worked during the US election week, when the exchange rate fell from 1.0920 to 1.0330. Price action has partially recovered and is near the 1.0500 area.
A confluence of resistance lies above price action near the 1.0615 area, represented by the intersection of a declining trendline extending from July 2023 (dotted red line), the intersection of the EMA9 and SMA9, and the monthly pivot point of 1.0615 standard calculations. Another resistance level lies above price action, represented by monthly R1 of 1.0899 and the annual PP of 1.0920.
For the past five weeks, the price has found support above the lower border of its trading range, marked by black lines. It attempted a “three inside up” candlestick pattern; however, the upside move has faded, as the price’s initial reaction following November’s NFP numbers release was short-lived.
The Stochastic Indicator aligns with price action, and the %K line is poised to cross above the %D line. The chart marks a positive divergence between the later part of the declining price action and the Stochastic.
USD/JPY Weekly Chart
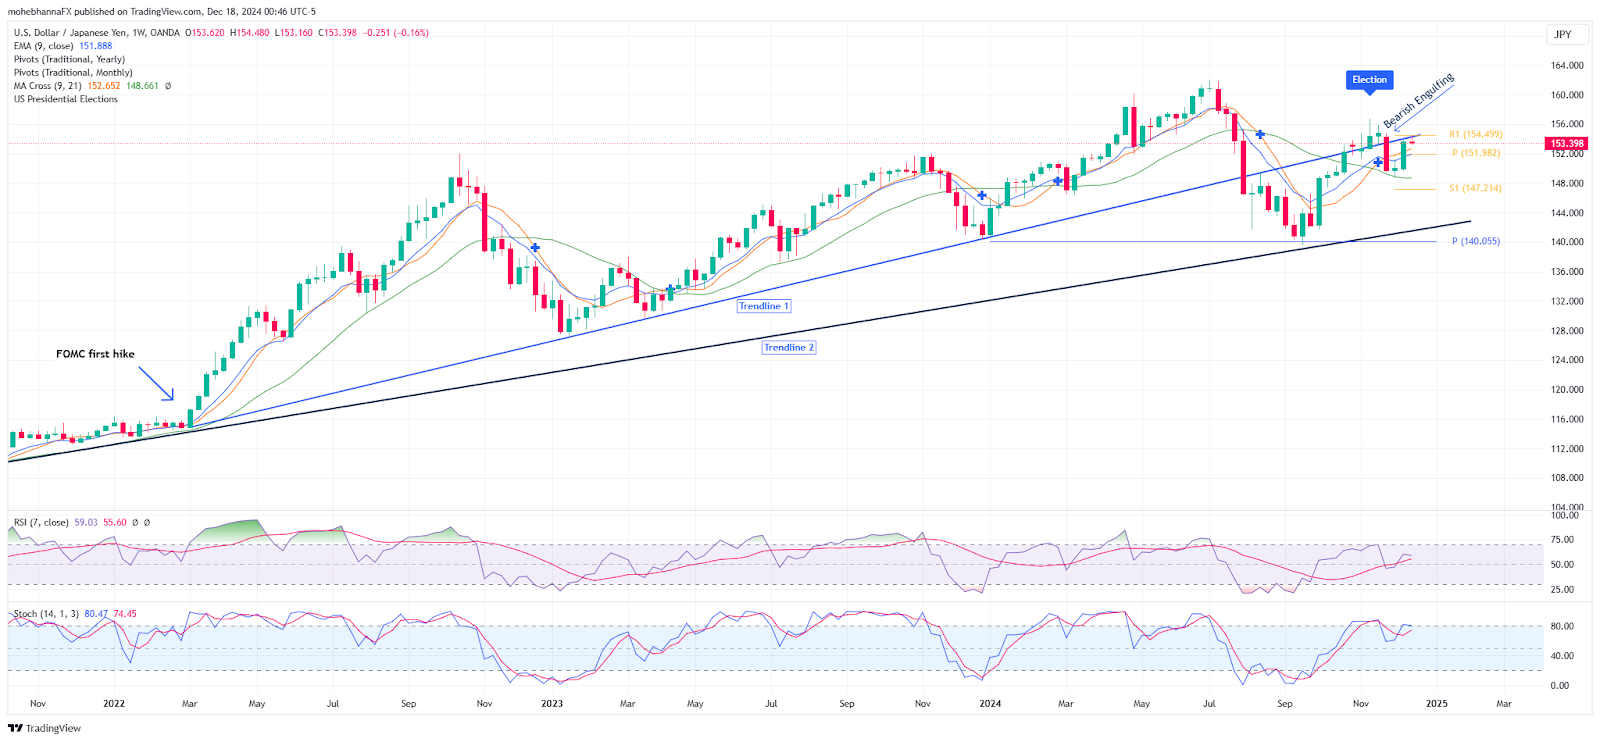
Source: Tradingview.com. EMA: Exponential Moving average – MA: Moving Average RSI: Relative Strength Index – % K: Fast Stochastic, %D Slow Stochastic MACD: Moving Average Convergence Divergence – Pivot Point: PP Support: S – Resistance: R
The overall context of the chart shows that price action has been trading in an uptrend since early 2022 when the Fed began raising interest rates. Trendlines 1 and 2 mark the uptrends on the chart.
Following the US elections, the US dollar rose against all other currencies, reaching a peak of 156.80. In the following weeks, it failed, breaking below trendline 1 and forming a bearish engulfing candle for the November 25th, 2024, weekly candle. It remained below the critical technical levels, the monthly PP of 151.98 and R1 of 154.49.
The US dollar attempted a rebound in early December, breaking and closing above the monthly PP of 151.98; however, it has yet to break back above the confluence of resistance near 154.49.
The price remains above two fast-moving averages, EMA9 and SMA9 below, and the intermediate moving average, SMA20.
Fast RSI (relative strength index) 7 aligns with price action, returning to a neutral level after reaching its overbought territory. The stochastic is in line with the price; the %K line is poised to cross below the %D line.
USD/CAD weekly chart
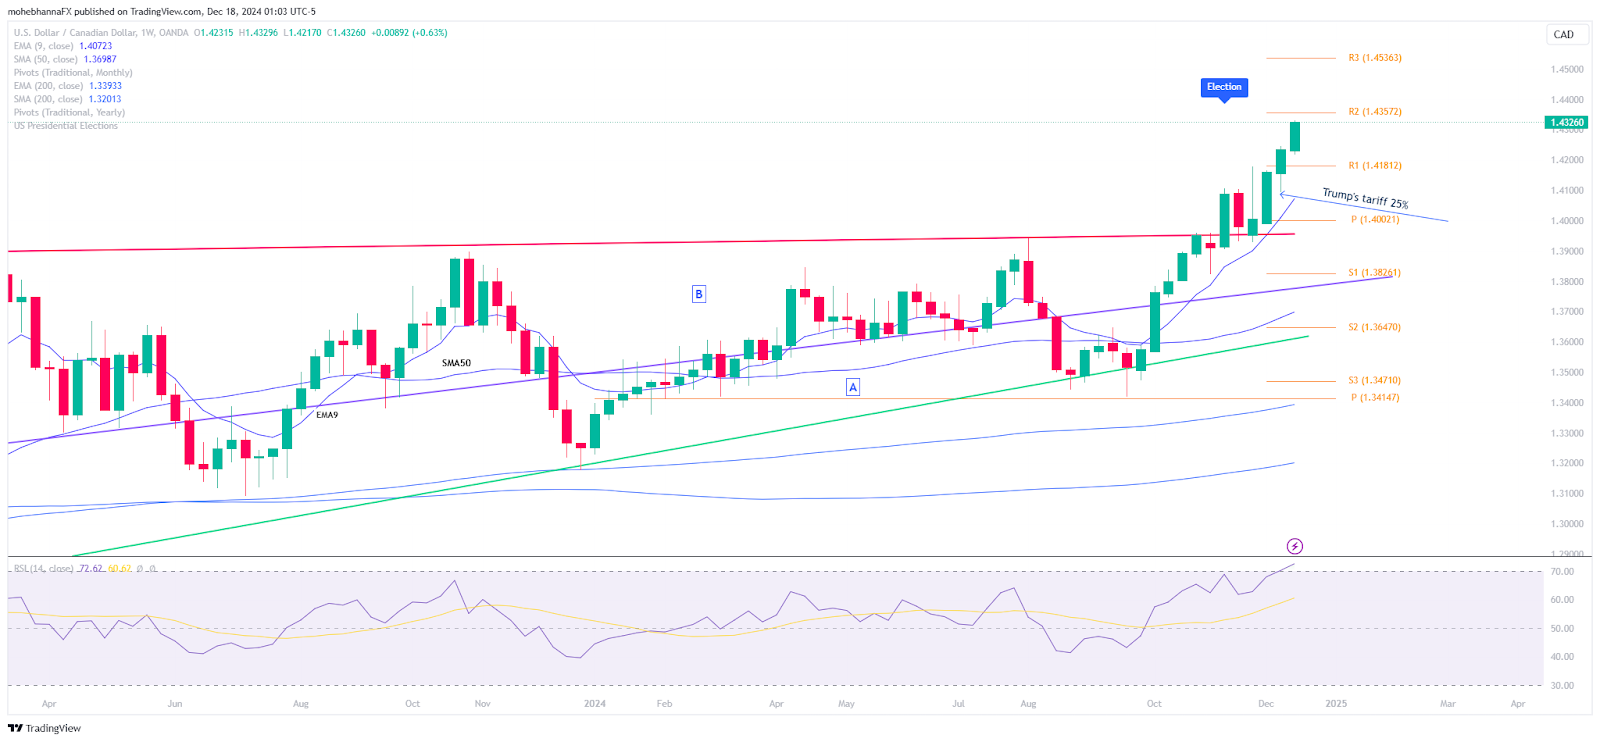
Source: Tradingview.com. Past performance is not indicative of future results.
USD/CAD has been trading within an ascending formation, as marked on the chart in Areas A and B. Price action traded around the median line (purple line) for an extended period, and the line acted as support and/or resistance on multiple occasions.
Following the US elections, price action rose, broke, and closed above the ascending formation’s upper border (red line). It has been trading above it as the US dollar remains dominant against major currencies.
Price action remains significantly above its monthly PP of 1.40002, the annual PP of 1.3414, EMA9, SMA50, EMA200, and SMA200.
Non-smoothed RSI (RSI 5 – Close) is in line with price action and is currently at its overbought levels.
Fed Minutes Confirm Expectations of Slower Pace of Rate Cuts in 2025
The minutes from the December 17-18th Federal Open Market Committee (FOMC) meeting released today confirmed that, while the committee still expects inflation to move toward 2 percent, there is greater concern than at the prior meeting that progress on inflation has stalled.
On the central question of inflation, "participants expected that inflation would continue to move toward 2 percent" but acknowledged that "the process could take longer than previously anticipated". Participants acknowledged the recent higher-than-expected readings on inflation, and some participants observed that the process of slowing inflation may have temporarily stalled. The possibility that potential changes in trade and immigration policy could affect inflation in the future was also noted.
Participants viewed recent labour market developments as consistent with a gradual easing in labour market conditions, and cited several indicators as supporting this assessment. Importantly, participants "generally noted, however, that there were no signs of rapid deterioration in labor market conditions" and observed that layoffs remained low.
On the policy decision, the minutes indicate that the decision to reduce interest rates was supported by a "vast majority" of participants. The majority of participants noted that their judgements in this meeting were "finely balanced", indicating this decision was a close call. Additionally, some participants felt there would have been merit in keeping target rate unchanged, and "suggested that the risk of persistently elevated inflation had increased in recent months".
When discussing the outlook for monetary policy, "participants indicated that the Committee was at or near the point at which it would be appropriate to slow the pace of policy easing". Since the beginning of this cycle of rate cuts, this is the first time we have seen such language in the FOMC minutes.
Key Implications
Today's minutes will serve to firm up market expectations for a slower pace of cuts in 2025. This is in line with our expectations of a rate cut every other meeting in 2025. The minutes reveal a fulsome discussion of recent developments in inflation, and a range of views around the risks to the inflation outlook and the interpretation of recent data. Contrast this with a comparatively brief discussion of the labour market, and general agreement that the labour market is not rapidly deteriorating, and it is no surprise the committee feels it is nearing a point at which rate cuts will slow.
Despite the committee's growing confidence that it can begin to reduce rates at a slower pace, it remains true that the only thing that is certain is uncertainty. Uncertainty about potential policy changes was a major discussion point for the participants, and all judged that there was elevated uncertainty regarding the scope, timing, and economic effects of potential changes to trade and immigration policy. Any firm policy decisions when the new administration takes office could alter the FOMC's current thinking, in either direction.
Sluggish Growth & Subdued Inflation Means More Bank of Canada Easing
Summary
- Canada's economy appears to have slowed noticeably in late 2024, and prospects are mixed as 2025 begins. The outlook for the household sector is somewhat resilient given firming growth in real incomes, and with interest costs set to decline further in the months ahead. In contrast, sentiment in the corporate sector remains downbeat, while declining profitability could also act as a headwind to business investment.
- Adding to this mixed outlook are increased uncertainties related to U.S. tariff policy and local politics. Our working assumption is that many U.S. imports from Canada may face a tariff of around 5% from the middle of this year. Prime Minister Trudeau's recent resignation should result in a period of uncertainty and transition, even if it eventually leads to a more stable government. These tariff and political uncertainties should offer further headwinds to exports and investment spending.
- Considering the mixed outlook and prevailing uncertainties, we forecast only a modest pickup in Canadian GDP growth to 1.7% in 2025 from an estimated 1.3% in 2024, with the risks tilted toward an even slower recovery.
- Combined with sub-trend growth, contained overall inflation should allow the Bank of Canada to keep lowering policy interest rates at the next several meetings. Domestically oriented inflation is starting to slow more noticeably and, while wages are still elevated relative to productivity, labor cost pressures are also easing.
- We expect the Bank of Canada to cut rates by 25 bps in January, March, April and June, taking the policy rate to 2.25%, which would be at the lower end of the perceived neutral policy rate range. Sluggish Canadian growth, lower Canadian interest rates, and cautious Federal Reserve easing is also likely in our view to keep the Canadian dollar broadly on the defensive over the medium term.
Canada's Mixed Outlook Means Slow Economic Recovery
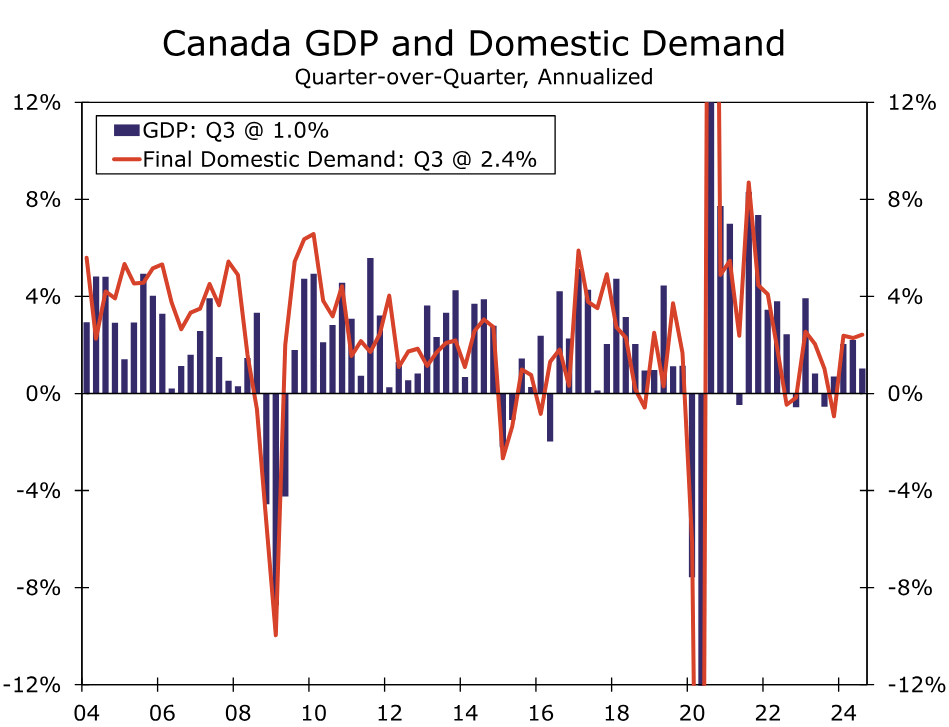
During the latter half of 2024 and leading into 2025, Canada's economic performance remained respectable, though decidedly mixed across sectors. This mixed performance was clearly reflected in the Q3 GDP outcome, which saw the overall economy grow by 1.0% quarter-over-quarter annualized, although final domestic demand did grow at a stronger 2.4% pace. However, even within the domestic economy there is a clear dichotomy, with the household sector relatively sturdy while the business outlook is somewhat clouded.
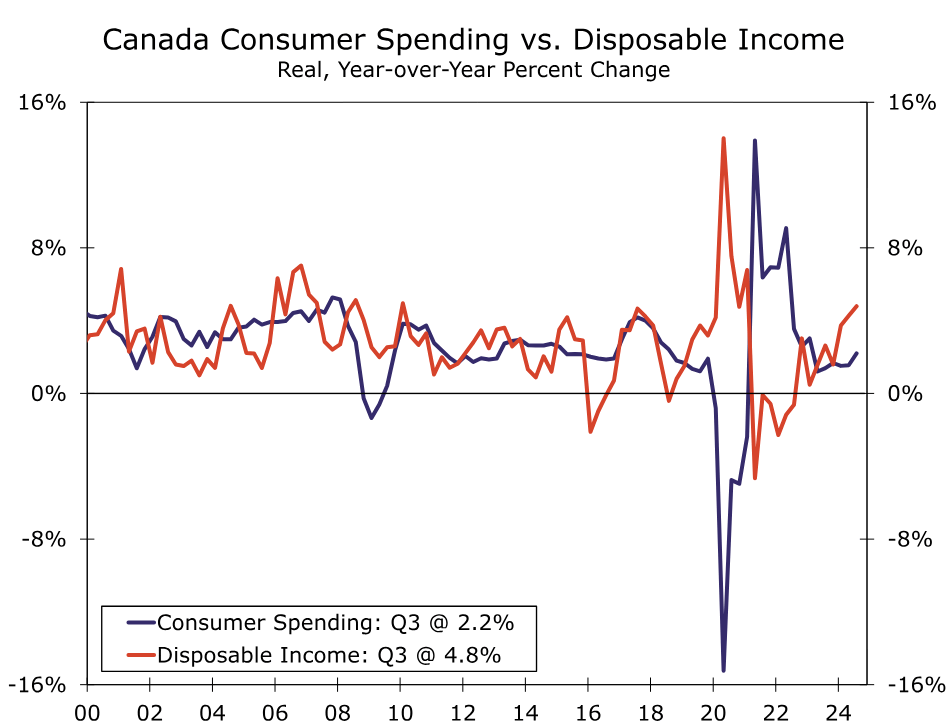
Looking first at the household sector, Q3 real consumer spending advanced at a 3.5% pace, while other consumer fundamentals also appeared to be supportive of continued spending, at least in the immediate quarters ahead. Real household disposable income rose 4.8% year-over-year in Q3, the strongest advance since a pandemic-related spike. The household saving rate rose further in Q3 to 7.1% of disposable income, which should offer something of a buffer against a spending downturn. Finally, while household debt servicing costs are still elevated, they have started to trend in a more favorable direction following a series of policy interest rate cuts from the Bank of Canada (BoC). Interest costs as a proportion of disposable income declined in the most recent quarter, while the overall debt service ratio (principal and interest) has fallen for the last three quarters in a row.
Recent monthly indicators also point to reasonably solid trends in household related activity. From a broader perspective employment trends remain quite solid—including a November employment gain of 50,500—although on the flip-side, the unemployment rate has risen and wage growth has started to slow. Real retail sales were unchanged in October but, following a large September increase, that still leaves the level of October sales 1.1% above its Q3 average. Housing activity also appears to be stabilizing, with housing starts jumping in November and housing permits falling modestly in October; new home prices have also stopped declining. Given the early signs of stabilization and amid a backdrop of falling interest rates, our outlook is for a moderate rebound in housing activity in 2025.
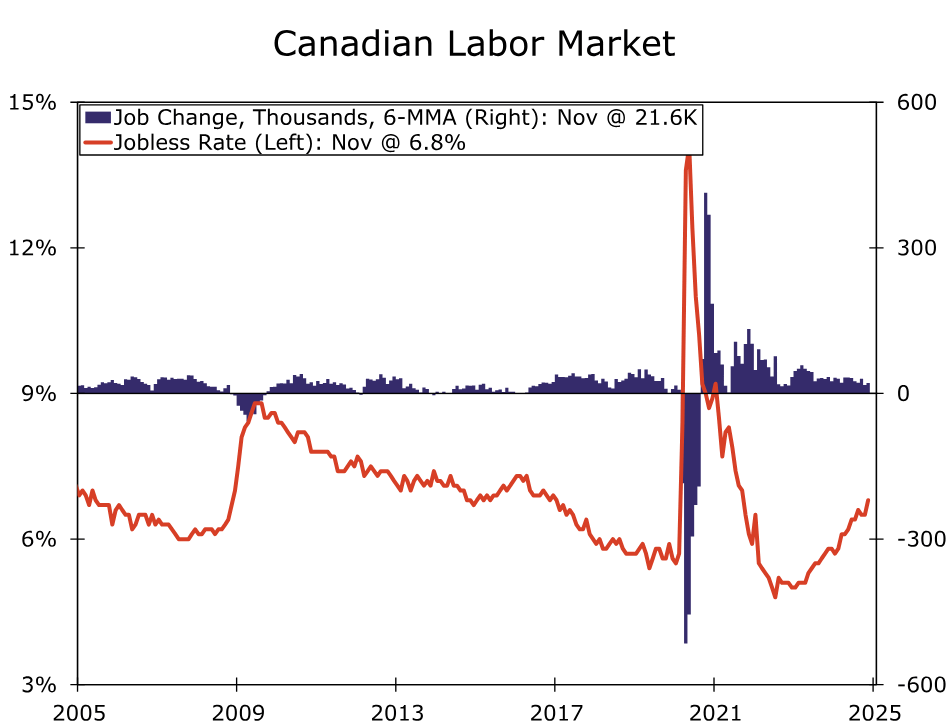
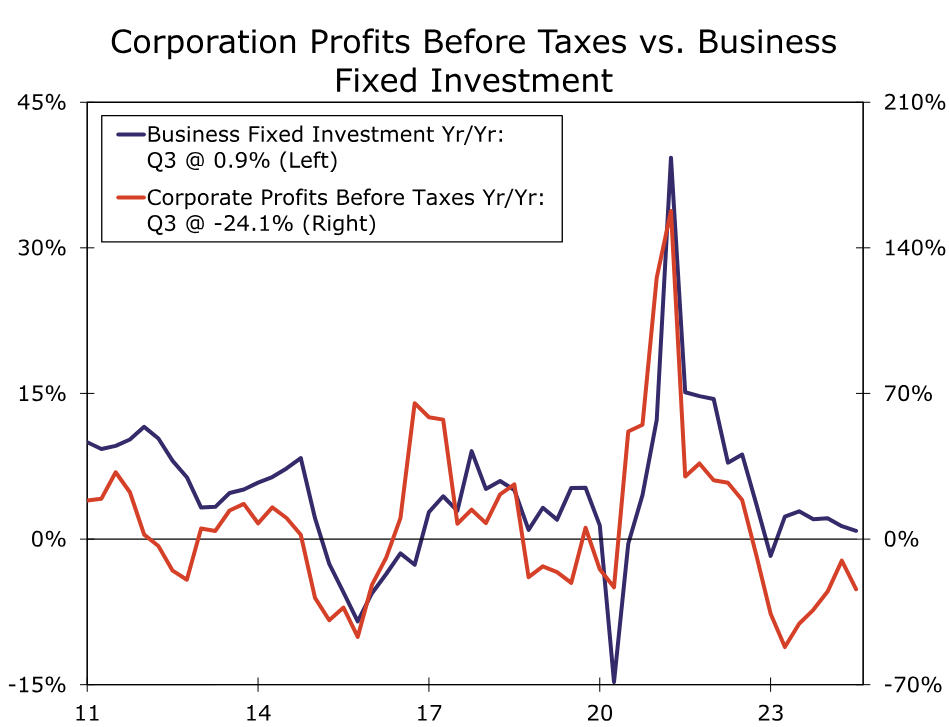
In contrast to the reasonably steady outlook for the household sector, the outlook for the corporate sector remains clouded. Business sentiment remains downbeat, as reflected in the BoC's Q3 Business Outlook Indicator, which at -2.31 remained in negative territory for the seventh quarter in a row. Canada's December services PMI fell to 48.2, slipping below the breakeven 50 level for the first time in three months, another sign of subdued sentiment. Declining corporate profits could also continue to act as a restraint on business fixed investment, which shrank by 3.6% quarter-over-quarter annualized in Q3. To the extent that an uncertain business environment leads to a slowing in employment growth, that could also act as another headwind to overall economic activity.
Tariff and Political Uncertainties Increasing
This rather mixed outlook takes shape, in our view, prior to even considering key risks to the Canadian economy, the most prominent of which is the threat of tariffs from the United States. During the U.S. election campaign, President-elect Trump proposed a 60% tariff on all imported goods from China, as well as an across-the-board 10% tariff on goods imported from all other countries. Separately and more recently, Trump floated a 25% tariff on imports from Canada and Mexico, citing concerns around the flow of illegal drugs and undocumented immigration into the United States. While we don't think all of these tariffs will go into effect, we doubt Canada will fully avoid tariffs either. For now, our working assumption is that around half of Trump's initially proposed tariffs will go into effect around the middle of 2025, which would equate to approximately a 5% tariff on imports from Canada from the middle of the year.
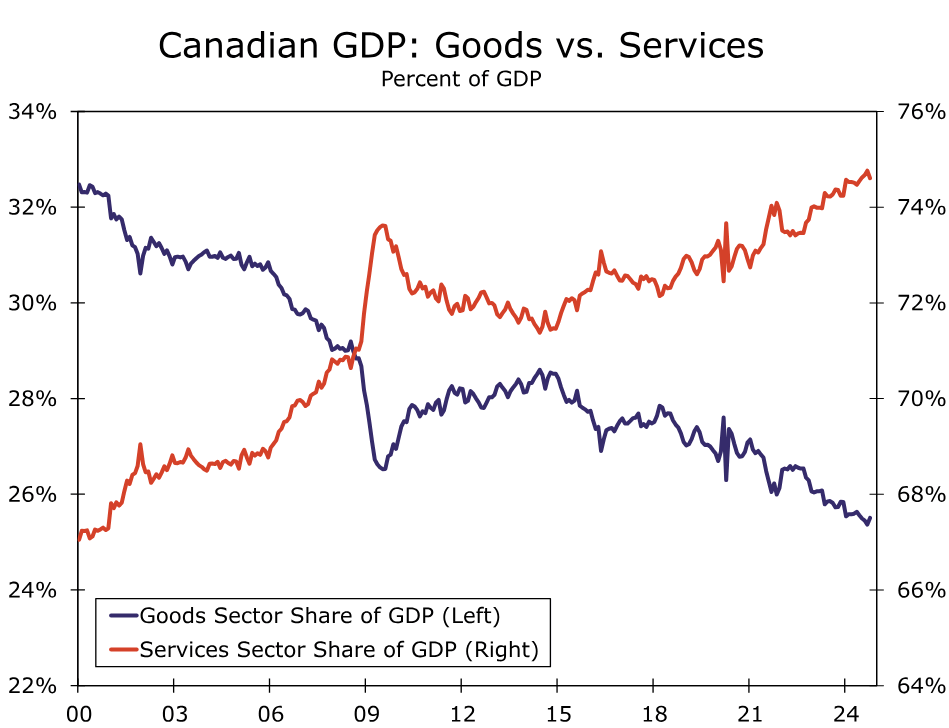
To some extent, the shifting composition of the Canadian economy since the turn of the century could mitigate the negative impact on Canadian growth. The goods sector currently accounts for 25% of the economy, down from around 32% in 2000. Over the same period, the service sector's share of the economy has risen to around 75%, from 67%.Even with this shift, however, Canada's exposure to the U.S. economy is still sizable, with around 76% of total merchandise exports destined for the United States. And perhaps except for energy—which accounts for around a quarter of Canada's merchandise exports—most other Canadian export categories appear to be candidates for the imposition of tariffs. Should tariffs go into effect as we expect, the negative impact on exports and business investment would act as a potential further headwind to economic growth.
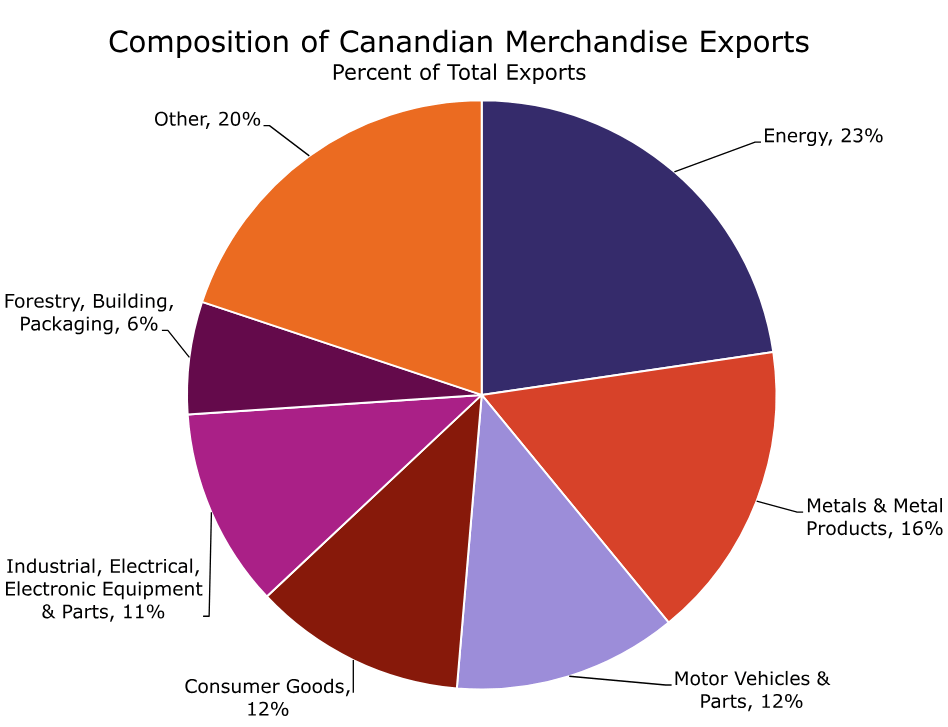
Finally, the Canadian political backdrop has also become more unsettled. In recent days, Prime Minister Justin Trudeau announced his resignation as leader of the Liberal Party, a development precipitated by events including the resignation of previous finance minister Chrystia Freeland. In this more unsettled environment, New Democratic Party leader Jagmeet Singh said his party would now support a vote of no-confidence in the government. Combined with similar support from the other main opposition parties, the Conservative Party and Bloc Quebecois, that would be enough for a no-confidence motion to succeed. Trudeau will remain in charge until a new Liberal Party leader (who will become Prime Minister) is selected, which will probably occur some time in March; however, an election is likely to take place shortly after. The main opposition party, the Conservative Party led by Pierre Poilievre, currently holds a huge lead in political opinion polls, which would also very likely translate into a majority government. Ultimately, recent developments could lead to a more stable government, and the Canadian dollar's reaction to the Trudeau resignation announcement was initially positive. That said, it's not clear to us that a new leader (or party) will be more effective in dealing with the tariff threat from the United States, and there will by necessity be a period of uncertainty during a transition to a new government. Overall, taking into account mixed economic trends, as well as tariff and political-related uncertainties, we see only a very modest rebound in Canada's economy this year. After estimated GDP growth of 1.3% in 2024, we expect GDP growth of just 1.7% in both 2025 and 2026, and moreover, we view risks as tilted to an even slower rebound in activity.
Contained Inflation Means Continued Bank of Canada Easing
Combined with our forecast for sub-trend economic growth, we believe contained overall inflation trends will allow the Bank of Canada to keep lowering policy interest rates at the next several meetings. With that said, we believe more steady 25 bps increments rather than the 50 bps moves seen at recent meetings are more likely. To be sure, Canadian inflation has ticked slightly higher in recent months. As of November, the headline CPI was running at 1.9% year-over-year, close to the central bank's 2% inflation target, while the average core CPI was running at 2.7%, moderately above the inflation target. Within the details, however, there were some favorable dynamics. As examples, November shelter inflation slowed to 4.6%, and broader services inflation also eased to 3.5%. Other indicators also point to a further moderation of domestically-oriented inflation pressures in the months ahead. In the latest labor market report for November, hourly wages for permanent employees slowed more than forecast to 3.9% year-over-year. And while not as current, the details from Canada's quarterly productivity and cost measures also point some moderation of labor cost pressures. For the latest data for Q3-2024, compensation per hour rose 3.2% year-over-year while unit labor costs rose 3.3% year-over-year. Overall, while wage growth is still somewhat elevated relative to productivity, it is clearly moderating, a slowing trend that should be reinforced by to ongoing rise in the unemployment rate and loosening of the labor market.
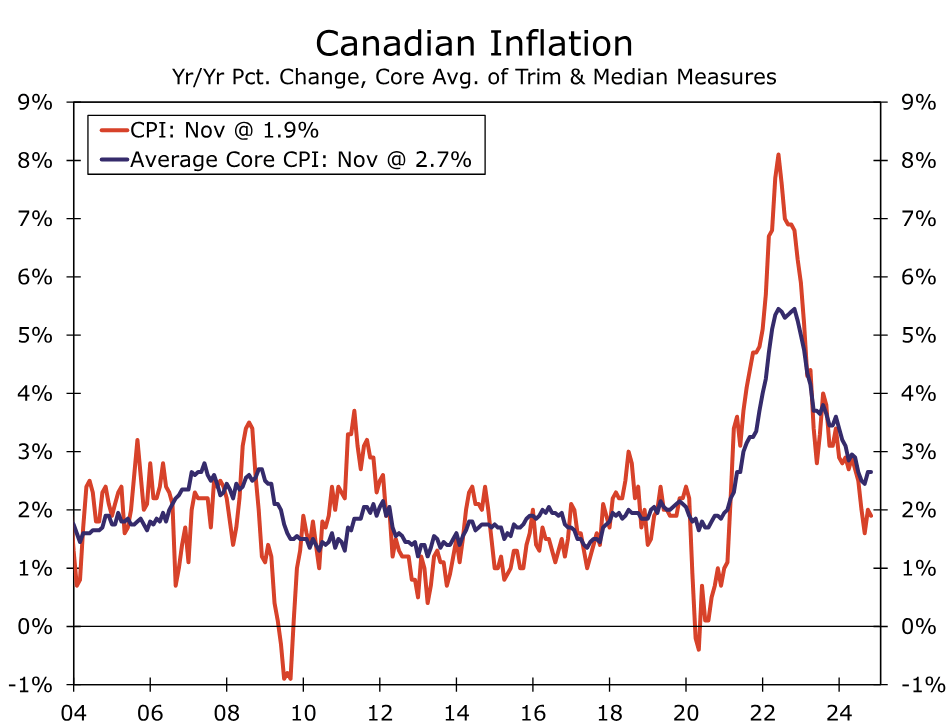
Taken together, we believe sub-trend economic growth, along with a moderation in domestic inflation and wage trends, will provide the Bank of Canada with the motivation—and the comfort—to continue easing monetary policy in the months ahead. With the current policy rate of 3.25% now at the upper end of the 2.25% to 3.25% range viewed as “neutral” by central bank policymakers, monetary policy is no longer seen as being in clearly restrictive territory. As a result, we expect the BoC to revert to 25 bps rate cuts at the meetings ahead, following 50 bps reductions at the October and December announcements. Still, given sub-trend growth and well-behaved inflation we anticipate the policy rate being reduced to the lower end of that neutral range. Accordingly, we expect the Bank of Canada to lower its policy rate by 25 bps at its January, March, April and June meetings, which would see the policy rate reach 2.25% by the middle of this year. That forecast is slightly lower than the policy rate trough we previously forecast (2.50%) and also well below our forecast trough for the fed funds rate, to a range of 3.50%-3.75%. Sluggish Canadian growth, lower Canadian interest rates, and cautious Federal Reserve easing should in our view keep the Canadian dollar broadly on the defensive over time. We remain comfortable with our forecast for the USD/CAD exchange rate to reach CAD1.5000 by early 2026.
Dollar Index (DXY) Forecasting the Rally After 3 Waves Pull Back
In this technical article we’re going to take a quick look at the Elliott Wave charts of Dollar Index DXY , published in members area of the website. As our members know, Dollar is still trading within the cycle from the September’s low. Recently, we saw a 3-wave pullback, followed by a solid rally as expected. In the further text, we are going to explain the wave count.
DXY H1 New York 01.06.2025
The current view suggests that the Dollar Index completed a 3-wave pullback from the peak, ending at the 107.751 low and labeled as wave ((ii)) blue. A sharp rally followed from this low, appearing impulsive. We have labeled this short-term cycle as wave i red, indicating the start of a new bullish cycle. A 3-wave pullback in wave ii red is anticipated before the rally resumes. We expect the Dollar Index to continue finding intraday sellers in 3, 7, and 11 swings
DXY H1 New York Update 01.07.2025
We saw a 3-wave pullback in ii red, followed by a move up. The key level is 107.751. While the price stays above it, we expect more rally in the Dollar Index, ideally towards new highs. A break above the previous peak ((i)) black will confirm that wave ((iii)) is in progress.
DXY H1 New York Update 01.08.2025
The 107.751 low held as expected, and the price moved higher. We got a decent rally in Dollar index. The price is now approaching the previous peak, and we are looking for a break above wave ((i)) black to confirm further strength.
Sunset Market Commentary
Markets
With or without data, global bond markets stay under pressure. In particular for the long end of the curve, comments often mentioned ‘The highest level since….’. The UK was again hit the hardest, with yields rising between 12 bps (10-y) and 6.5 bps (2-y). A high financing need as the government wants to roll out its growth supportive agenda and inflation holding too high for the BoE comfortably start a genuine easing cycle, dents investors’ appetite to pick-up gilts even at current ‘historically high’ returns. Yesterday, the UK 30-y forced a break higher touching the highest level since 1998. Today, the 10-y (tentatively?) develops a similar pattern reaching levels not seen since July 2008 (4.80% area). German November retail sales (-0.6% M/M) and even more factory orders (-5.4% vs -0.2% expected) again disappointed as did EMU economic confidence. Even so, it also didn’t help European bonds. German yields add between 5.0 bps (30-y) and 1.2 bps (2-y). The 7 bps rise in the 10-y yield was partially due to a benchmark change. Even, the 10-y German yield easily cleared the 2.5% resistance (November top). US curve steepening also continues, admittedly at a slower pace (30-y +4.0 bps, 2-y minus 0.5 bp). Eco data were mixed. ADP private job growth was slightly softer than expected (122k from 146k) but weekly jobless claims stay low (201k from 211k) and suggest ongoing labour market resilience. US bond markets got some relief from comments by influential Fed governor Waller. He expects inflation to slow further allowing the Fed to reduce rates further as 2025 proceeds. He also downplayed the idea that higher import tariffs will profoundly change the picture going forward. Still, the US 10-y is closing in on the 4.73% level (April 2024 top), the last technical hurdle before the 5.02% cycle top (Oct 2023). Investors later today for sure will scrutinize the internal debate within the Fed in the December meeting minutes. The $22 bln sale of 30-y US government month also will be more than closely watched with little room for disappointment. The ongoing rise in yields initially also triggered further equity sales before investors took some comfort for the Waller comments (S&P 500 little changed, Eurostoxx 50 -0.6%).
Rising (relative) interest rates support doesn’t help the likes of the euro or sterling. In current high alert modus, higher yields are seen as risk premia and allow the dollar to attracted safe haven flows. DXY rebounded from the 108.7 area to currently trade near 109.11. After briefly regaining 1.04 yesterday, EUR/USD again trades near 1.03. Despite (or is it because) higher yields, sterling also underperforms the single currency (EUR/GBP 0.834 from 0.829).
News & Views
Swedish inflation undershot expectations for December. Headline prices (using a fixed mortgage rate) rose by 0.3% to 1.5%, marking a faster deceleration from November’s 1.8% than the 1.7% expected. The core gauge (excluding energy) also eased a bit more than expected, from 2.4% to 2.1% y/y on a 0.4% monthly pace. Today’s numbers put little in the way for the central bank to further cut the policy rate (2.5%) during the January 29 meeting. The Riksbank at the December one flagged it would do so “in the first half of 2025”. It tweaked guidance somewhat to hint that this might be the final one this cycle, citing the lagged effects of monetary policy on the economy and inflation. The updated forecasts told a similar story with a 2.25% policy rate penciled in over the horizon through 2027. Money markets never really bought into the story though and in the meantime have priced in at least two more 25 bps cuts by May this year. Given the already more aggressive positioning compared to Riksbank guidance, markets for now do not push it further just yet. This also meant the SEK barely budged on the CPI miss. EUR/SEK moves around 11.5.
The ECB in an Economic Bulletin article published today offered (part of) the explanation why the consumption-led rebound it has been predicting for some time now is not yet materializing. It said that euro zone households have been saving a large portion of their income to rebuild wealth after being eroded by inflation the last couple of years. Real net wealth has declined the past two years, the ECB said. Latest data available showed families saving 15.7% of their disposable income (Q2 2024) compared to 12-13% prior to the pandemic. The result are ever-growing piles of savings. The central bank nevertheless continues to expect consumption to eventually relive , with a “likely downtick in the saving rate together with continued strong growth in real labour income” to help momentum.