
Sample Category Title
Gold (XAUUSD): Elliott Wave Analysis Predicts the Decline from Extreme Zone
In this technical article we’re going to take a quick look at the Elliott Wave charts of GOLD commodity ( XAUUSD ) , published in members area of the website. As our members are aware, XAUUSD recently completed a 3-wave recovery against the 2726.1 peak. The commodity found sellers right at the equal legs zone. Let’s dive deeper into our Elliott Wave forecast in this article.
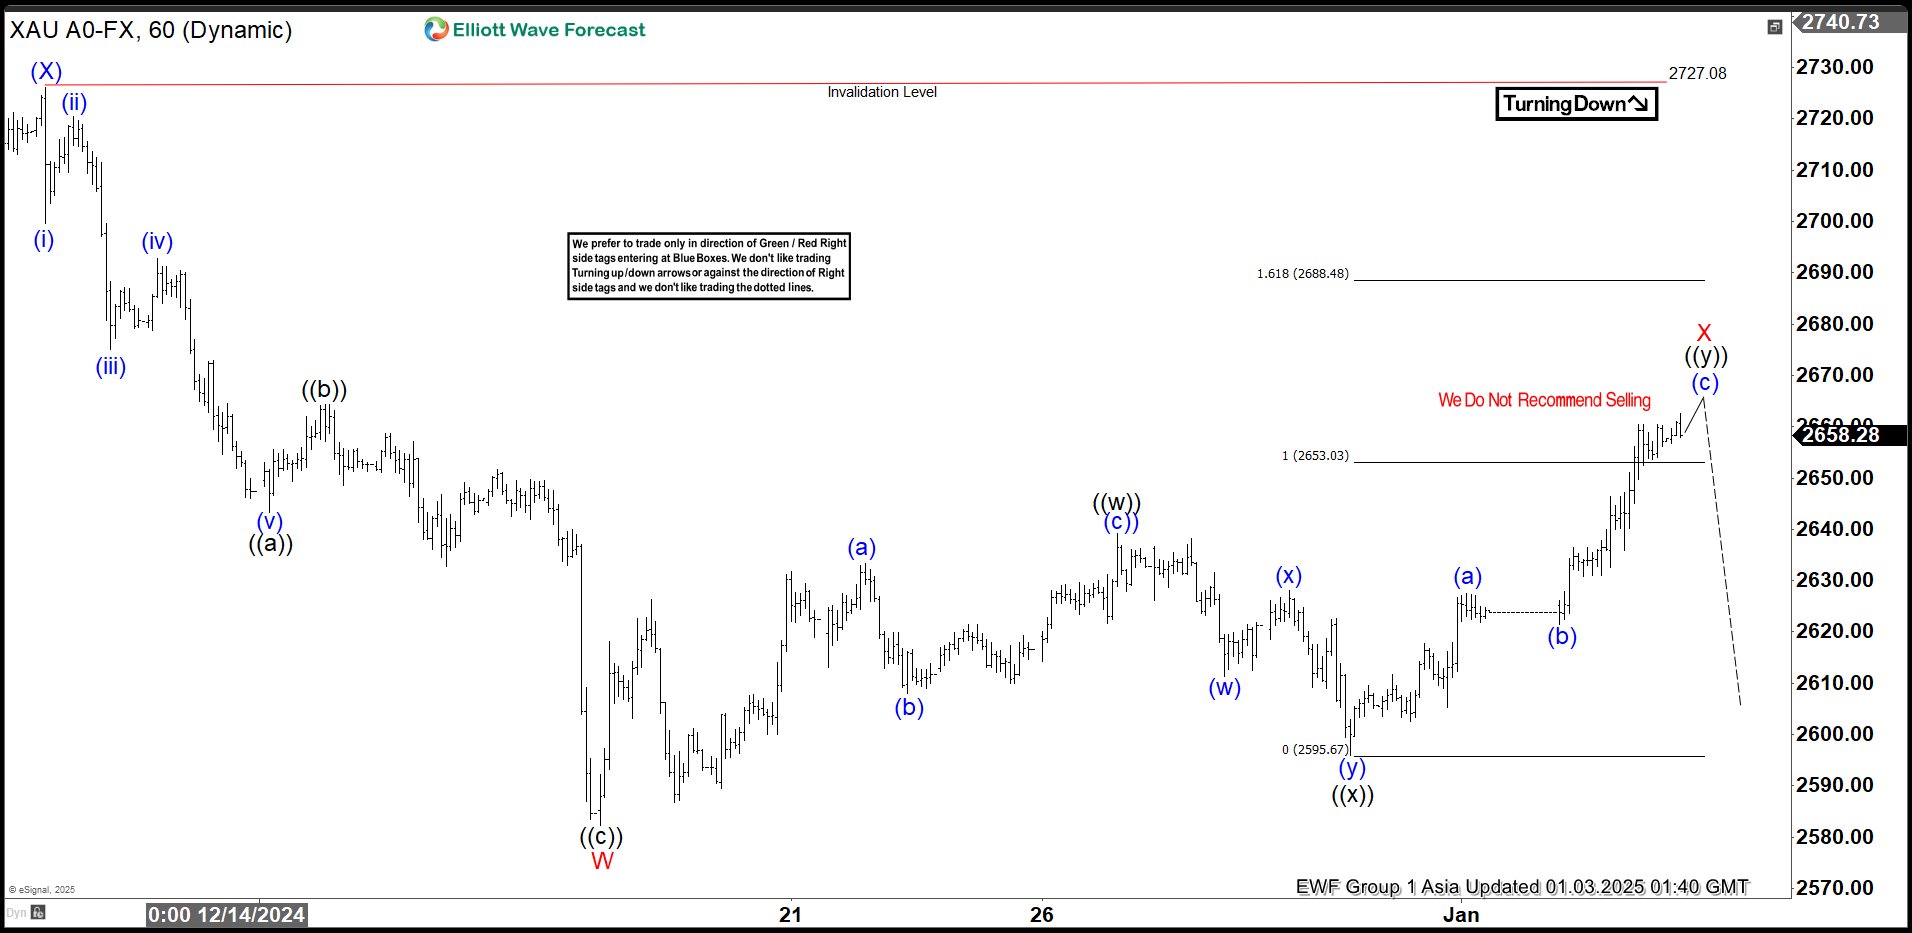
GOLD H1 Update 01.03.2025
According to the current analysis, GOLD seems to be in a red wave X recovery , correcting the cycle from the 2727.08 peak. The price has already reached the key zone at 2653.03 -2688.48. In this area, we expect sellers to take over. That could lead to further decline toward new lows or at least a 3-wave pullback. That’s why we don’t recommend buying this commodity right now.
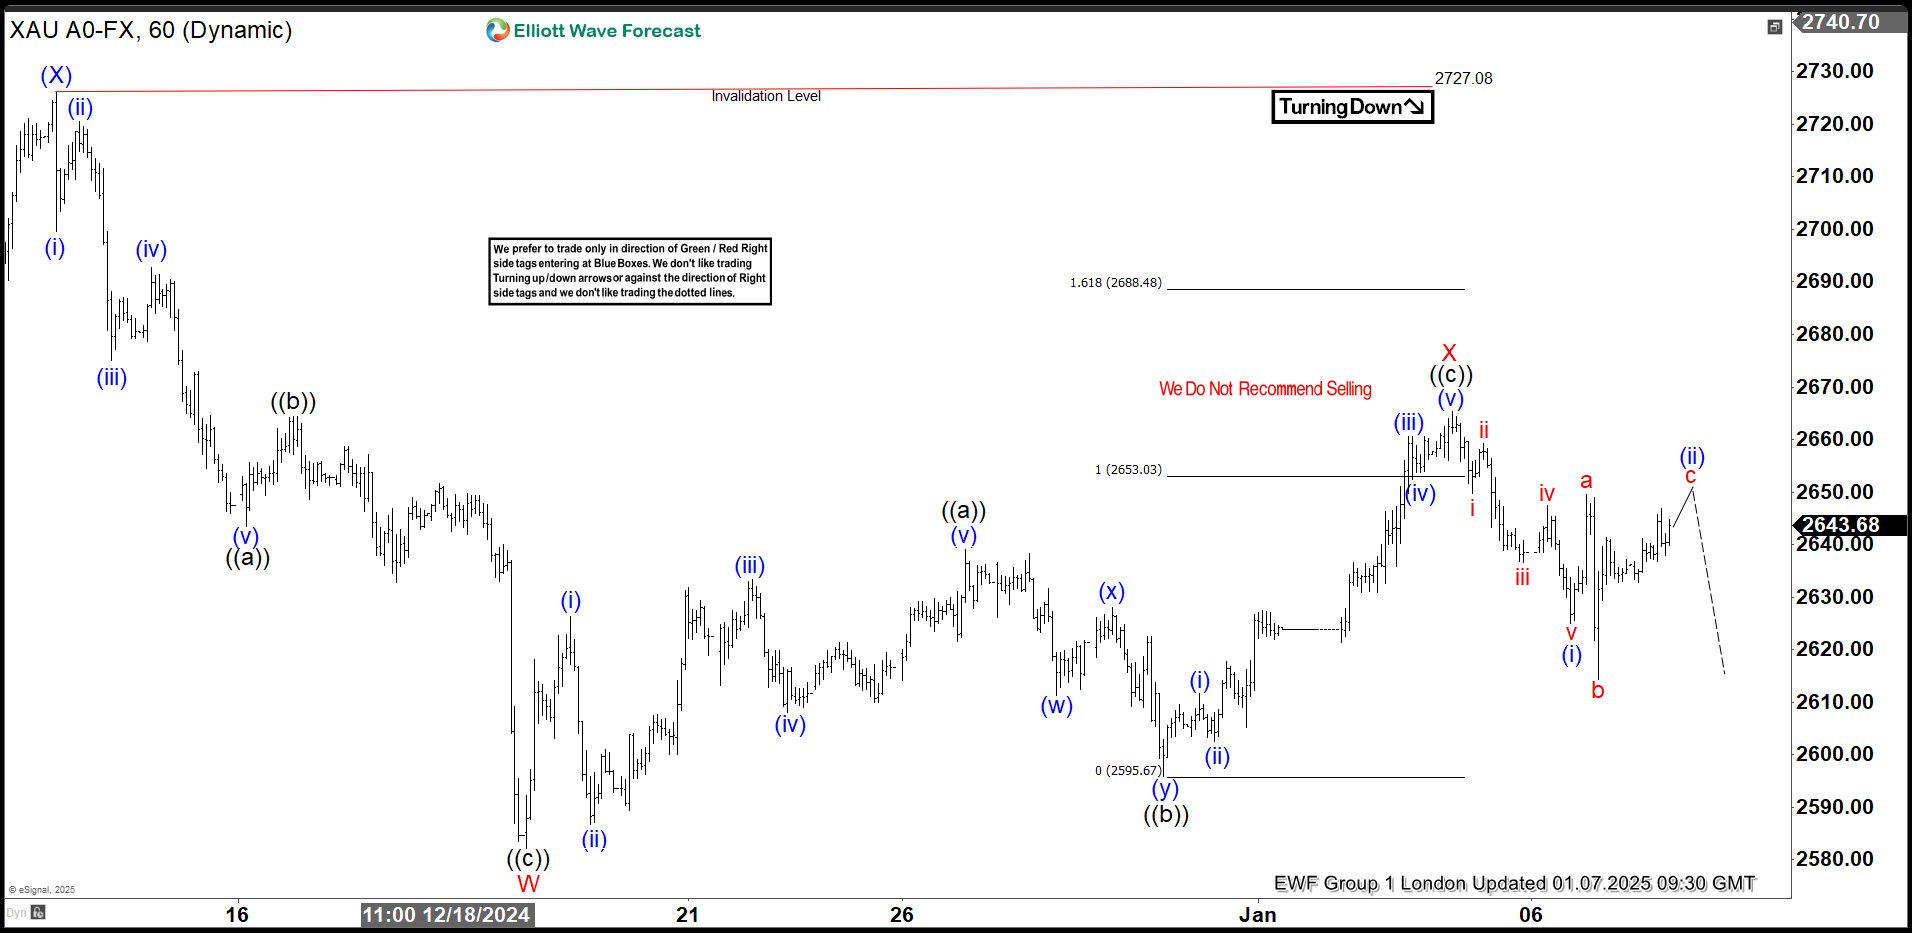
GOLD H1 Update 01.07.2025
GOLD found sellers at the Equal Legs Zone as anticipated. The commodity showed a significant reaction from the seller’s zone, and we consider the red wave X recovery to have ended at the 2665.42 high. As long as the price stays below this level, we expect further weakness in the red wave Y. A break below the red wave W low at 2583.8 is needed to confirm this scenario.
However, if the price rises above the 2665.42 high, an alternative scenario will come into play. We do not recommend selling against the main bullish trend and will instead wait for the red wave Y as a potential buying opportunity if the next extreme zone is reached.
Japanese Yen Eyes Wage Data
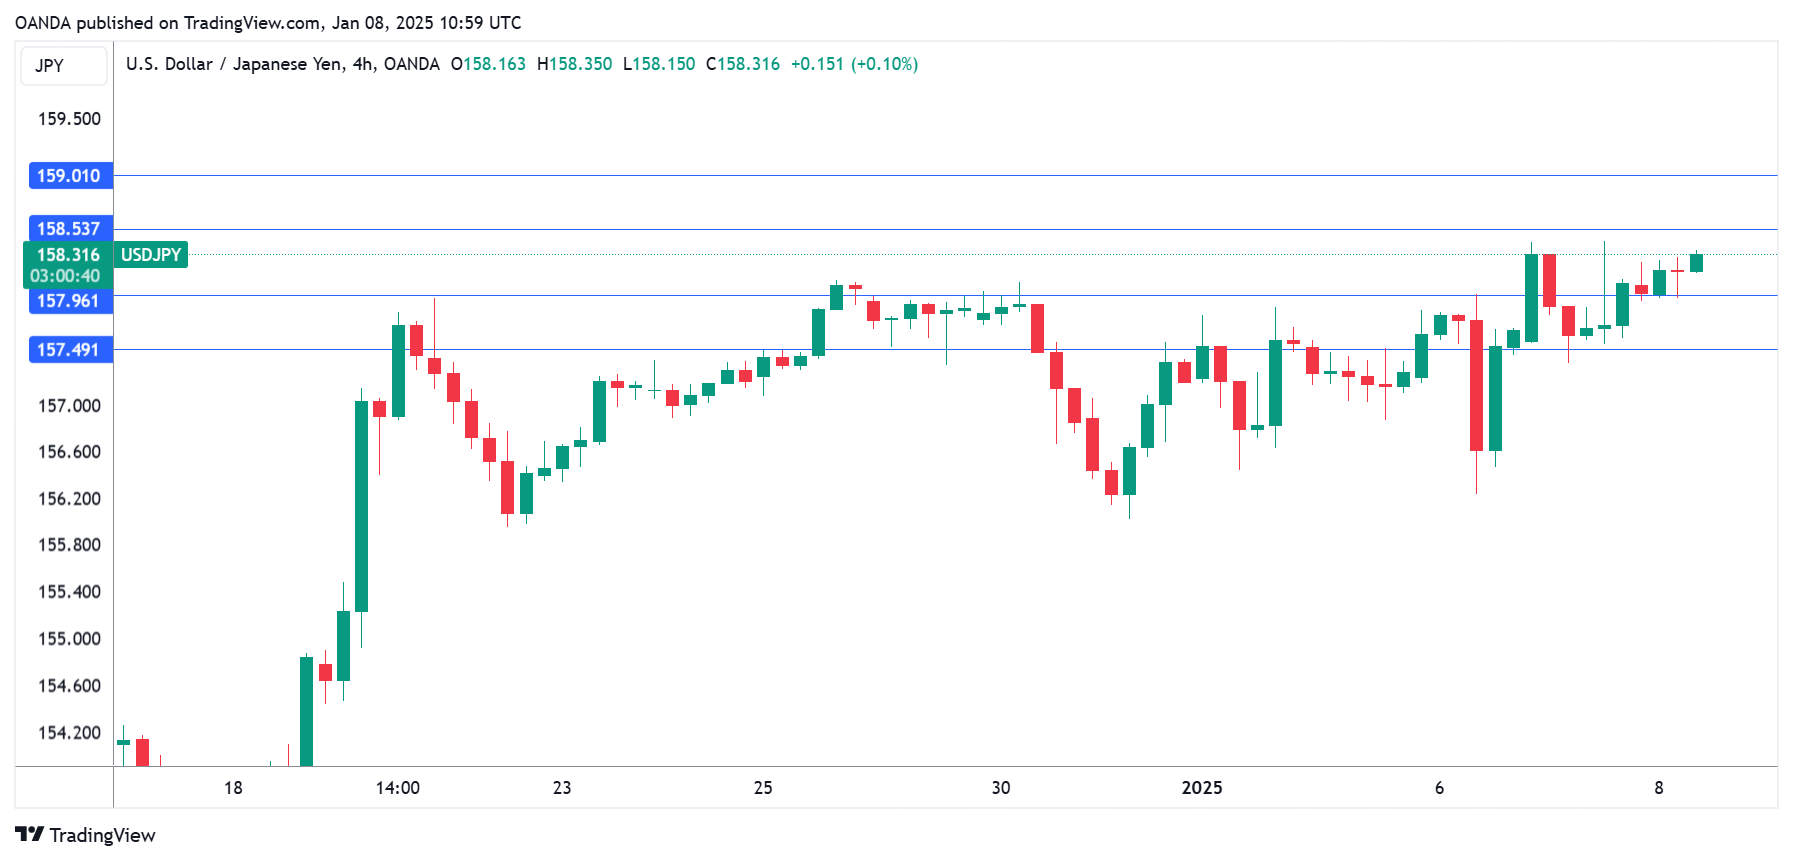
The yen has edged higher on Wednesday. In the European session, USD/JPY is trading at 158.33, up 0.19% on the day.
Japan’s consumer confidence for December data showed a slight decline, falling to 36.2 from 36.4 in November. This missed the market estimate of 36.4 as consumers remain in a pessimistic mood about economic conditions.
Japan’s wage growth expected to rise
Japan will release wage growth early on Thursday and Bank of Japan policy makers will be watching carefully. The market estimate for November stands at 2.7%, up from 2.6% a month earlier. Governor Ueda has repeatedly said that he won’t raise rates before wage growth approaches a level consistent with 2% inflation. Ueda has been mum about a time frame and the BoJ is hesitant to telegraph its rate plans ahead of time, in order to ward off yen speculators. This leaves investors with a great deal of uncertainty with regard to the timing of a rate hike. The BoJ meets next on Jan. 23-24 and could announce a rate hike, or remain on the sidelines until March or even later.
The BoJ is also concerned about the yen’s rapid descent. The Japanese currency plunged 10.3% against the dollar in 2024 and could face further headwinds, including an incoming Trump administration that has pledged trade tariffs. The government intervened in the currency markets last July after the yen fell to 160 against the dollar and the yen is closing in on that level.
The US posted strong data on Tuesday. The ISM Services PMI rose to 54.1 in December, up from 52.1 and above the market estimate of 53.3. JOLT Job Openings jumped to 8.09 million in November and 7.8 million in October. The market is looking ahead to Friday’s nonfarm payrolls, which is expected to drop to 154 thousand, compared to 227 thousand in November.
USD/JPY Technical
- USD/JPY tested support at 157.96 earlier. Next, there is support at 157.49
- There is resistance at 158.54 and 159.01
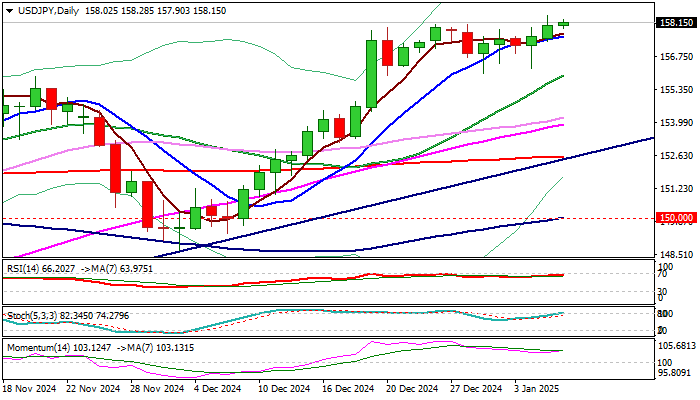
USDJPY – Bulls Eye 160 Target
USDJPY keeps firm tone and holds just under new multi-month high in early Wednesday, with near term focus at the upside, after recent consolidation faced multiple downside rejections.
Fundamentals remain favorable for dollar as Bank of Japan is likely to keep rates on hold on the policy meeting later this month, while the US economy is strong and expected to register further growth after Trump’s administration takes over.
US December labor reports are expected to be strong (JOLTS report, released on Tuesday, showed stronger than expected results) with focus on ADP private sector payrolls (today) and Non-Farm payrolls, unemployment and average earnings (Friday) which could further boost the dollar.
Technical picture on daily chart is firmly bullish and underpins the action for push towards psychological 160 barrier and recent top at 161.95.
However, threats of intervention by Japanese authorities at this zone should be considered, following the similar action in July last year.
Rising 10DMA offers immediate support at 157.56, followed by more significant supports at 156 zone (higher base / rising 20DMA), which should ideally contain dips.
Res: 158.42; 159.00; 160.00; 160.19
Sup: 157.56; 156.24; 155.96; 154.18
Eurozone PPI rises 1.6% mom, energy prices drive monthly gains
Eurozone producer prices rebounded more than expected in November, with PPI rising 1.6% mom, surpassing market forecasts of 1.5% mom. On an annual basis, PPI improved to -1.2% yoy from -3.3% in October, slightly better than the anticipated -1.3% yoy. The data highlights the ongoing influence of energy price volatility on the region's industrial sector.
Breaking down the monthly changes, Eurozone's energy prices surged by 5.4% mom, providing the largest contribution to the overall increase. Intermediate goods saw a modest decline of -0.1% mom, while prices for capital goods and non-durable consumer goods remained stable. Durable consumer goods recorded a slight decline of -0.2% mom.
At the EU level, industrial producer prices climbed by 1.7% mom but fell -1.1% yoy. Among member states, Bulgaria (+4.9%), Ireland (+4.5%), and Sweden (+4.2%) posted the highest monthly gains in producer prices, reflecting the energy-driven rise. Conversely, Estonia, Cyprus (-1.4% each), Slovakia (-0.5%), and Luxembourg (-0.4%) saw the sharpest declines, highlighting regional disparities.
GBP/JPY Daily Outlook
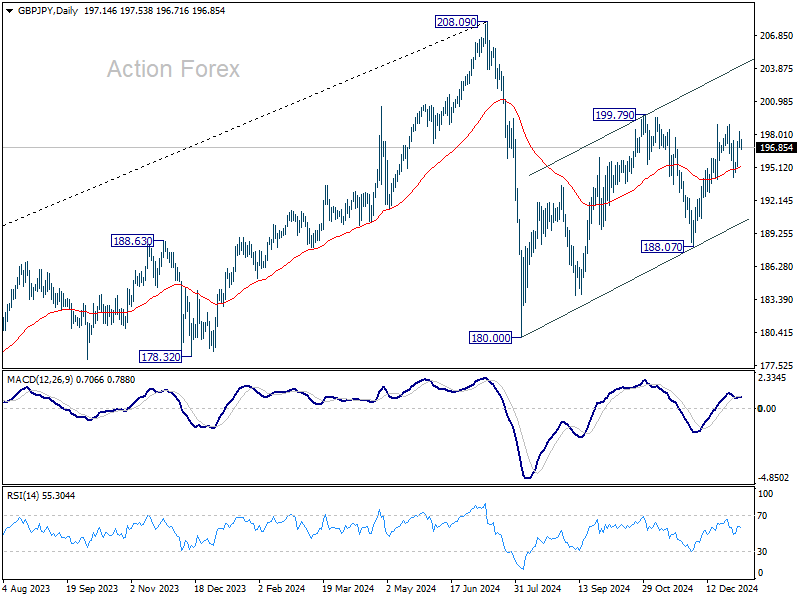
Daily Pivots: (S1) 196.65; (P) 197.46; (R1) 198.03; More...
GBP/JPY is staying in range trading below 198.84 and intraday bias remains neutral. Further rally is expected with 194.04 support intact. Break of 198.94 will resume the rise from 188.07, as a leg of the corrective pattern from 180.00, and target channel resistance (now at 204.05). However, firm break of 194.04 will turn bias to the downside for 188.07 support instead.
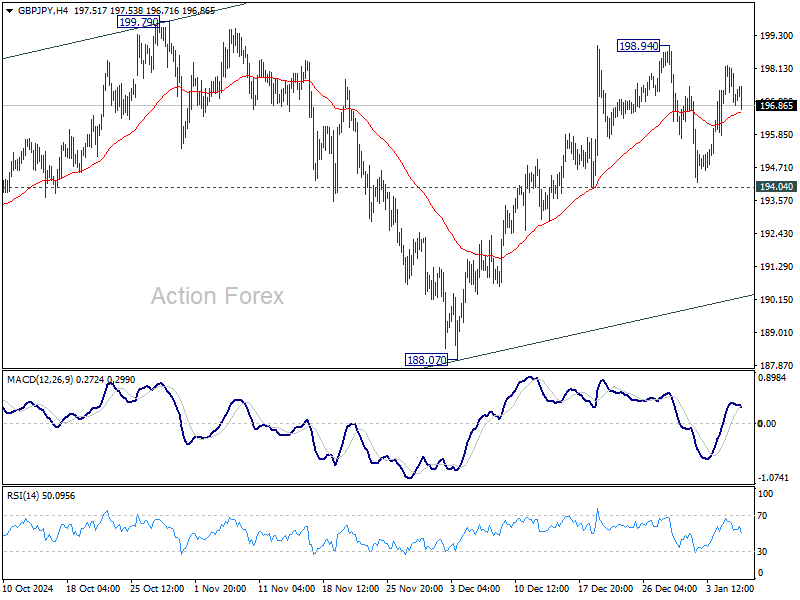
In the bigger picture, price actions from 208.09 are seen as a correction to whole rally from 123.94 (2020 low). The range of consolidation should be set between 38.2% retracement of 123.94 to 208.09 at 175.94 and 208.09. However, decisive break of 175.94 will argue that deeper correction is underway.
EUR/JPY Daily Outlook
Daily Pivots: (S1) 162.88; (P) 163.72; (R1) 164.22; More...
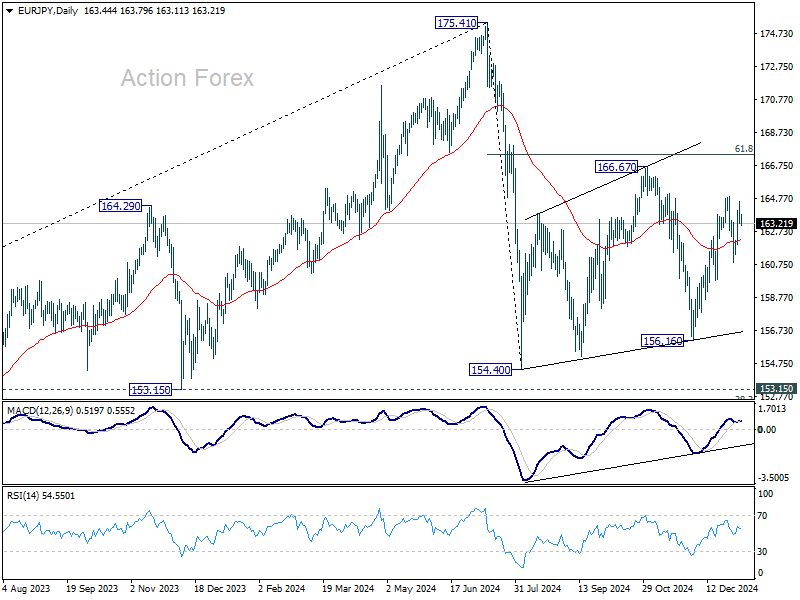
EUR/JPY retreated ahead of 164.89 resistance and intraday bias is turned neutral for now. Outlook is unchanged that corrective pattern from 154.40 is extending. Break of 164.89 will target 166.67, and above. This will remain the favored case as long as 160.89 support holds.
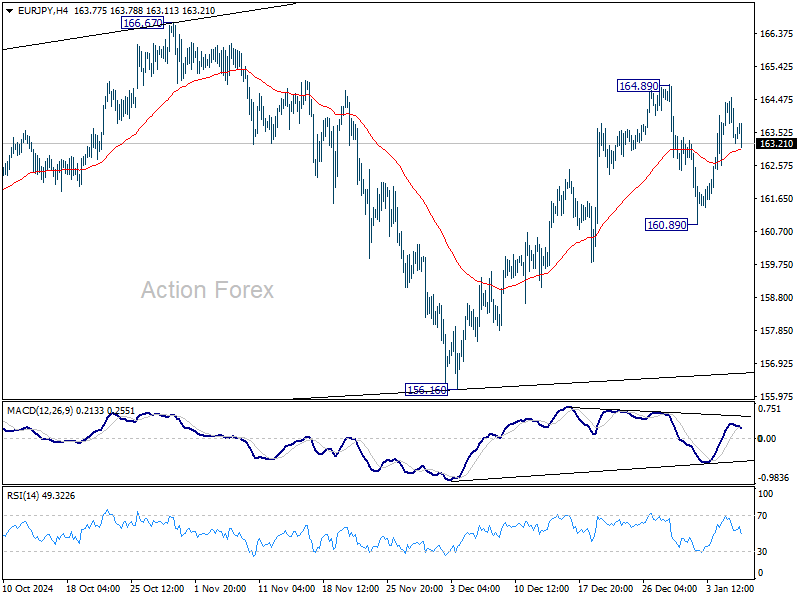
In the bigger picture, price actions from 175.41 are seen as correction to rally from 114.42 (2020 low). The range of consolidation should have been set between 38.2% retracement of 114.42 to 175.41 at 152.11 and 175.41 high. However, decisive break of 152.11 would argue that deeper correction is underway.
EUR/GBP Daily Outlook
Daily Pivots: (S1) 0.8280; (P) 0.8293; (R1) 0.8300; More...
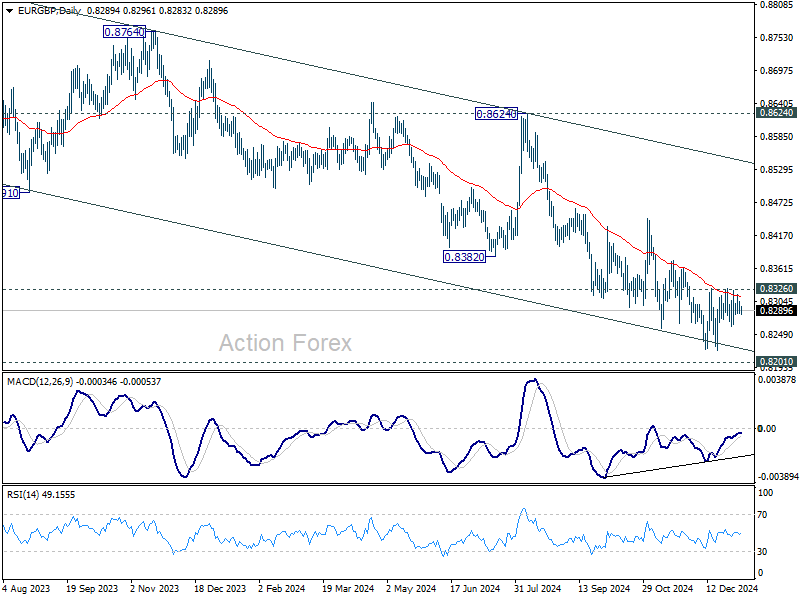
EUR/GBP is staying in consolidations and intraday bias remains neutral. On the upside, firm break of 0.8326 resistance will confirm short term bottoming at 0.8221, ahead of 0.8201 key support. Intraday bias will be turned back to the upside for 0.8446 structural resistance next.
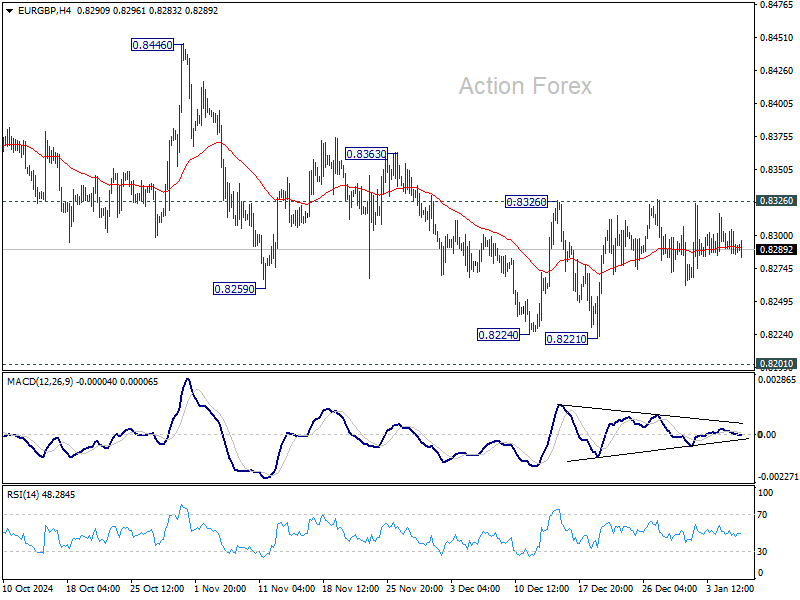
In the bigger picture, focus remains on whether 0.8201 key support (2022 low) is strong enough to complete the whole down trend from 0.9267 (2022 high). In any case, medium term outlook will be neutral at best until decisive break of 0.8624 key resistance. Risk will stay on the downside even in case of strong rebound.
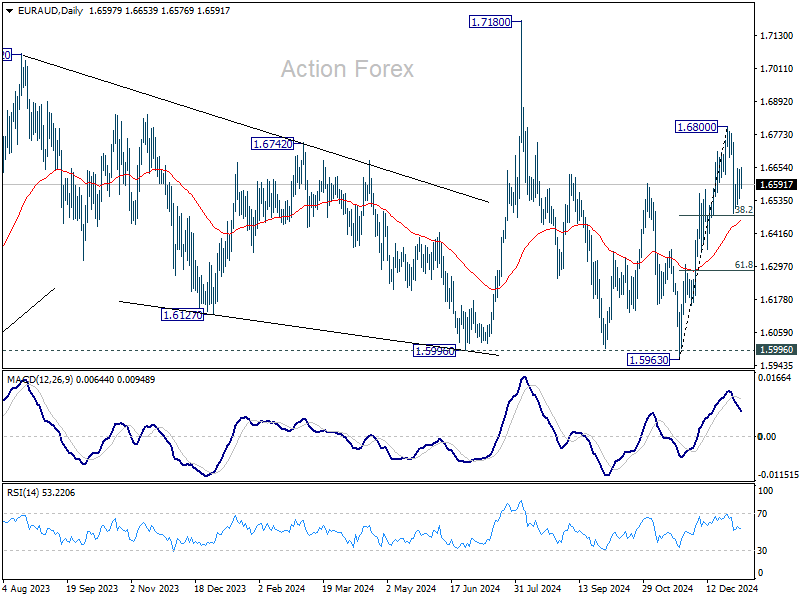
EUR/AUD Daily Outlook
Daily Pivots: (S1) 1.6542; (P) 1.6597; (R1) 1.6649; More...
Intraday bias in EUR/AUD stays neutral for the moment. Corrective pattern from 1.6800 could extend further. But strong support could be seen from 38.2% retracement of 1.5963 to 1.6800 at 1.6480 to bring rebound. Near term risk will stay mildly on the downside as long as 1.6800 resistance holds, in case of extended recovery. Firm break of 1.6480 will bring deeper correction 61.8% retracement at 1.6283.
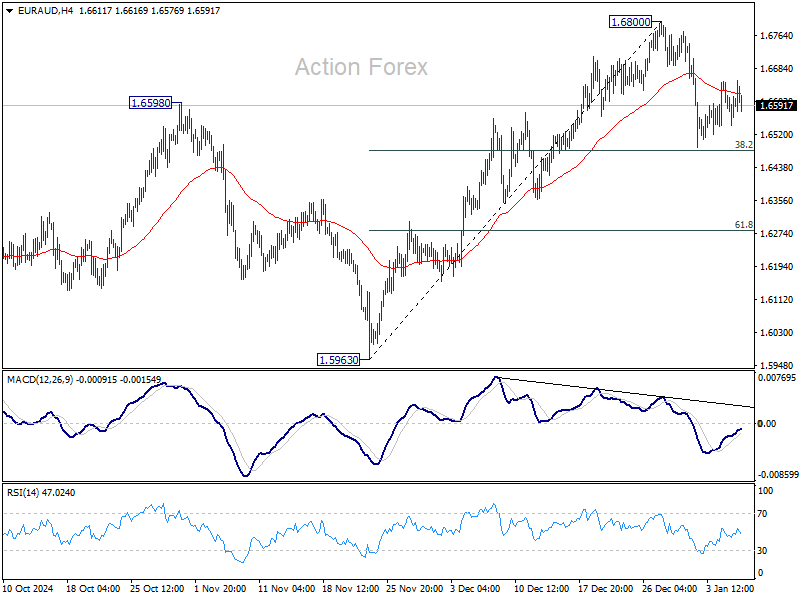
In the bigger picture, EUR/AUD is holding on to 1.5996 key support despite brief breach. Larger up trend from 1.4281 (2022 low) is still in favor to resume through 1.7180 at a later stage. Nevertheless, sustained break of 1.5995 will indicate that such up trend has completed and deeper decline would be seen.
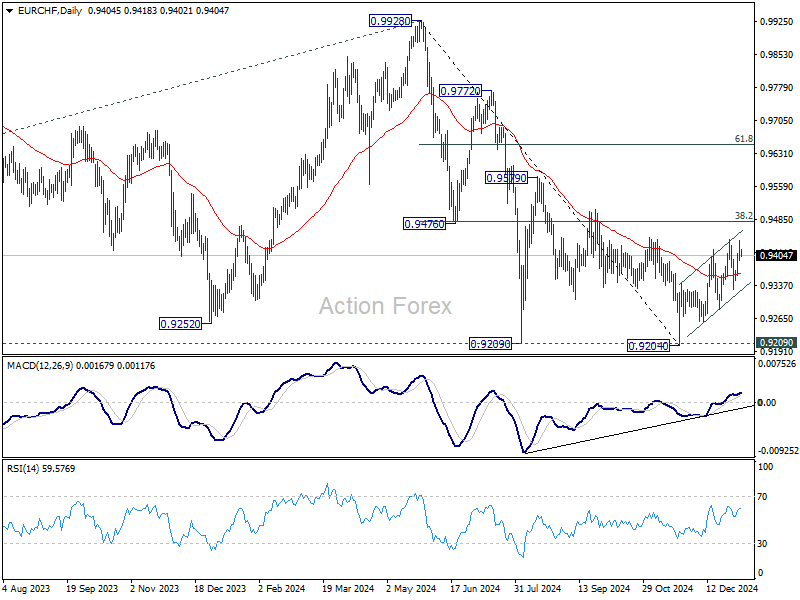
EUR/CHF Daily Outlook
Daily Pivots: (S1) 0.9378; (P) 0.9409; (R1) 0.9437; More....
EUR/CHF retreated ahead of 0.9440 resistance and outlook is unchanged. Corrective rebound from 0.9204 could still extend higher through 0.9440. But upside should be limited by 0.9481 fibonacci resistance. On the downside, firm break of 0.9329 support will argue that the correction has completed, and bring retest of 0.9204 low.
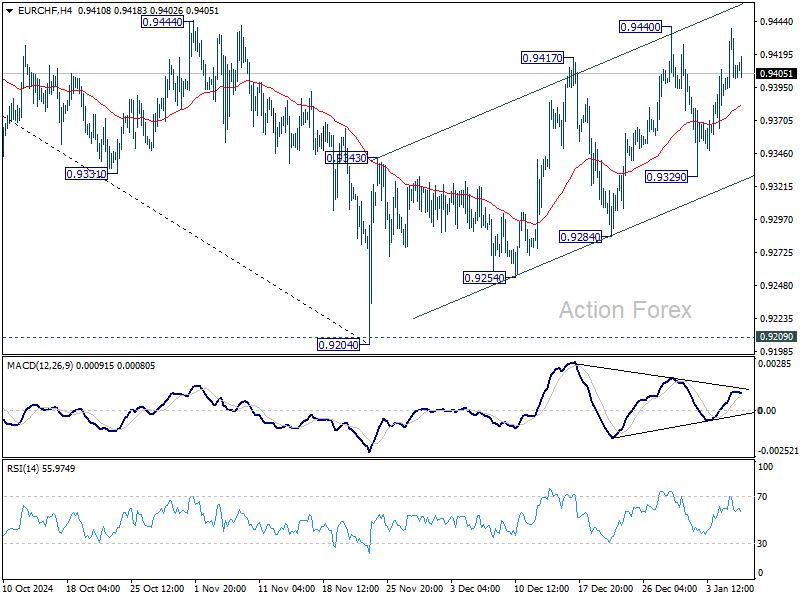
In the bigger picture, while rebound from 0.9204 might extend higher, strong resistance could be seen from 38.2% retracement of 0.9928 to 0.9204 at 0.9481 to limit upside. Down trend from 0.9928 (2024 high) is still in favor to resume through 0.9204/9 support zone at a later stage.
Hang Seng Index: Transforming into a Medium-Term Bearish Trend Despite Improving Services PMI from China
- Sentiment remains fragile in China and Hong Kong stock market even China services activities have improved in December.
- Weak market breadth and a persistent bearish trend of the Chinese yuan since November has added to more woes to the Hang Seng Index.
- Watch the 19,700/20,130 key medium-term resistance on the Hang Seng Index.
Since our last publication, the Hong Kong benchmark stock indices (a proxy for international investors and traders to get exposure into China equities) have wobbled where market participants have lost patient over China’s top policy makers’ rhetoric of the “yet to materialise” forceful fiscal stimulus measures to negate the ongoing deflationary spiral in the Chinese economy.
The Hang Seng Index has broken below its 19,700 key medium-term support and shed 5% to print an intraday low of 19,111 at this time of the writing.
Start of the start of the new year, China and Hong Kong bench stock indices are the worst performers against the rest of the world as both of them recorded losses of 2.22% and 2.58% respectively despite services activities have started to show signs of growth in December as indicated by the latest the official NBS non-manufacturing PMI and privately complied Caixin services PMI data.
Weak market breadth
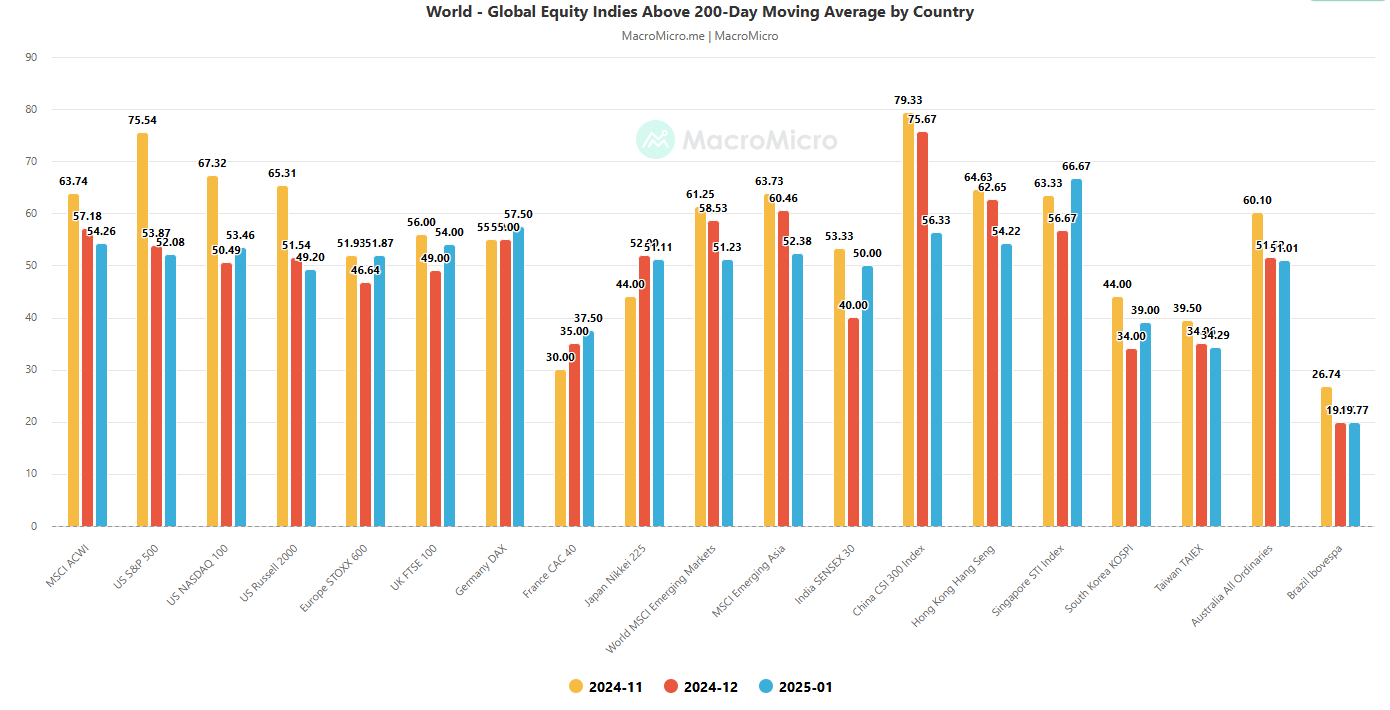
Fig 1: Major stock indices percentage of component stocks above 200-day MA as of 7 Jan 2025 (Source: MacroMicro, click to enlarge chart)
Sentiment has remained fragile as the number of component stocks of the two key benchmark stock indices; China’s CSI 300 and Hong Kong’s Hang Seng Index that are trading above their respective long-term 200-day moving averages have declined steadily since November 2024.
The percentage of CSI 300 component stocks trading above their respective 200-day moving averages have slipped to 56% in January from 79% previously recorded in November, and the Hang Seng Index also showed a similar dire fate where the percentage of its component stocks declined to 54% currently from 64% in November (see Fig 1).
A persistent weak yuan has more negative impact on China and Hong Kong stock markets
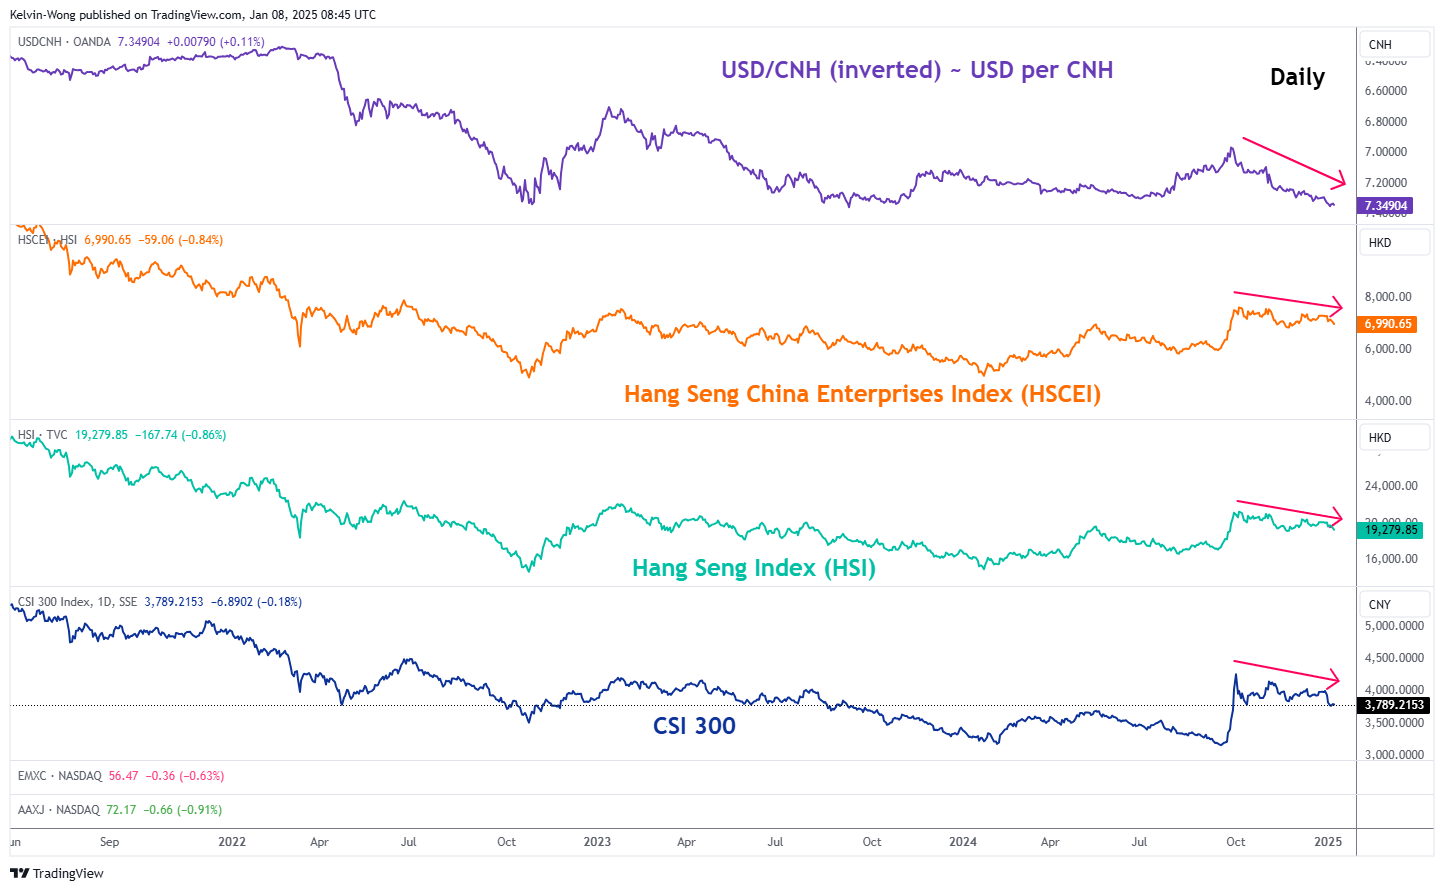
Fig 2: USD/CNH major trend with HSCEI, HSI & CSI 300 as of 8 Jan 2025 (Source: TradingView, click to enlarge chart)
Since the outcome of the US presidential election on 6 November, the offshore Chinese yuan has depreciated by 3.7% against the US dollar to a two-year low where the USD/CNH exchange rate its now coming close to a major swing high of 7.3750 printed on 25 October 2022.
China policy makers have “deliberately” allow the yuan to weaken to offset the potential incoming higher trade tariffs from US President-elect Trump’s hawkish trade policy towards US major trading partners that includes China where he has proposed to implement 60% additional tariffs on China’s exports to the US.
Even though, a weaker yuan on a trade weighed basis may allow China to maintain its share of exports but it may create a negative feedback loop into the stock markets of China and Hong Kong as hot capital flight can materialised. Further sparked by a potential regional currency war where other Asian trading hubs such as South Korea, Singapore, and Taiwan may be forced to weaken their respective domestic currencies to maintain export competitiveness (see Fig 2).
Bearish momentum in Hang Seng Index
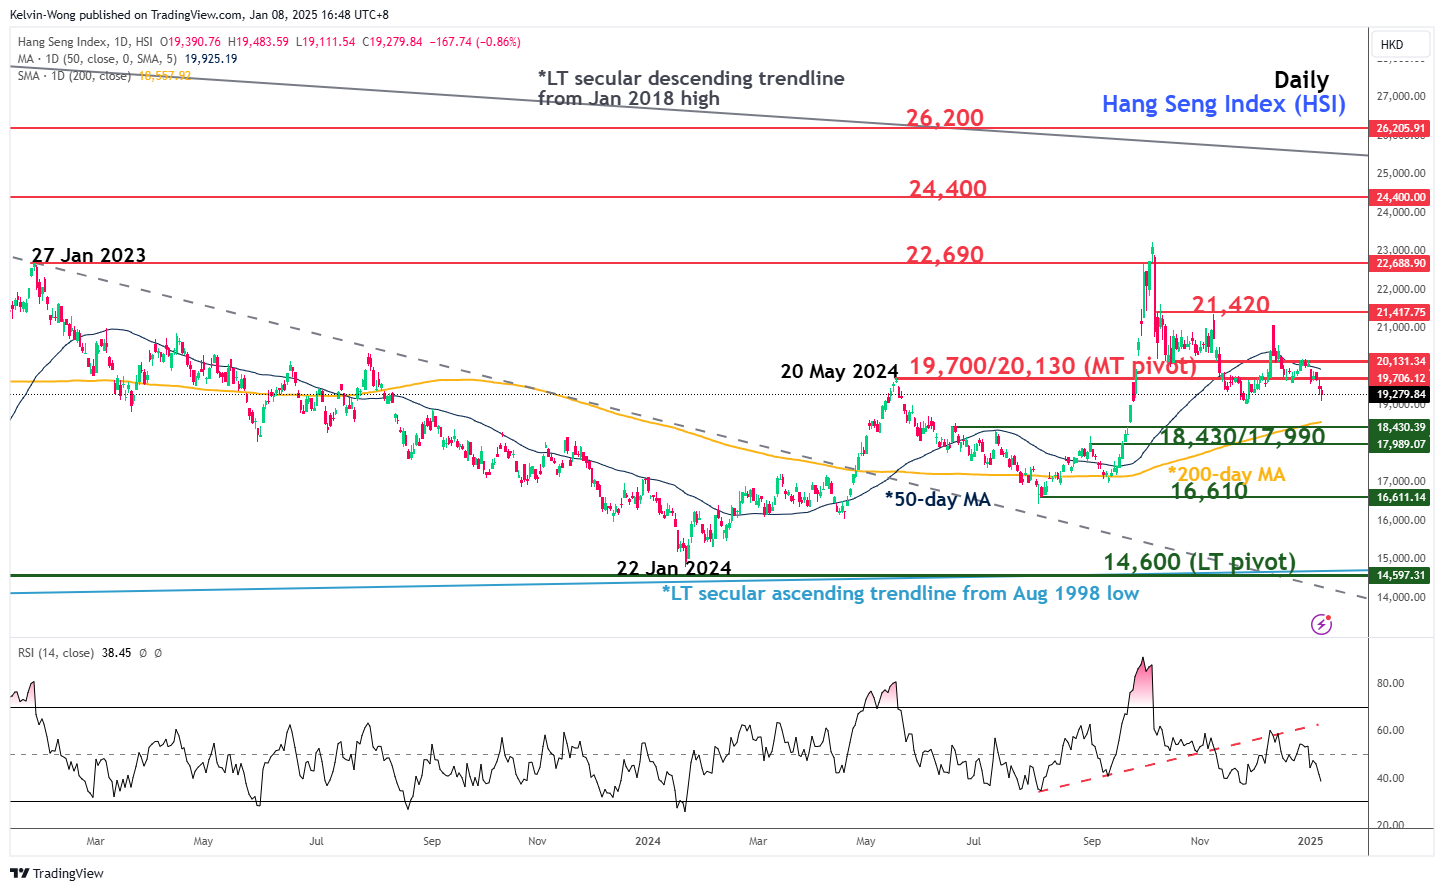
Fig 3: Hang Seng Index medium-term trend as of 8 Jan 2025 (Source: TradingView, click to enlarge chart)
The Hang Seng Index has failed to reintegrate above its 50-day moving average and traded below it since the start of 2025.
In addition, the daily RSI momentum indicator has continued to exhibit bearish elements where it printed series of lower highs below the 50 level and has not reached its oversold region.
These observations suggest that bearish momentum is still intact. Key medium-term pivotal resistance at 19,700/20,130 and a break below 18,430/17,990 (also the 200-day moving average) may trigger a deeper corrective decline sequence to expose the next medium-term support at 16,610 in the first step (see Fig 3).
On the other hand, a clearance above 20,130 negates the bearish tone to revisit the next medium-term resistances at 21,420 and 22,690.