Sample Category Title
Oil Price Update – Will Brent Break $80? Winter Demand, Offshore Drilling, and Technicals in Focus
- Oil prices have started 2025 strong, defying expectations of a downturn fueled by worries about slowing demand.
- Cold weather, coupled with US policy decisions on offshore drilling, have contributed to the upward price movement.
- Brent Crude has broken through key resistance levels, is $80 a barrel a matter of time?
Oil prices have had a surprisingly positive start to 2025. The reason I say this is because the narrative heading into 2025 was one of concerns largely centered on dwindling demand, particularly from China.
There has been an uptick in demand however, as winter grips Europe and America leading to heightened fuel demand. This coupled with repositioning as the New Year began could in part explain the recent rally.
US Offshore Drilling in 2025 – Trump vs Biden
Since the US election in November, markets have been eyeing reduced regulations around US offshore oil drilling which could lead to increased supply and weigh on prices. However, this week President Biden used his executive powers to stop offshore drilling in over 625 million acres of U.S. ocean, the White House said Monday.
This could have contributed to the rise in Oil prices at the start of the week. Incoming President Donald Trump said he will immediately reverse such a move when he takes office, however this does not appear to have dampened the move.
The incoming President made similar promises in 2016, but opposition from states like Florida led him in 2020 to sign a memo telling the Interior secretary to block drilling off the coasts of Florida, Georgia, and South Carolina until 2032. It will be intriguing to see how this plays out as President elect Trump gave in during his previous administration. Will we see a similar story this time around?
China Demand and US Dollar Dynamic
Saudi Arabia will export less crude oil to China in February compared to January. This comes after the country raised prices and OPEC+ continued cutting production in the first quarter.
Saudi Aramco plans to ship about 43.5 million barrels to China in February, down from 46 million barrels in January, which was the highest in three months.
This week’s inventory data from the API on January 7, showed U.S. crude oil supplies dropped by 4 million barrels, and stocks at Cushing, Oklahoma, fell by 3.1 million barrels. At the same time, gasoline and distillate (like diesel) supplies went up.
The EIA report yesterday revealed that U.S. crude stocks fell by almost 1 million barrels, with Cushing’s storage hitting its lowest level in 10 years. Gasoline and distillate supplies also increased.
The recent bullish move for Oil prices may face headwinds from a strong US Dollar. Moving forward it will be key to see if US President Elect Trump reels back President Biden’s offshore drilling ban while US policy toward Iran and Russia may also affect oil prices moving forward.
Technical Analysis
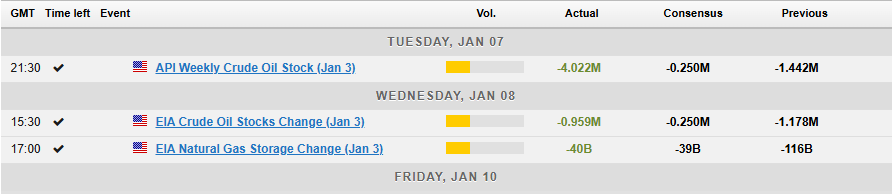
As discussed last week, Oil prices have managed to break above the key confluence level at 76.35 which has acted as support since.
Yesterday saw a pullback in Oil prices following a somewhat bearish EIA report on inventories while the continued advance of the US dollar ripples across markets.
There are few possible scenarios for oil prices. let us look at how each of them may play out.
Bulls remain in control for now but a deeper retracement in price toward the 75.00 psychological level or the 100-day MA at 74.55 cannot be ruled before fresh highs are printed above the 78.157 handle. This would be scenario 1.
Looking at the technicals and a rally from here toward recent highs at 78.157. A break of this opening up a retest of the psychological 80.00 mark.
These are the two most likely scenarios toward the end of the week barring any significant surprises. Even then i expect one of these potential scenarios to play out with a any unforeseen changes likely to just serves as a catalyst and speed up the move.
Brent Crude Oil Daily Chart, January 9, 2025
Source: TradingView (click to enlarge)
Support
- 76.35
- 75.00 (psychological level)
- 74.55 (100-day MA)
Resistance
- 77.50
- 78.15
- 80.00
Sterling Sliding, Fed Worried About Trump
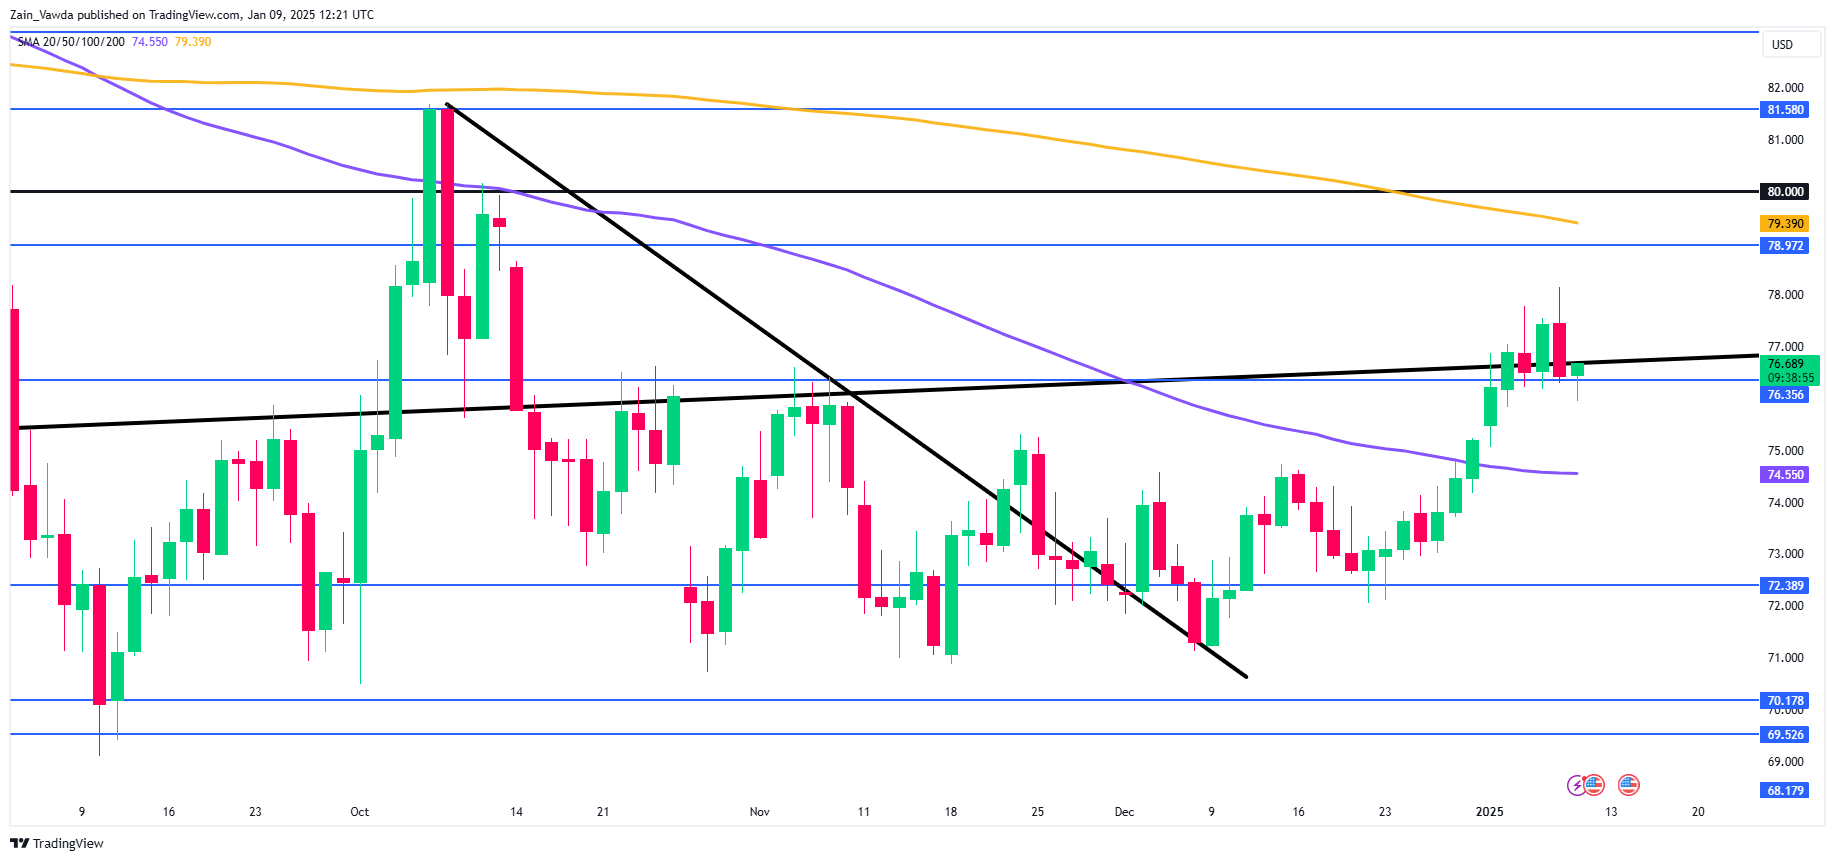
The British pound is on a nasty slide and has lost 1.8% since Monday. In the European session, GBP/USD is currently trading at 1.2294, down 0.53%. Earlier, the pound fell as low as 1.2237 (1%), it lowest level since Nov. 2023.
BRC shop inflation hits 3.5 year low
The latest setback for the pound was Thursday’s British Retail Consortium (BRC) Shop Price index, which came in at -1% in December, lower than the November reading of -0.4% and the market estimate of -0.6%. This was the lowest level since July 2021. This points to weaker consumer spending, a key engine of the economy.
The BRC has projected that food inflation will continue to accelerate, which will add to the squeeze that weary consumers are feeling from inflation and high interest rates. The UK government introduced a “tax and spend” budget last October but retailers have argued that this recipe will lead to retail job cuts and higher prices.
Fed minutes point to Trump worries
The Federal Reserve minutes of the December meeting, released on Wednesday, indicated that policy makers were concerned about the upside risk to inflation, particularly due to incoming President-elect Trump’s potential trade and immigration policies. Trump has promised to slap punishing tariffs on US trade partners, including China. Trump has also called for mass deportations of illegal immigrants.
The minutes did not mention Trump by name but there was no doubt that Fed members had Trump in mind. Members noted their concern that inflation could rise due to “the likely effects of potential changes in trade and immigration policy”.
Members also indicated that the Fed was “at or near the point” of slowing the pace of easing. After starting the easing cycle with a jumbo rate cut of 50 basis points, the Fed has delivered back-to-back cuts of 25 basis points. At the December meeting, the Fed lowered its rate forecast for 2025 to two cuts, down from four in the September forecast.
After the December meeting, the currency markets reacted sharply to the revised forecast and the US dollar shot up against the majors. The Fed again sounded hawkish in the minutes but this time the US dollar showed little movement against the majors, with the exception of GBP/USD.
GBP/USD Technical
- GBP/USD is testing support at 1.2292. Below, there is support at 1.2220
- 1.2393 and 1.2465 are the next resistance lines
Eurozone retail sales marginally rise 0.1% mom in Nov, lag expectations
Eurozone retail sales edged up by 0.1% mom in November, falling short of expectations for 0.3% mom increase. Within the retail sectors, volume of sales rose slightly for food, drinks, and tobacco by 0.1%, while non-food product sales, excluding automotive fuel, contracted by -0.6%. Meanwhile, sales of automotive fuel increased by 0.8%, providing a modest lift to the overall figure.
At the EU level, retail sales grew by 0.2% mom. Among member states, Cyprus posted the strongest retail performance with a 2.3% increase, followed by Bulgaria at 1.3%, and Denmark and Latvia, both recording a 1.1% rise. Conversely, Belgium faced the sharpest contraction at -2.4%, with Germany and Spain both reporting a -0.6% decline. Poland and Finland also recorded slight decreases of -0.2%.
Yen Nears a Six-Month Low, Affected by Strong US Dollar
The USD/JPY pair remained near the 158.00 mark on Thursday, consolidating at levels last seen in mid-2024. Although the pair is no longer surging as it did earlier in the year, the fundamental preconditions for further growth persist.
The yen continues to face significant downward pressure due to the strength of the US dollar. The greenback is buoyed by hawkish signals from the US Federal Reserve, reinforcing expectations of a measured pace of rate cuts in 2025. The US dollar’s rally is further bolstered by renewed market concerns over tariff threats from US President-elect Donald Trump, adding to its safe-haven appeal.
Domestic data weighs on the yen
Japan’s domestic economic landscape is also contributing to the yen’s weakness. Fresh data showed that real wages in Japan fell by 0.3% year-on-year in November, marking the fourth consecutive month of declines. This wage downturn reflects ongoing challenges in the labour market and erodes consumer spending power, which is critical for economic recovery.
Adding to these woes, consumer sentiment in Japan deteriorated further in December, highlighting public concerns about economic stability. These signals make the likelihood of an interest rate hike by the Bank of Japan (BoJ) increasingly remote. The BoJ has maintained an accommodative monetary policy stance for years, and this latest data reinforces its reticence to tighten monetary conditions.
Japan’s Finance Minister, Katsunobu Kato, reiterated this week the government’s readiness to intervene in currency markets should speculative, one-way moves in the yen persist. While such statements underline the government’s concerns about volatility, they have become a familiar refrain, offering little immediate support for the currency.
Since 4 December 2024, the yen has been in an active weakening phase, and there is little indication that this trend is nearing completion.
Technical analysis of USD/JPY
On the H4 chart, the USD/JPY pair has formed a broad consolidation range around the 157.33 level. This range is expanding upwards, with the market targeting the 158.63 level as its primary objective. After reaching this target, a corrective wave to the 156.00 level could materialise. The MACD indicator supports this outlook, with its signal line positioned above the zero mark and pointing sharply upwards, indicating sustained bullish momentum.
The H1 chart shows the USD/JPY market amid a growth wave targeting 158.63. A consolidation range is forming around the 157.33 level, with an intermediate target at 158.40 already being worked out through an upward breakout. A minor correction back to 157.33 (testing the level from above) is possible. Upon completing this correction, the pair is expected to resume its upward movement towards the 158.63 level, the primary target for the current wave.
The Stochastic oscillator confirms this scenario, with its signal line positioned above the 50 mark and pointing decisively upwards, indicating bullish momentum remains intact.
NFP Trading Idea
Fundamental review
Recent data signals a resilient US labor market:
- Weekly jobless claims dropped by 10,000 to 201,000 — the lowest level since February.
- The latest JOLTS report shows job openings hitting a six-month high, driven by business services.
According to Bloomberg, traders have now pushed back expectations for a Fed rate cut to July.
Given these indicators, the US economy appears stable rather than overheated, suggesting that the upcoming NFP could exceed forecasts — a bullish sign for the USD.
Trading ideas
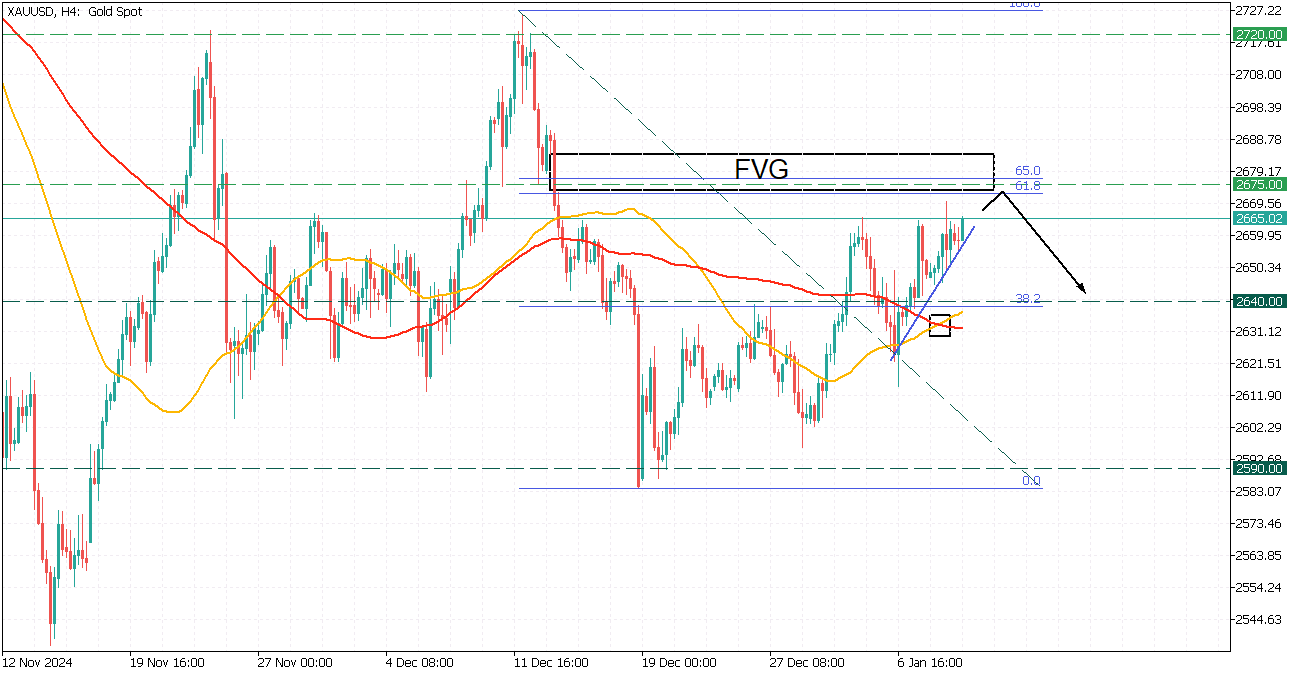
XAUUSD
XAUUSD is moving upwards, aiming to retest the FVG zone at the 2675 resistance level, aligned with the golden Fibonacci ratio. 50-MA crosses the 100-MA up, giving fuel for the short-term rise to the FVG with the further correction to the 2640 support at the 38.2 Fibonacci.
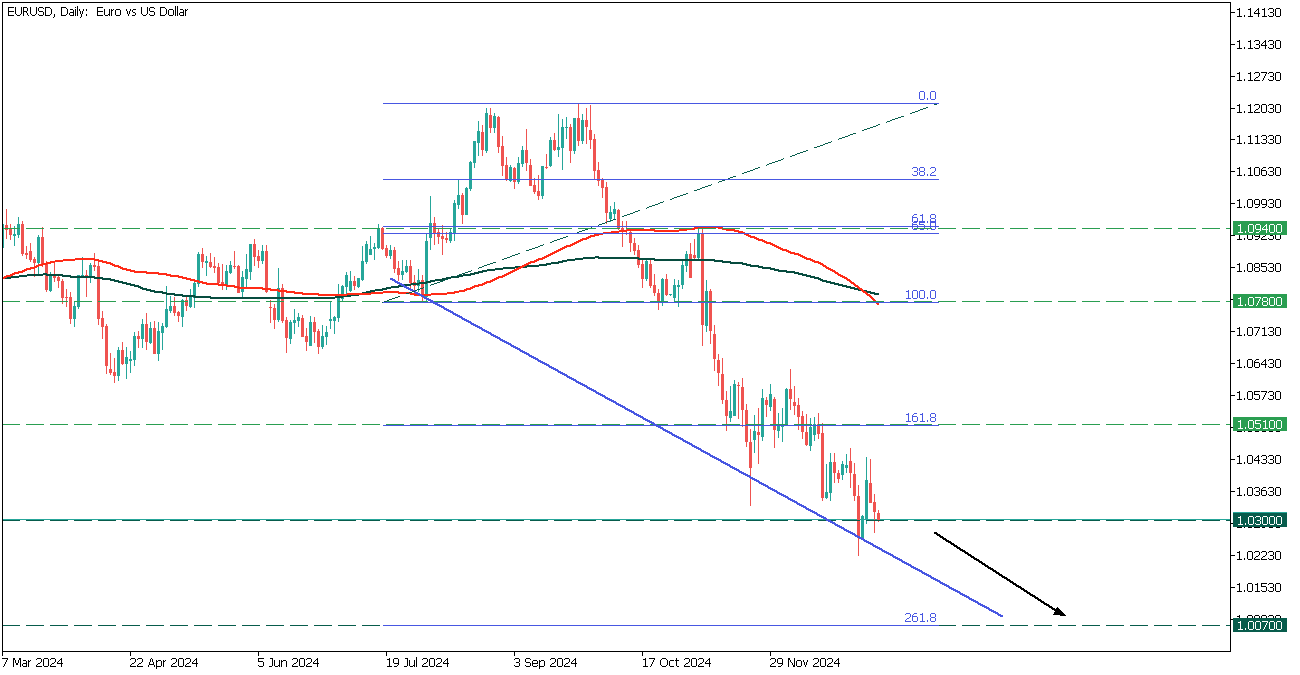
EURUSD
EURUSD navigates downwards within a trendline and is currently facing the 1.0300 support.
The 100-MA crosses the 200-MA down, giving a sign of a global downtrend for the Euro. The targets are 1.0070 at the 261.0 Fibonacci ratio.
GBPCAD: Critical Moment
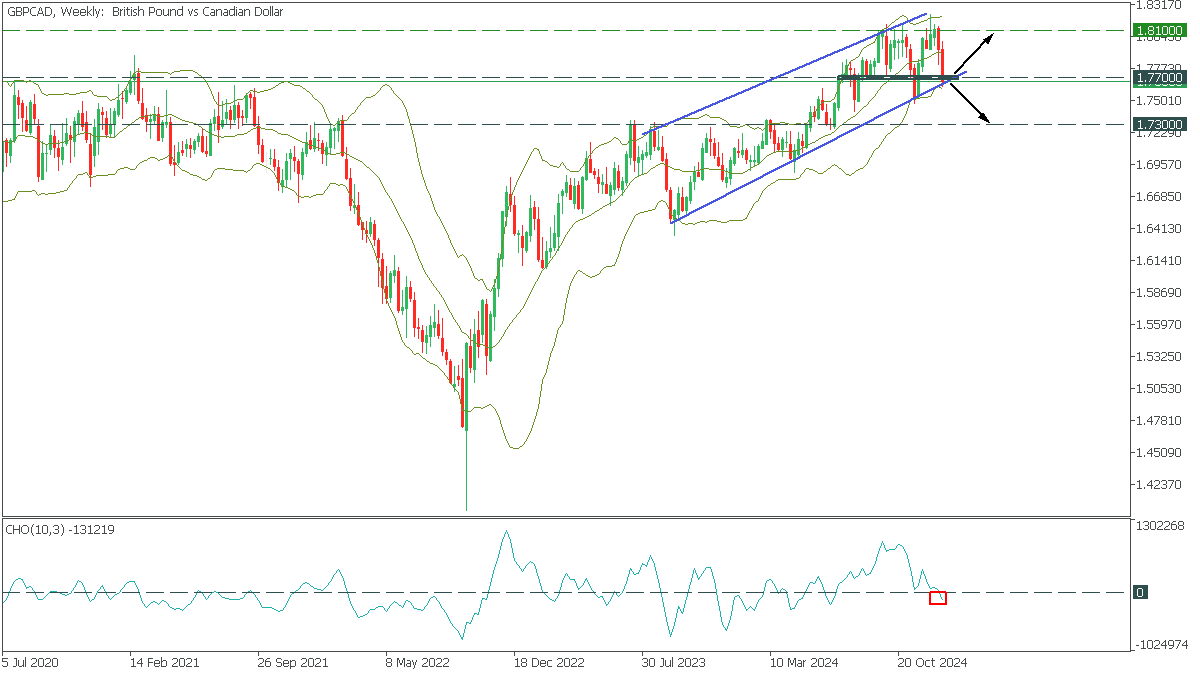
GBPCAD, Weekly
In the Weekly timeframe, GBPCAD has formed an ascending channel pattern. However, the price has fallen to the lower trendline, and the lower Bollinger line is being tested, indicating oversold conditions. The Chaikin indicator fell below 0, indicating bearish sentiment.
- A break of the trend line below 1.7700 will open the way to 1.7300;
- A rebound from the trendline will take GBPCAD back to 1.8100;
USD/JPY Hits New High, But Caution Lingers
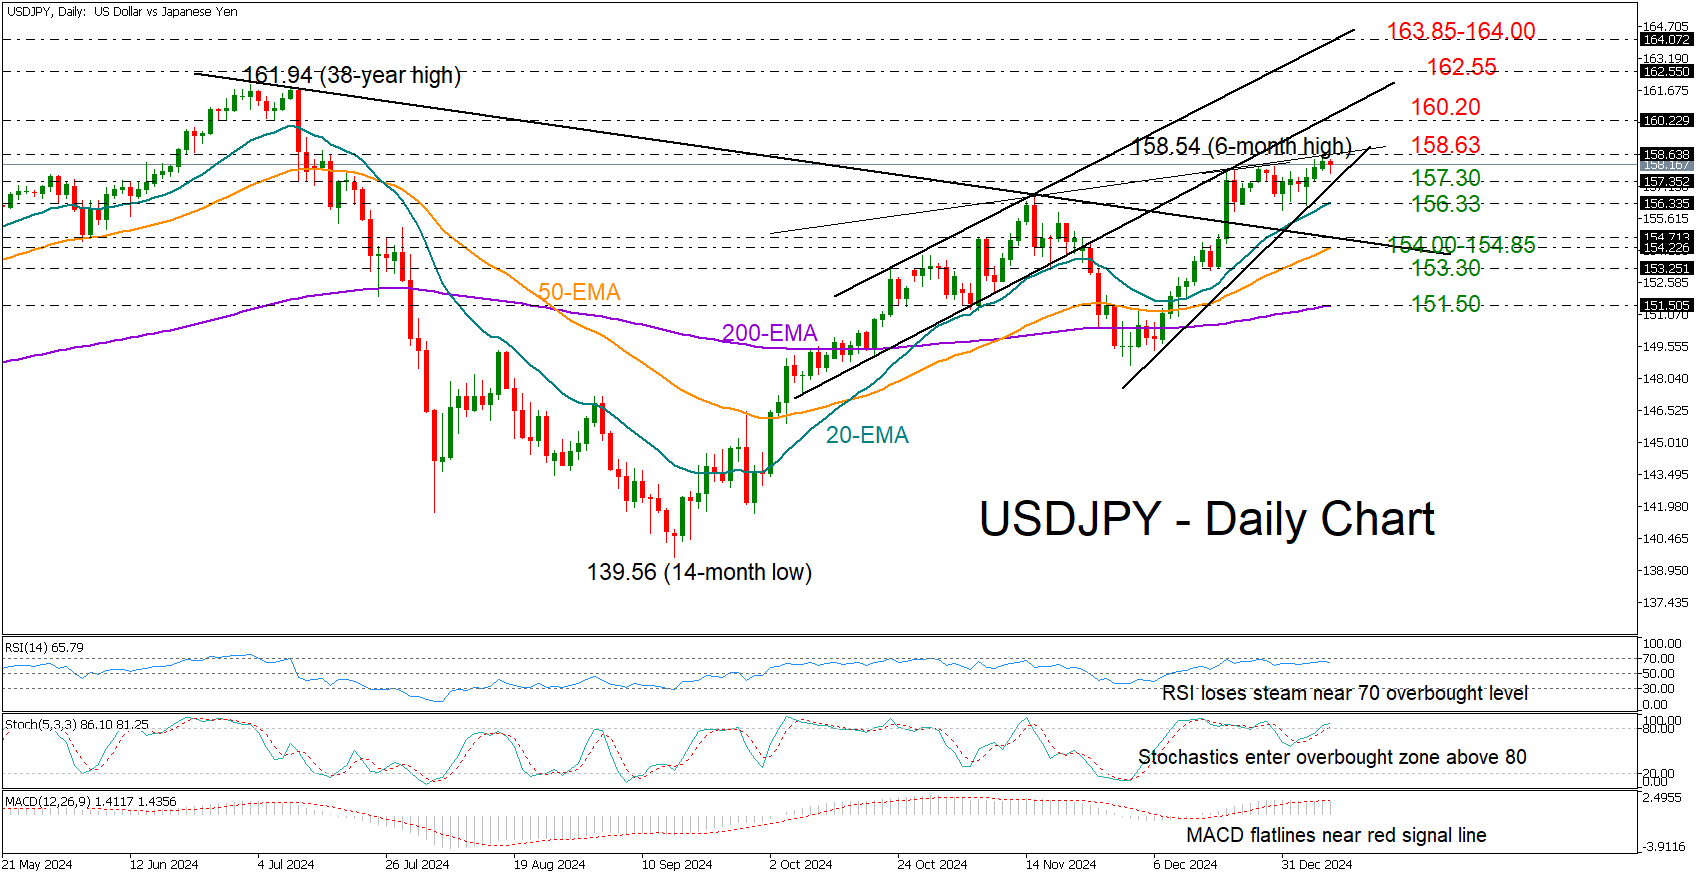
- USDJPY takes a pause after reaching a six-month high.
- Resistance at 158.63, Support between 156.33-157.30.
USDJPY has been steadily climbing over the past few days, hitting a six-month high of 158.54 on Wednesday. However, it couldn’t push past the resistance line formed by the November highs, suggesting the market is staying cautious for now.
With the RSI and stochastic indicators hovering near overbought levels, the pair could face a pullback or some sideways movement. The support trendline at 157.30 and the 20-day exponential moving average (EMA) at 156.33 could cool down selling interest in this case. Otherwise, the pair could drop toward the broken resistance trendline at 154.70, where the 50-day EMA is converging. If the 153.30 level is breached as well, selling pressures could pick up steam toward the 200-day EMA seen around 151.50.
On the upside, if the price closes decisively above 158.63, it could move toward the 160.20 mark, which was last seen in July and April 2024. Moving higher, the bulls may take a breather around 162.55 before heading for the 163.85-164.00 area, where a previous resistance trendline is located.
In short, USDJPY is still trending upward, but there are signs of caution. Sellers are unlikely to step in unless the price drops below 156.30.
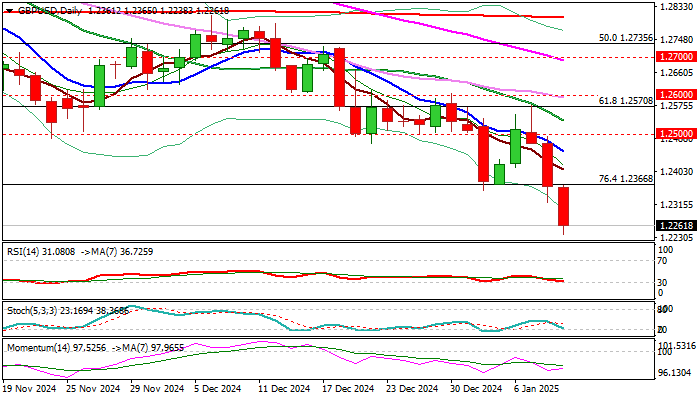
GBP/USD: Hits New Multi-Month Low, Bears Eye 1.20 Zone Targets
Cable fell to 14-month low on Thursday morning, as steep bear-leg off 1.2575 lower top extends into third straight day.
Strengthening dollar, crisis about Britain’s fiscal outlook and uncertainty over Trump’s tariff plan, were the key contributors to pound’s latest weakness.
Bearish technical picture on daily chart, as well as a number of weekly MA bear-crosses, add to negative near term outlook, with break below former low at 1.2299 (Apr 21) also generating a negative signal.
Bears eye targets at 1.2050 zone (Oct 2023 higher base) and psychological 1.2000 support, with limited corrective actions likely to precede fresh push lower.
Initial barrier lays at 1.2360 zone (broken Fibo 76.4% support) with extended upticks to stall under 1.2500 zone (former base / round figure) and offer better selling levels.
Res: 1.2360; 1.2400; 1.2455; 1.2500.
Sup: 1.2238; 1.2186; 1.2050; 1.2000.
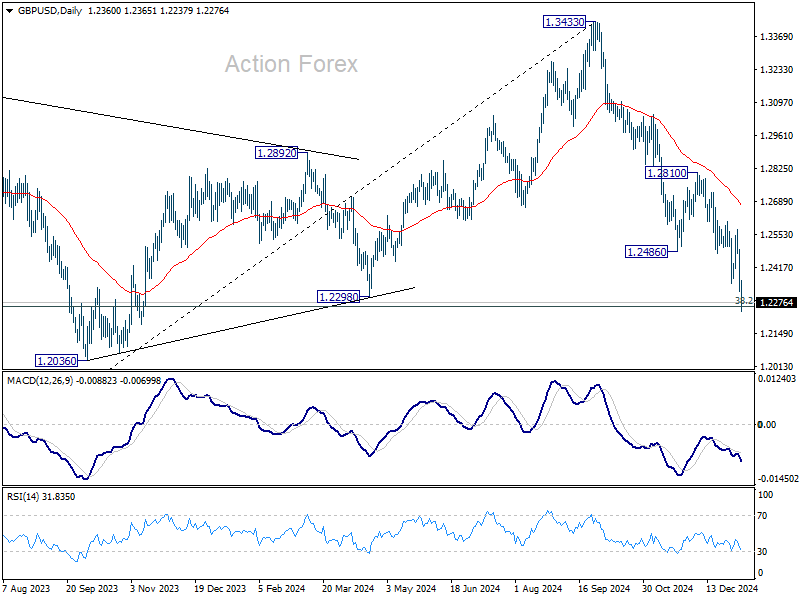
GBP/USD Daily Outlook
Daily Pivots: (S1) 1.2292; (P) 1.2393; (R1) 1.2465; More...
GBP/USD's fall from 1.3433 continues today and breached 1.2256 fibonacci level. There is no clear sign of bottoming yet and intraday bias stays on the downside. Sustained trading below 1.2256 will carry larger bearish implications. On the upside, break of 1.2376 will turn intraday bias neutral first. Further break of 1.2486 support turned resistance should confirm short term bottoming.
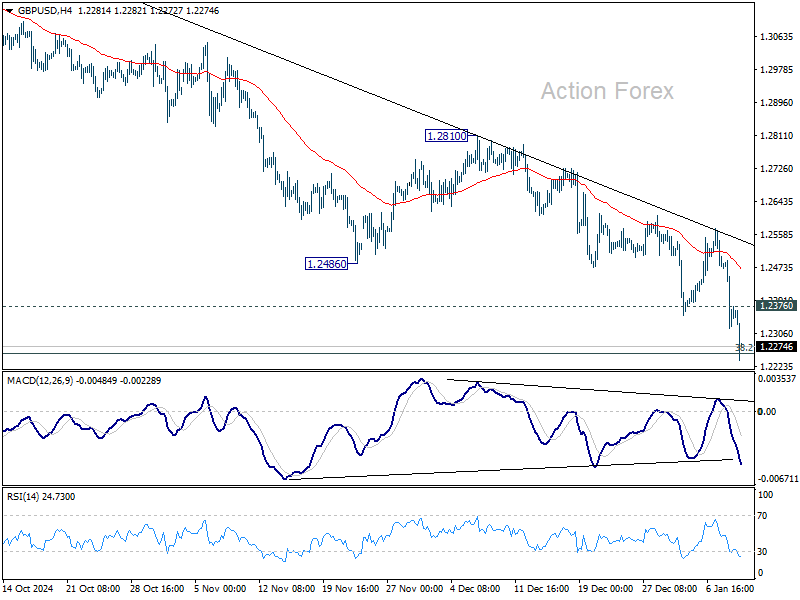
In the bigger picture, price actions from 1.3433 medium term are seen as correcting whole up trend from 1.0351 (2022 low). Strong support is still expected from 38.2% retracement of 1.0351 to 1.3433 at 1.2256 to bring rebound to extend the corrective pattern. However, firm break of 1.2256 will argue that the trend has reversed and target 61.8% retracement at 1.1528.
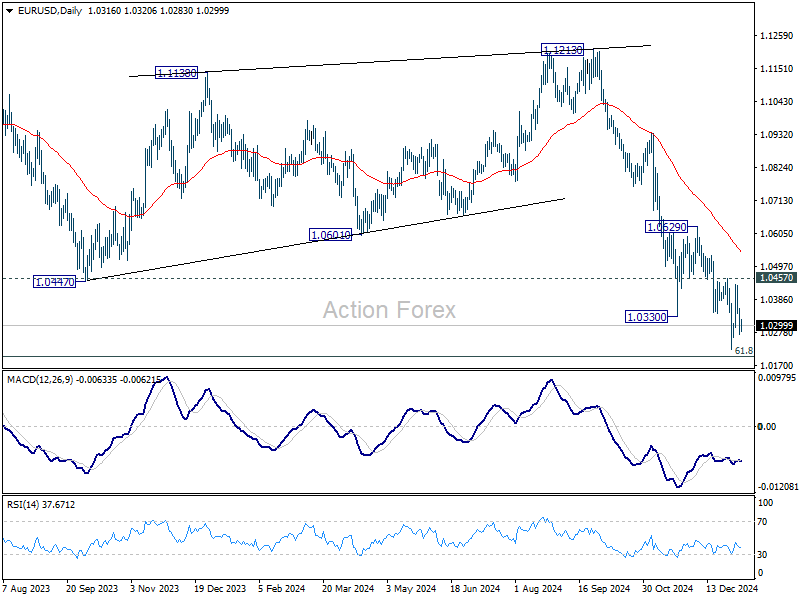
EUR/USD Daily Outlook
Daily Pivots: (S1) 1.0276; (P) 1.0317; (R1) 1.0361; More...
EUR/USD is still bounded in range trading above 1.0223 and intraday bias stays neutral. Outlook also stays bearish with 1.0457 resistance intact. Firm break of 1.0223 will resume the fall from 1.1213. However, sustained break of 1.0457 will confirm short term bottoming, and turn bias to the upside for 55 D EMA (now at 1.0542).
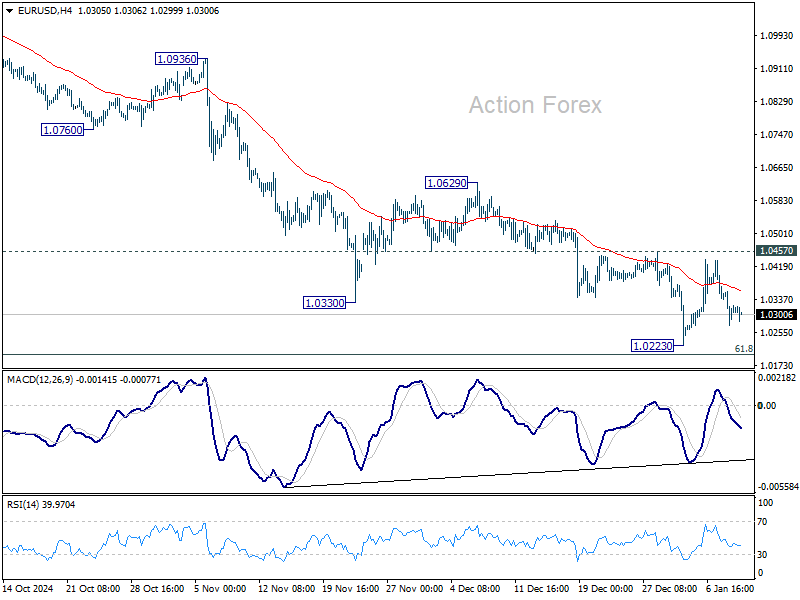
In the bigger picture, fall from 1.1274 (2023 high) should either be the second leg of the corrective pattern from 0.9534 (2022 low), or another down leg of the long term down trend. In both cases, sustained break of 61.8 retracement of 0.9534 to 1.1274 at 1.0199 will pave the way back to 0.9534. For now, outlook will stay bearish as long as 1.0629 resistance holds, even in case of strong rebound.