Sample Category Title
Time for NFP, Buckle Up
In focus today
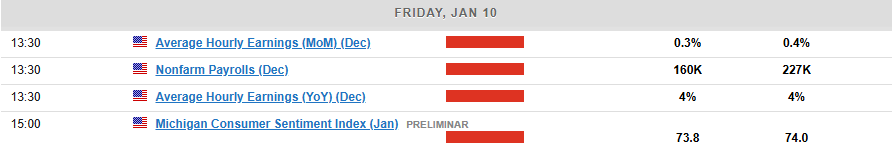
The most important data release of the day will be the US December Jobs Report. We expect nonfarm payrolls growth to slow down to +170k (from +227k), see unemployment rate steady at 4.2% and average hourly earnings growth at +0.3% m/m SA. University of Michigan's preliminary consumer sentiment survey for January is also due for release later in the afternoon.
In Denmark, we get December inflation data. We expect an increase to 1.9% from 1.6% in November. Much of the increase is driven by a base effect from falling energy prices in December 2023. The scale of the food sale (not least on butter) is always a joker in December.
In Norway, inflation data for December is released. There are always significant effects on the inflation figures in December amid the effects of Christmas shopping. Card data suggests that consumption in December was moderate, at least until the last weekend before Christmas. In addition, we saw less price reductions than usual during Black Week. Overall, we therefore believe that core inflation slowed to 2.8 % y/y in December.
In Sweden, November's batch of Swedish macro data is on the agenda, including the GDP-indicator, Production Value Index (PVI) and household consumption. The two prior GDP-readings have signaled negative monthly growth and was further corroborated by negative readings for both PVI and the consumption indicator in October. As the weak Swedish growth, and repeatedly postponed recovery, have been a key reason behind the Riksbank's previous monetary policy stance, today's numbers are likely to carry some weight for the January meeting. Especially if they continue to disappoint given the Riksbank's recent hawkish shift in communication. However, the GDP-indicator is notably unstable and subject to heavy revisions, so interpret with caution. The Nation Debt Office will also release their latest, and 2024's last, monthly report on the net borrowing requirement. Up until and including November, the budget surplus sums up to SEK 22.9bn. However, with a forecasted deficit (and hence borrowing requirement) of SEK 108bn for December, Sweden is heading for a deficit for the full year 2024, following three years of budget surpluses.
Economic and market news
What happened overnight
In China, PBOC said that it has halted its buying of treasury bonds until an "appropriate time" due to supply shortage on the market. The decision follows months after the announcement from PBOC that they would start purchasing bonds as part of measures to improve liquidity management. Chinese yields jumped somewhat on the message.
What happened yesterday
In the euro area, retail sales rose 0.1% m/m SA in November following a decline of 0.3% m/m SA in October. The positive rebound trajectory that retail sales have been on since H2 2023 has thus faded recently like the development in consumer confidence. This is a concerning sign for the GDP outlook since consumption is expected to be the key driver of the recovery in 2025.
In Germany, industrial production rebounded in November with production rising 1.5% m/m SA following a decline of -0.4% m/m SA in October. The increase was broad-based across manufacturing, construction, and energy production. The negative trend in industrial production has become less severe in H2 2024. The same picture is shared when looking at "truck toll mileage" which has stabilised at a low level. These hard data points contrast somewhat with the continued weak PMIs. Overall, we expect the negative trend in industrial production to continue, likely resulting in a small decline in GDP in both Q4 and Q1 2025 before lower policy rates and rising real wages should give temporary boost to growth in the second half of this year and in 2026.
In the UK, GBP FX and Gilts remained under pressure with the 30Y Gilt yield trading at its highest level since 1998 above the 5.35% mark. Amid a backdrop of global financial conditions tightening and rates ticking higher, the UK is left vulnerable given its fragile fiscal position due to its large public debt and deficits. The Labour government's expansionary budget from the end of October has come under pressure with funding costs soaring together with weaker than expected growth since the announcement of the budget. As we have previously argued, we think the government is set to either roll back some of its measures or hike tax further at the next fiscal event in March. We remain cautiously optimistic that the move in UK space is overdone, but stress that if risk appetite continues to sour the moves could continue.
On the geopolitical front, we published our revamped Geopolitical Radar yesterday. The key things to look out for in January are Trump's inauguration, the expiry date of Hezbollah-Israel ceasefire a few days later and whether the EU and China can make any progress in tariff talks. Please see the revamped edition here Geopolitical Radar, 9 January.
Equities: Global equities were flat yesterday, with Europe higher, Asia lower, and the US closed. In Europe, we observed some improvement in sentiment during the day. However, it was not an outstanding day on the European macro front. Nevertheless, European equities have been performing well lately, outperforming their US counterparts. This indicates how low the consensus expectations for Europe currently are.
In Europe yesterday, the STOXX 600 rose by 0.4%, the FTSE 100 increased by 0.8%, the DAX remained unchanged, and the CAC gained 0.5%. Asian markets are lower again this morning, and the same applies to US futures, while European markets are marginally higher.
FI: The upward pressure on EGB yields continued throughout Thursday's session, with market attention focused on the substantial supply entering the market. Debt sustainability is currently the key theme in the UK market. Yesterday, the 30Y Gilt yield reached its highest level since 1998. As global financial conditions tighten due to higher real yields, the question arises whether and how central banks should respond. For now, members of both the Fed and ECB seem hesitant, likely because they are waiting to see how persistent the recent move will be. However, the UK Treasury issued a public statement yesterday asserting that a repeat of the 2022 Gilt crisis is unlikely, as institutional investors currently have significantly higher levels of liquidity and collateral.
FX: Lower trading volume and more consolidation yesterday as the US markets observed the National Day of Mourning. EUR/USD consolidates around 1.03 and GBP/USD around 1.23. GBP has been the last couple of days' focal point within G10 FX but for today we look towards NFP and the dollar. Scandies found some modest support and NOK/SEK consolidates just shy of 0.98.
NFP to anchor Fed pause, 10-year yield eyes higher level
US non-farm payroll report is taking center stage today as markets look for confirmation of Fed’s anticipated decision to pause rate cuts this month. Recent comments from multiple Fed officials have highlighted a cautious approach to further monetary easing, with a consensus forming that the central bank is nearing a pause in its rate-cutting cycle.
Fed fund futures currently price 93% likelihood of a hold at the meeting, and an in-line or stronger-than-expected jobs report could push this probability closer to certainty.
The broader debate now shifts to two key questions: how long the Fed’s pause might last and how much more easing, if any, will occur this year. Current market pricing indicates a 60% chance of another hold in March, followed by a 53% probability of a rate cut in May. For the rest of 2025, markets see over an 85% chance that rates will remain steady at 4.00%-4.25%.
Following today’s data, the immediate focus is whether the odds of a March hold increase, reflecting an extended pause.
Regarding expectations on the data, for December, headline job growth is forecasted to slow to 150k, with the unemployment rate expected to hold steady at 4.2%. Average hourly earnings are anticipated to rise by 0.3% month-over-month.
While some signals, such as the ISM Manufacturing PMI Employment component falling to 45.3 and ADP private employment growth decelerating to 122k, point to a cooling labor market, others remain robust. ISM Services PMI Employment component held steady at 51.4, and the 4-week moving average of initial jobless claims fell to a historically strong 213k, suggesting resilience and leaving room for an upside surprise in today’s report.
In terms of market reactions, a major focus is on treasury yields. Technically, 10-year yield breached 61.8% projection of 3.603 to 4.505 from 4.126 at 4.683 this week, as rally from 3.603 resumed.
Strong NFP number could push TNX higher, and sustained trading above 4.683 should pave the way towards 100% projection at 5.028, which is close to 4.997 high, and 5% psychological level. Any upside acceleration could realize this target at around the end of Q1.
In any case, outlook in TNX will stay bullish as long as 4.517 support holds, in case of retreat.
Japan’s household spending falls for fourth month, minister flags critical economic transition
Japan’s household spending declined for the fourth consecutive month in November, falling -0.4% yoy. While this was an improvement from October's -1.3% drop and surpassed expectations of -0.8%, it still reflects ongoing consumer caution.
The decline was driven by significant cuts in expenditures on home appliances and food, highlighting weak domestic demand.
Spending on furniture and electric appliances plummeted by -13.8%, marking the third straight month of decline, while clothing and footwear saw a similar drop -of 13.7%, down for the second consecutive month. Food purchases also contracted slightly, falling by-0.6%.
Separately, Economy Minister Ryosei Akazawa acknowledged the challenges, stating that Japan's economy is at a "critical stage" in shifting public sentiment away from deflation and toward sustainable growth driven by higher wages and investment.
USD/JPY Poised for Action: Will NFP Drive More Upside?
Key Highlights
- USD/JPY started a consolidation phase above the 156.20 support.
- A short-term rising channel is forming with support at 157.10 on the 4-hour chart.
- GBP/USD accelerated losses below the 1.2350 support.
- AUD/USD and NZD/USD trade heavily in the bearish zone.
USD/JPY Technical Analysis
The US Dollar remained in a positive zone above 155.00 against the Japanese Yen. USD/JPY climbed above the 156.50 and 157.00 levels before the bears appeared.
Looking at the 4-hour chart, the pair settled above the 157.00 level, the 100 simple moving average (red, 4-hour), and the 200 simple moving average (green, 4-hour). The pair tested the 158.50 zone and traded as high as 158.55.
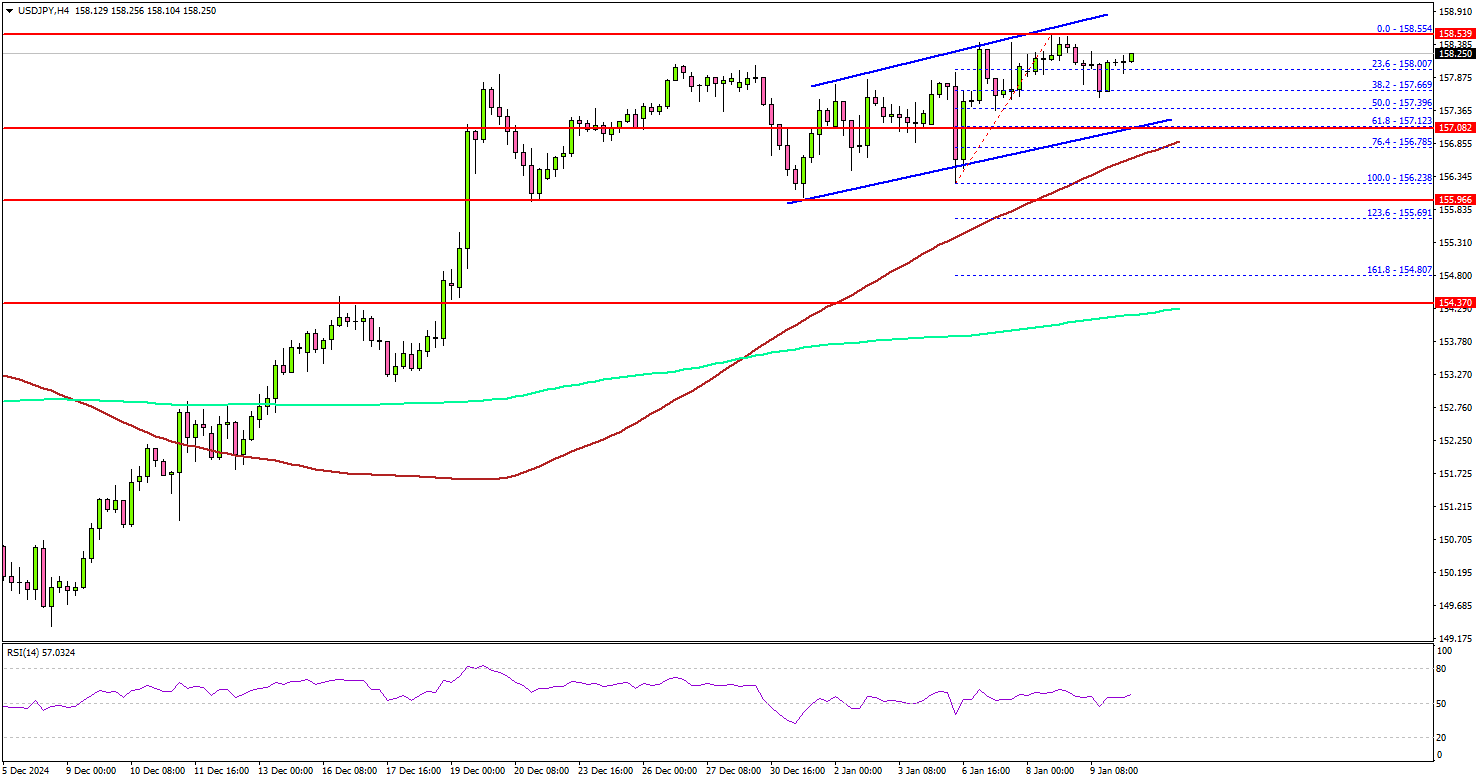
It is now consolidating gains below the 158.50 zone. There is also a short-term rising channel forming with support at 157.10. On the upside, the pair is facing hurdles near the 158.50 level. The first major resistance is near the 159.20 level.
The next major resistance is near the 160.00 level. A close above the 160.00 level could set the tone for another increase. In the stated case, the pair could rise toward the 162.00 resistance.
On the downside, immediate support sits near the 157.10 level and the trend line. The next key support sits near the 156.50 level. Any more losses could send the pair toward the 155.50 level.
Looking at GBP/USD, the pair started another decline and the bears were able to push the pair below the 1.2350 support.
Upcoming Economic Events:
- US nonfarm payrolls for Dec 2024 – Forecast 160K, versus 227K previous.
- US unemployment Rate for Dec 2024 - Forecast 4.2%, versus 4.2% previous.
Elliott Wave View: XAUUSD (Gold) Has Ended Correction and Turned Higher
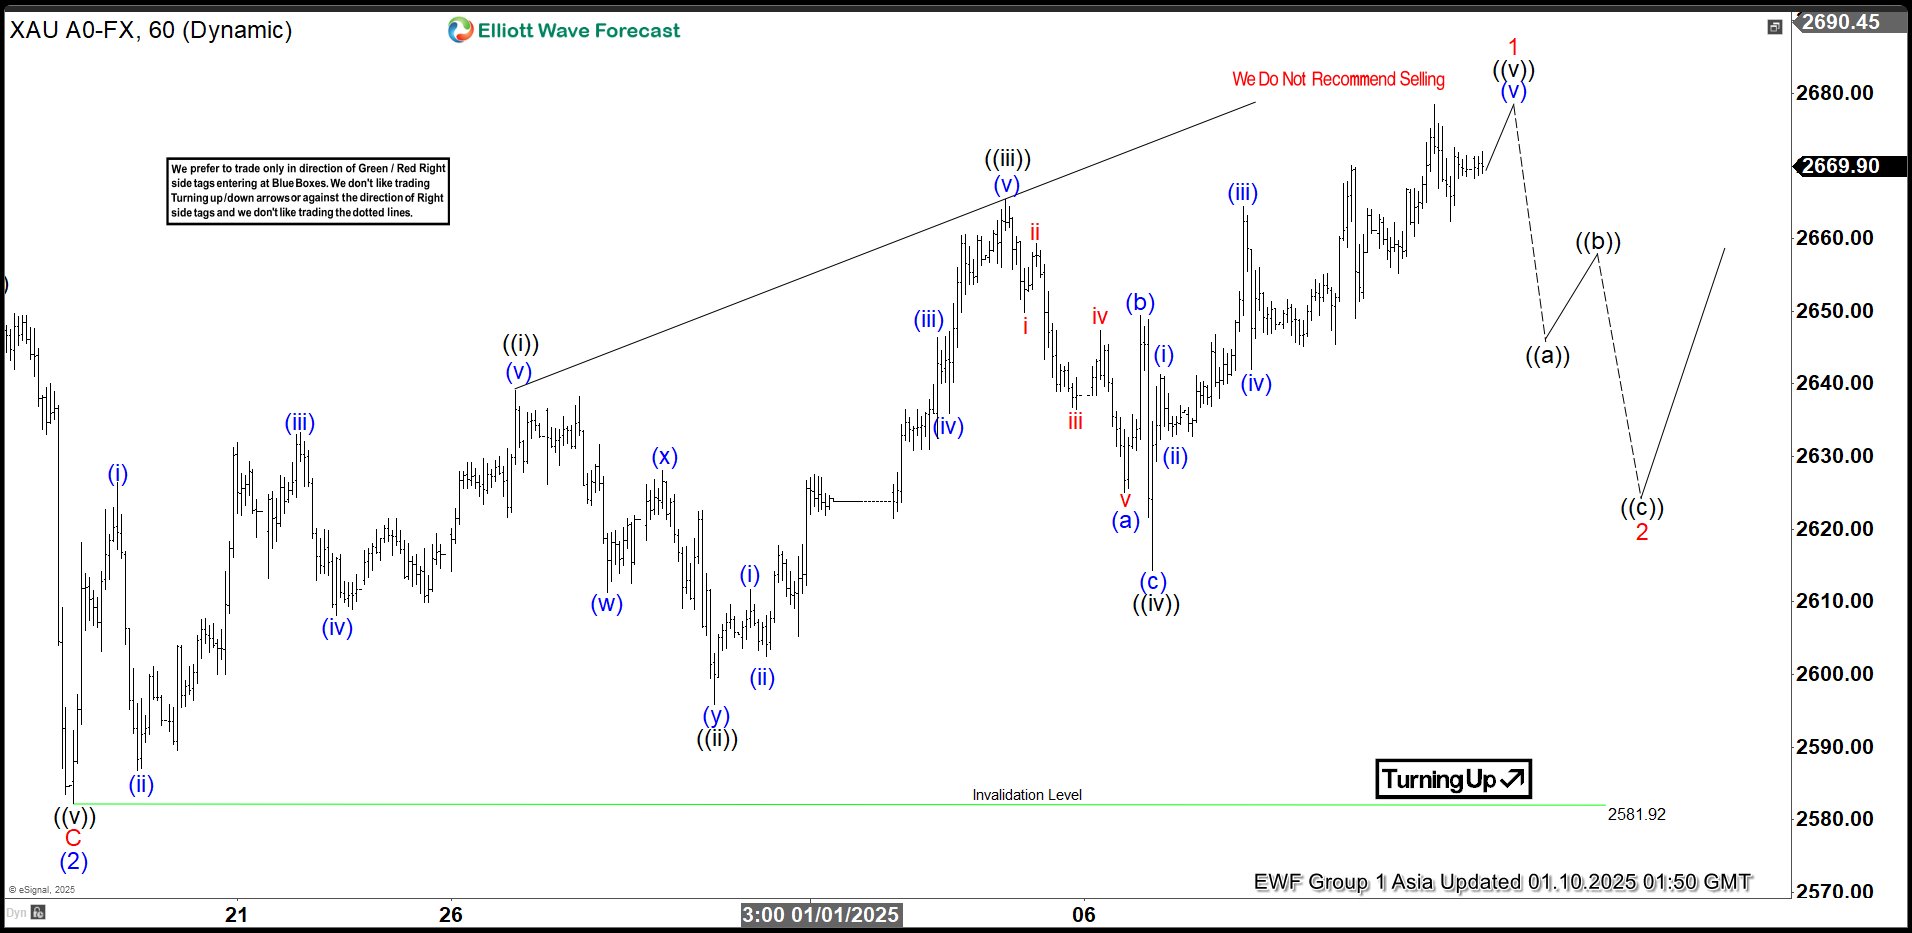
Short Term Elliott Wave view in Gold (XAUUSD) suggests rally from 11.14.2024 low is unfolding as a 5 waves impulse. Up from 11.14.2024 low, wave (1) ended at 2721.41 and pullback in wave (2) ended at 2583.21 as the 1 hour chart below shows. The metal has turned higher in wave (3). Up from wave (2), wave (i) ended at 2626.41 and pullback in wave (ii) ended at 2586.82. Index has resumed higher in wave (iii) towards 2633.29 and pullback in wave (iv) ended at 2608.05. Final leg wave (v) ended at 2639.14 which completed wave ((i)) in higher degree.
Pullback in wave ((ii)) unfolded as a double three where wave (w) ended at 2611.28. Wave (x) rally ended at 2628.12 and wave (y) lower ended at 2595.91. This completed wave ((ii)) in higher degree. The metal has resumed higher in wave ((iii)) towards 2665.33 and pullback in wave ((iv)) ended at 2614.36. Expect the metal to finish wave ((v)) higher soon and this should complete wave 1 of (3). It should then pullback in wave 2 to correct cycle from 12.19.2024 low (2581.9) before turning higher again. Near term, as far as pivot at 2581.92 low stays intact, expect dips to find support in 3, 7, or 11 swing for more upside.
XAUUSD (Gold) 60 Minutes Elliott Wave Chart
XAUUSD Elliott Wave Video
https://www.youtube.com/watch?v=u2aHJgixjik
Bitcoin (BTCUSD) Elliott Wave Forecasting the Decline After Expanded Flat Pattern
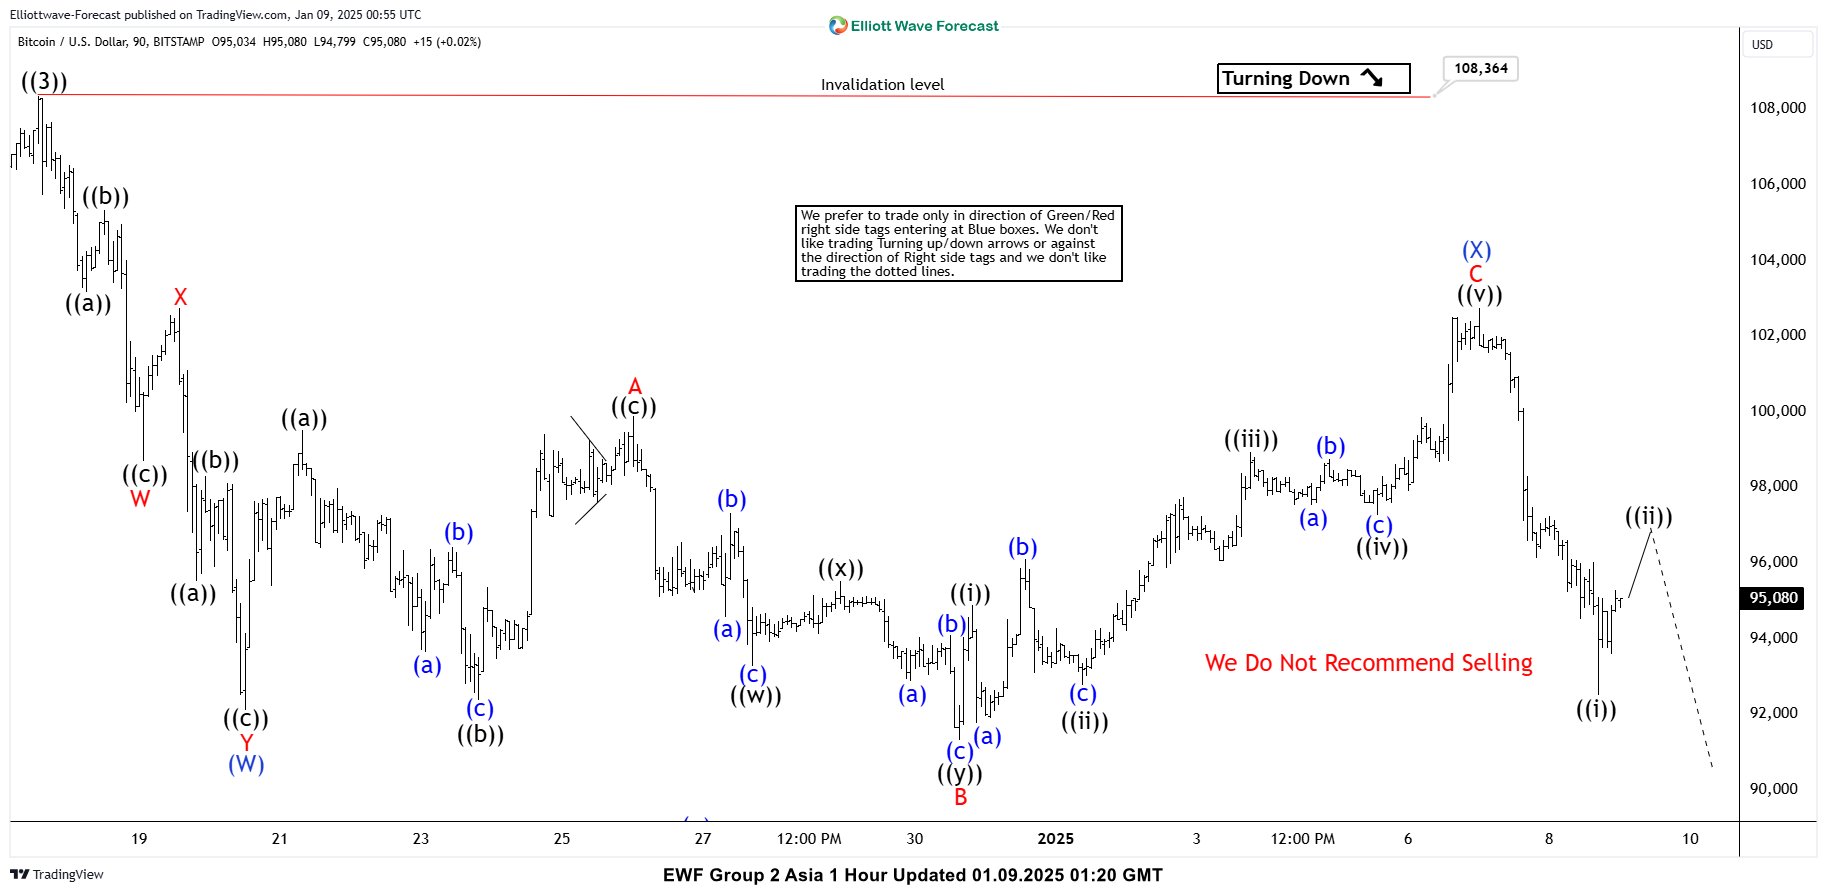
In this technical article we’re going to take a look at the Elliott Wave charts charts of Bitcoin BTCUSD published in members area of the website. As our members know, we generally favor the long side in BTCUSD, and it has recently offered good trading opportunities. However, BTCUSD is currently correcting the cycle from the August low and is not ready for buying at this stage. Recently, we observed a recovery against the 108364 high, which unfolded as an Irregular Flat pattern. Once this flat correction was completed, the crypto declined as anticipated.
Before we take a look at the real market example of Expanded Flat, let’s explain the pattern in a few words.
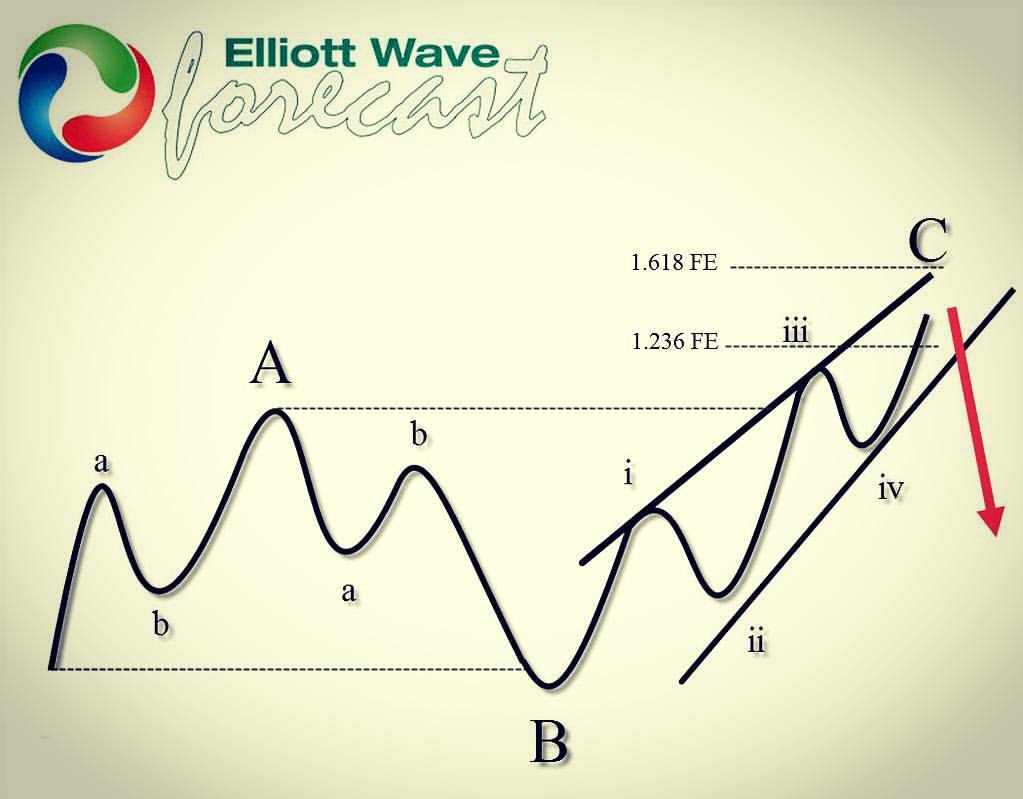
Elliott Wave Expanded Flat Theory
Elliott Wave Flat is a 3 wave corrective pattern which could often be seen in the market nowadays. Inner subdivision is labeled as A,B,C , with inner 3,3,5 structure. Waves A and B have forms of corrective structures like zigzag, flat, double three or triple three. Third wave C is always 5 waves structure, either motive impulse or ending diagonal pattern. It’s important to notice that in Irregular Flat Pattern wave B completes below the starting point of wave A. Wave C ends above the ending point of wave A . Wave C of Flat completes usually between 1.00 to 1.236 Fibonacci extension of A related to B, but sometimes it could go up to 1.618 fibs ext.
At the graphic below, we can see what Expanded Flat structure looks like
Now, let’s take a look what Elliott Wave Flat Pattern looks like in the real market
Bitcoin BTCUSD 1h Hour Elliott Wave Analysis 01.05.2025.
Currently, BTCUSD is correcting the cycle from the 108364 high. The Elliott Wave view suggests that the recovery is unfolding as an Irregular Flat Pattern. When we analyze the lower time frames, we can observe that the inner subdivisions of waves A and B (red) exhibit corrective sequences. Wave B has already broken below the starting point of wave A, while wave C is expected to break above the point of wave A, which is characteristic of an Irregular Flat pattern. At this stage, we see that the C leg is still missing another wave up to complete its structure as a 5-wave move. We recommend our members avoid buying at this stage.
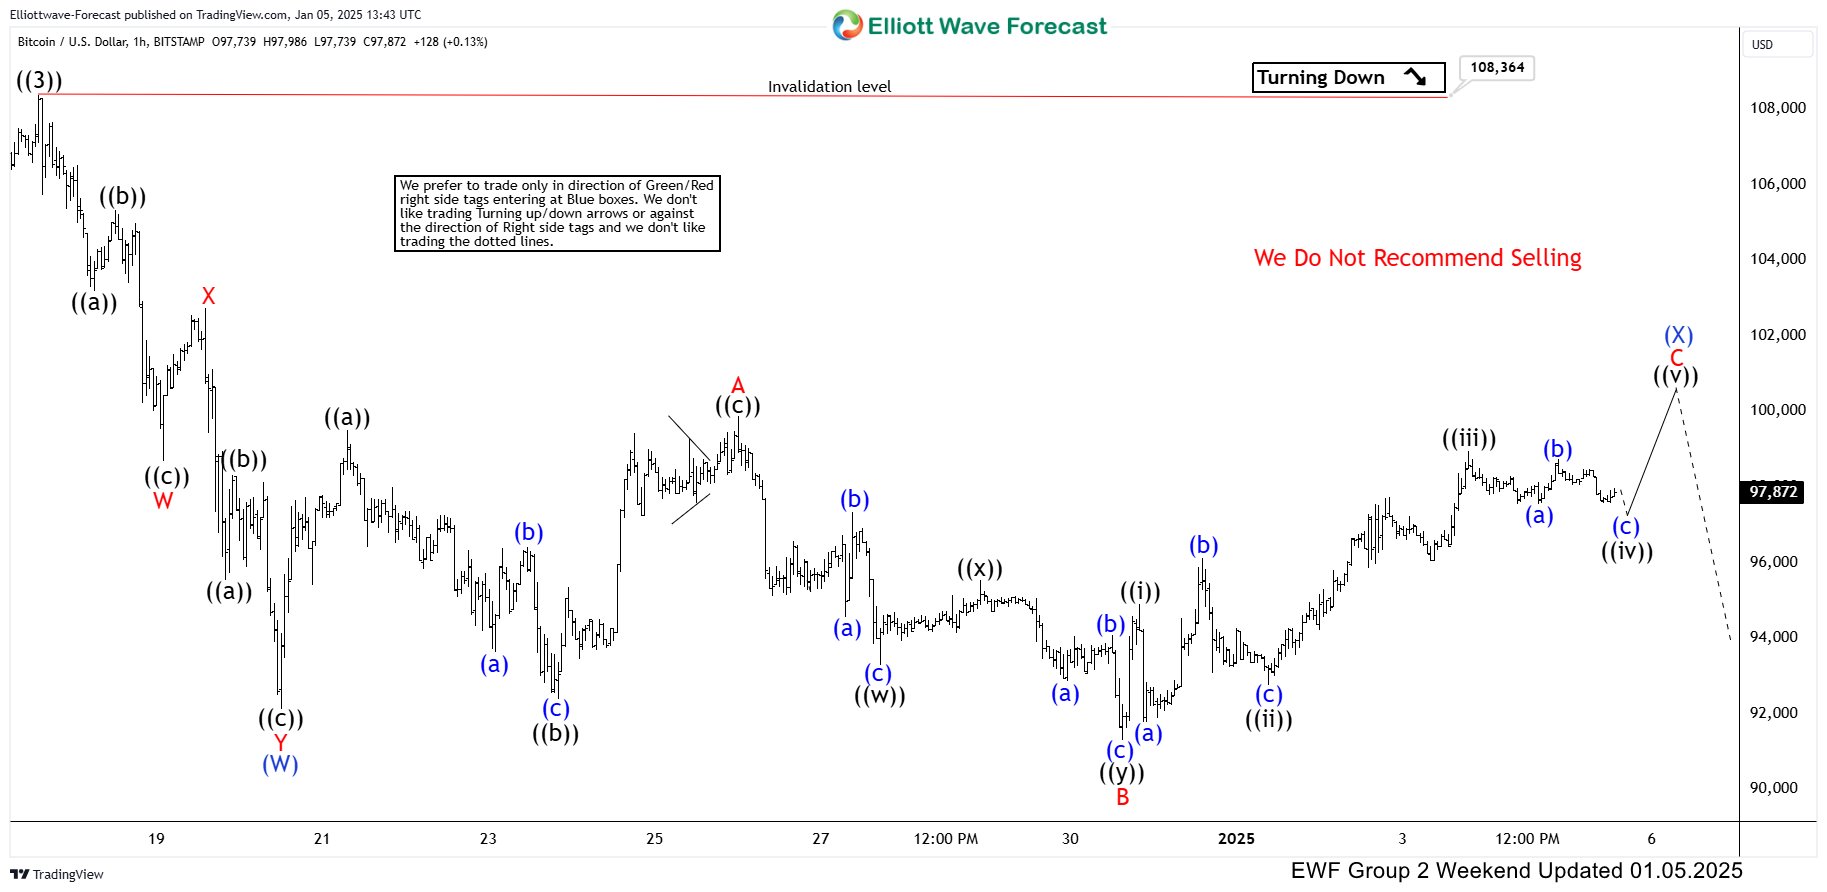
Bitcoin BTCUSD 1h Hour Elliott Wave Analysis 01.09.2025.
Bitcoin made another leg up in wave ((v)) of C, completing the (X) blue recovery at the 102730 high. As anticipated, the crypto turned lower. We are now looking for a break below wave B (red) to confirm that the next leg down is in progress. At this stage, we do not favor selling and would prefer to wait for the (Y) leg to reach the extreme area before considering buying BTC again.
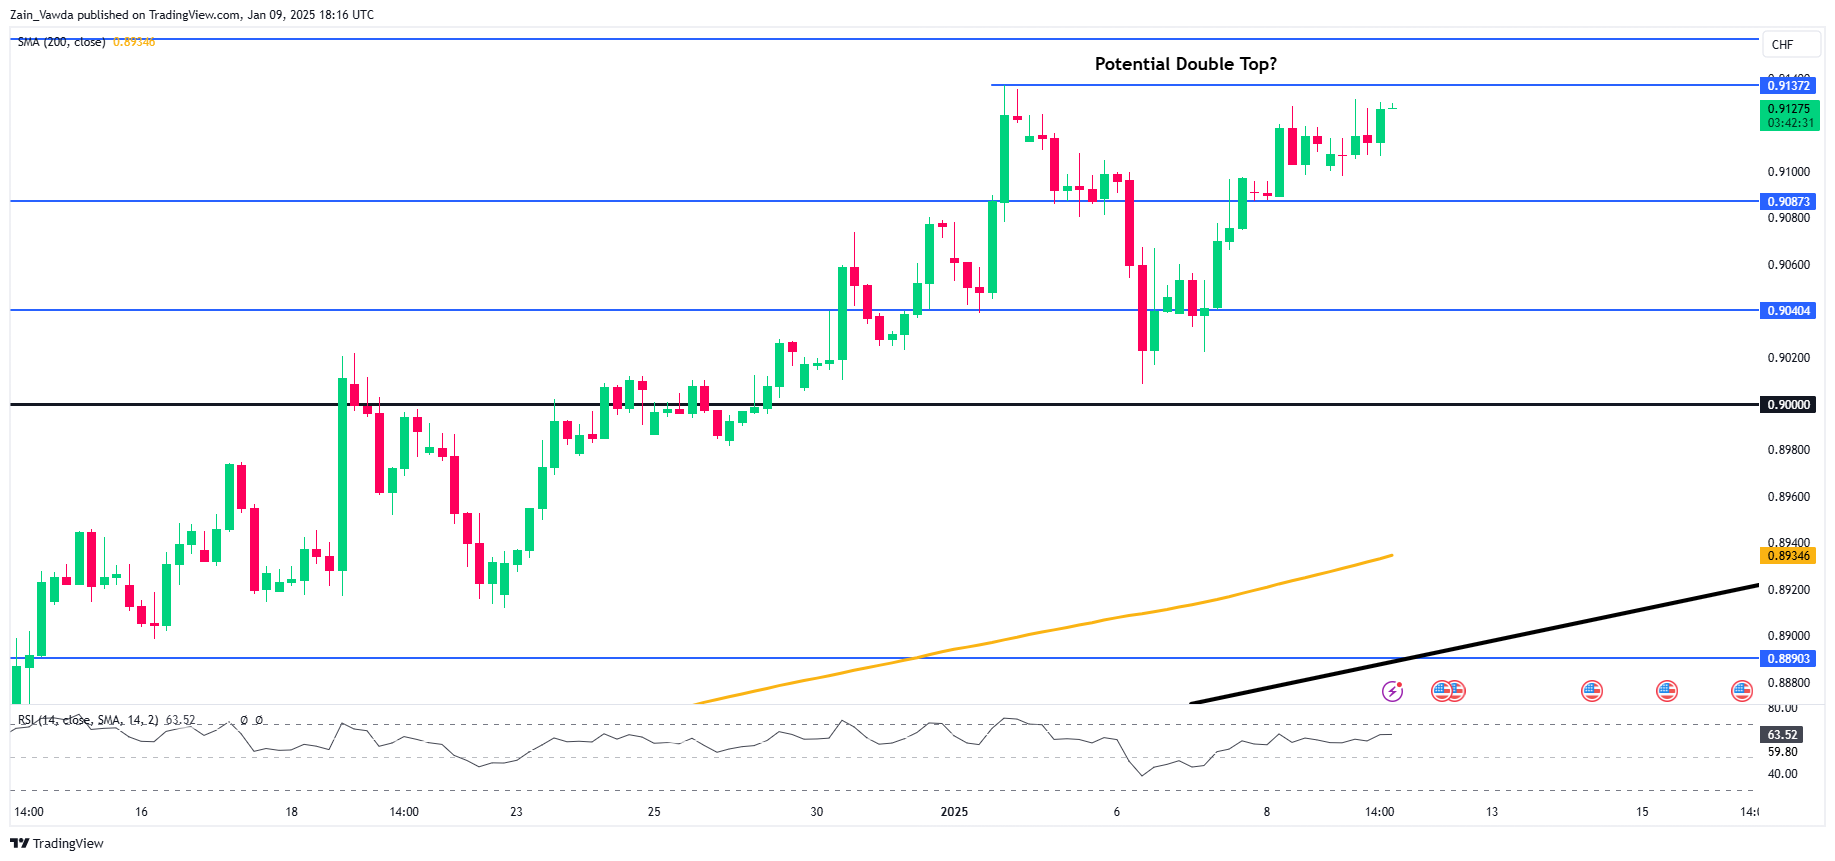
USD/CHF Technical Outlook: Bulls in Charge as Potential Double Top Pattern Forms
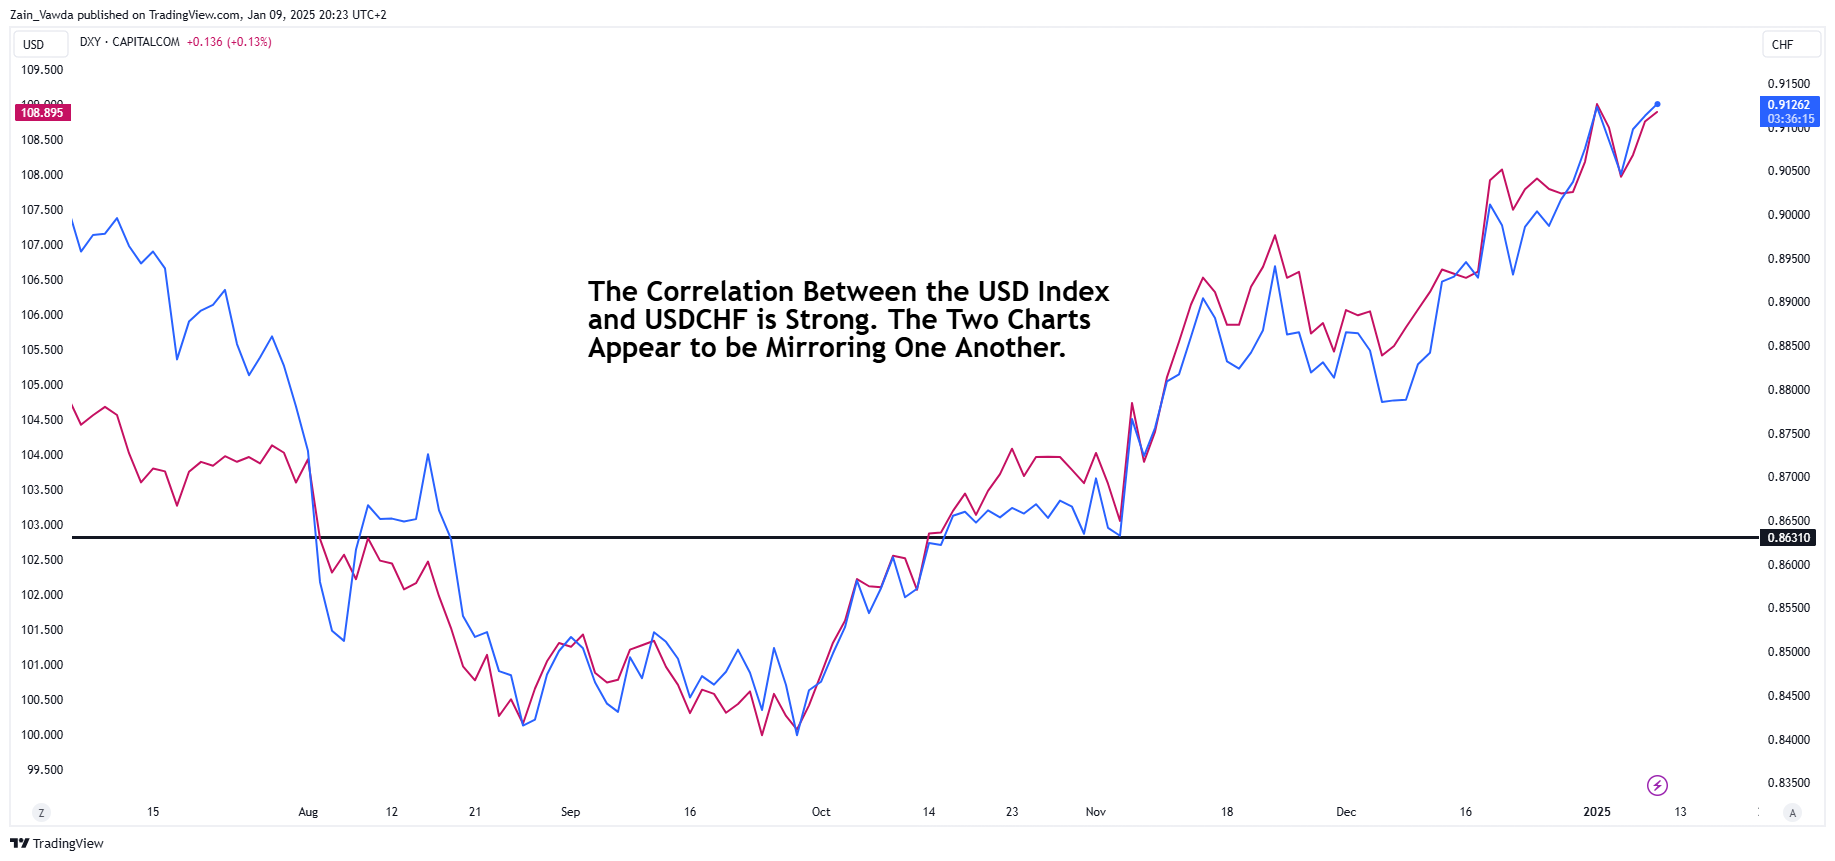
- USD/CHF has been in a strong uptrend since September 2024, largely mirroring the US Dollar Index (DXY).
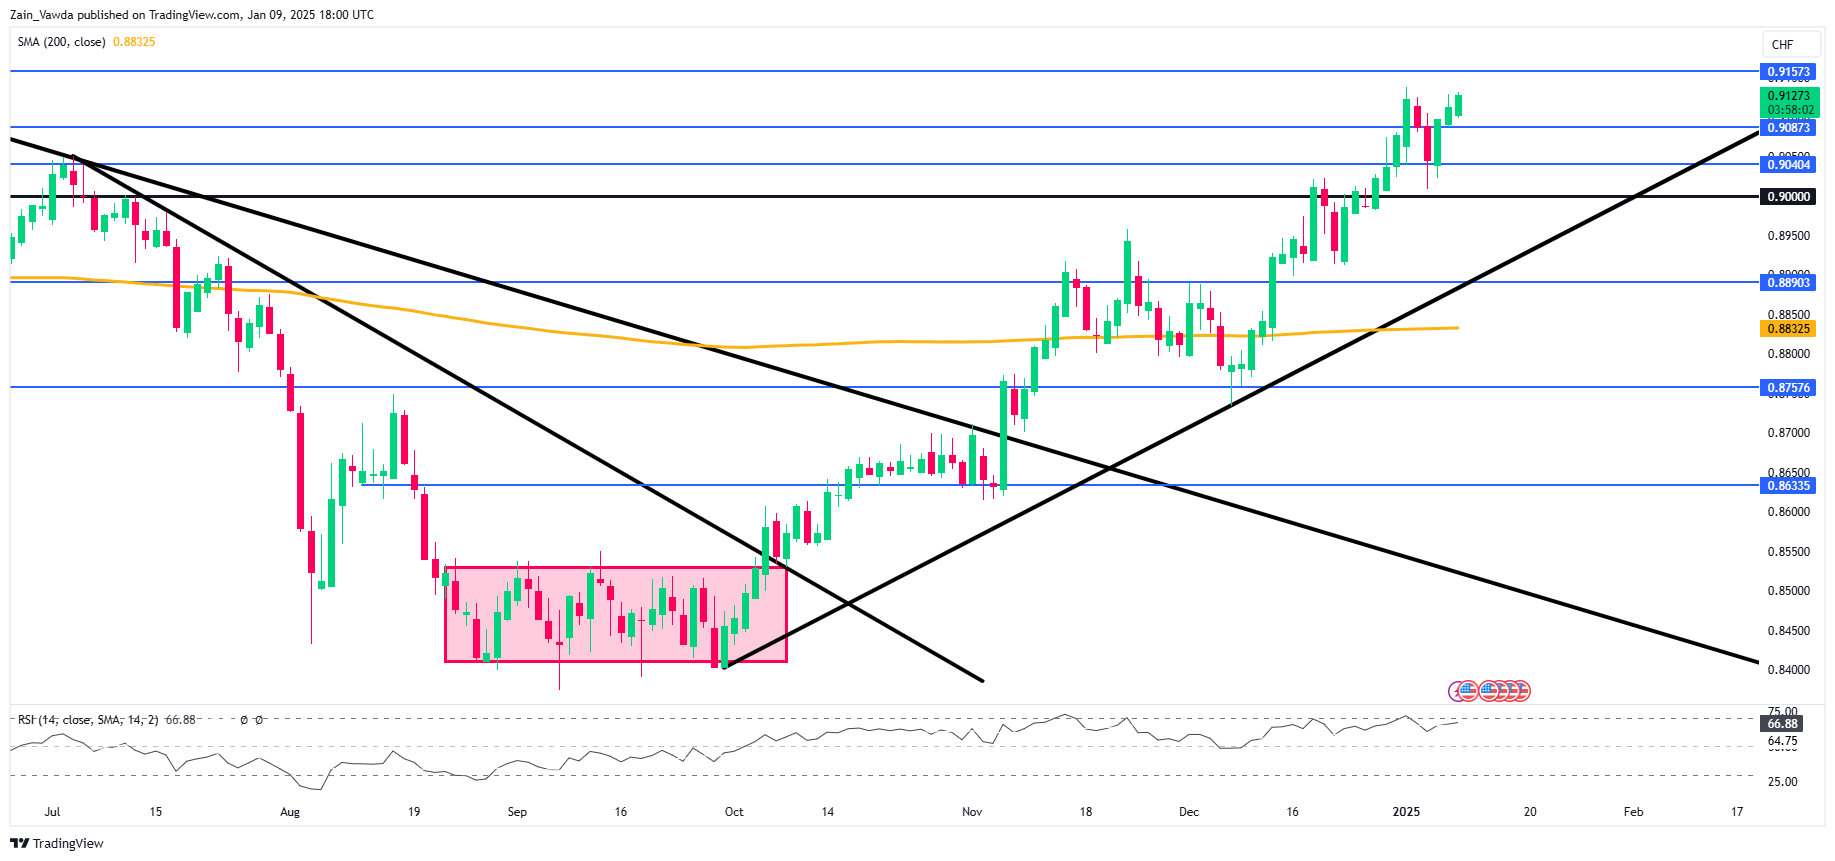
- A potential double top pattern is forming around the 0.9137 resistance level.
- Key support levels to watch are 0.9087, 0.9040, and the psychological 0.9000 handle.
- A break above the 0.9137 resistance could lead to further gains.
USD/CHF has been on an incredible run since bottoming out in September 2024. The rally which has been largely driven by the US Dollar Index has continued with brief pullbacks and pauses as it hovers comfortably above the psychological 0.9000 handle.
In reality if one looks at the US Dollar Index and USD/CHF daily charts they are mirror images of another. A sign of the US Dollars significance in the recent rally. As you can see the below just how correlated the two have been with the USD Index represented by the red/purple line and USD/CHF in the blue line.
US Dollar Index (DXY) vs USD/CHF Daily Line Chart
Source: TradingView (click to enlarge)
The Swiss economy has faced its fair share of challengers but the weakening currency is not one of them. Switzerland, which is viewed as somewhat of an export economy, had been under pressure by those in the export industry as the strengthening Franc left exporters unable to compete.
Markets are pricing in a rate cut from the SNB in March and if expectations around rate cuts from the Federal Reserve continue to be hawkishly repriced, this could leave USDCHF vulnerable to further upside.
US Jobs data due tomorrow could have a significant impact in this regard, as markets return from the US Holiday today.
Technical Analysis
From a technical standpoint, USD/CHF has been on a tear since the back end of September 2024.
More recently however, price has formed a base around the psychological 0.9000 level which is serving as strong support. The relationship with the DXY was shown above and underscores the importance of the index in USD/CHFs next move.
USD/CHF Daily Chart, January 9, 2025
Source: TradingView (click to enlarge)
Dropping down to a four-hour chart and it did appear that USD/CHF might be ready for a deeper retracement on January 6. USD/CHF broke structure by closing below the swing low of January 2, putting the bears in control.
However, instead of printing a lower high, USD/CHF went on to break the previous swing high and bring the bullish momentum back into play.
There is some light at the end of the tunnel for bears however. USD/CHF currently trades at 0.9128 with the most recent high just above at 0.9137.
A rejection of the previous high would lead to a double top pattern print, which is usually a sign that a reversal may be incoming.
A lot of this will depend on the US Dollars performance in the coming days but is worth watching.
A break of the resistance at 0.9137 brings resistance at 0.9157 and potentially 0.9224 into focus.
A rejection and double top print could open the door to a deeper retracement which may find support at 0.9087 before the 0.9040 and psychological 0.9000 come into focus.
USD/CHF Four-Hour Chart, January 9, 2025
Source: TradingView (click to enlarge)
Support
- 0.9087
- 0.9040
- 0.9000
Resistance
- 0.9137
- 0.9157
- 0.9224
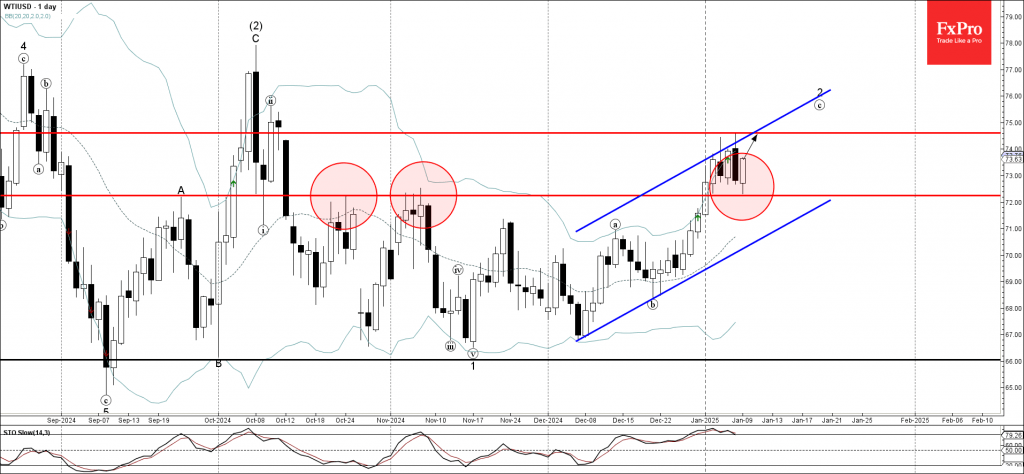
WTI Crude Oil Wave Analysis
- WTI crude oil reversed from support level 72.25
- Likely to rise to resistance level 74.60
WTI crude oil recently reversed up from the key support level 72.25 (former resistance from October and November, as can be seen below).
The upward reversal from the support level 72.25 continues the c-wave of the active ABC correction 2 from the middle of November.
WTI crude oil can be expected to rise in the active minor c-wave to the next resistance level 74.60, coinciding with the resistance trendline of the narrow daily up channel from last month.
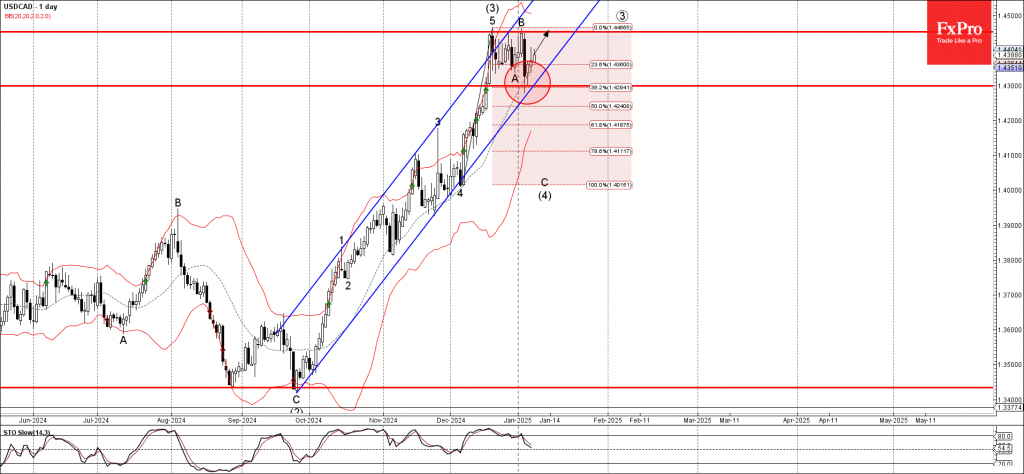
USDCAD Wave Analysis
- USDCAD reversed from support zone
- Likely to rise to resistance level 1.4450
USDCAD currency pair recently reversed up from the support zone located between the support level 1.43000, 20-day moving average and the support trendline of the sharp daily up channel from September.
This support zone was further strengthened by the 38.2% Fibonacci correction of the upward impulse from last month.
Given the clear daily uptrend, USDCAD currency pair can be expected to rise to the next resistance level 1.4450 (which stopped the previous waves (3) and B).