
Sample Category Title
Market Morning Briefing: It Waits For The FOMC Policy Statement Tomorrow
STOCKS
No major movement visible in the stock market ahead of the FED policy meeting due tomorrow. Most of the indices are trading low and are in a corrective mode. There could be some more falls in the near term.
Dow (21513.17, -0.31%) has come off well from the long term resistance of 21600 and could now test an interim support near 21460 which if holds could keep the Dow ranged sideways for a few sessions else the index could head lower towards 21400 over this week.
Dax (12208.95, -0.25%) is looking bearish for the near term and could test 12000-11870 levels in the coming sessions.
Shanghai (3243.10, -0.23%) is down from levels near 3260 which is an immediate resistance as mentioned yesterday. The fall could extend towards 3220 or lower before again resuming the rise towards 3260-3270.
Nikkei (19950.11, -0.13%) is almost stable and could possibly stay above 19750 levels in the near term. Some indication from Dollar Yen and the US-Japan 10Yr yield spread could be crucial to have more clarity on further direction in Nikkei.
Nifty (9966.40, +0.52%) has been moving up in line with our expectations and could test the 10000-10050 levels today. Thereafter a corrective dip is possible towards 9900 in the coming sessions.
COMMODITIES
Bullion has strengthened as no sign of recovery had been seen from Dollar Index (93.80). Gold (1254) and Silver (16.46) are hovering around their crucial resistance of 1260 and 16.50 respectively. Gold looks overbought and immediate trading range could be 1246-1260. A fall below 1246 could take it lower towards 1230 as well. Silver is trading within the range of 16.20-16.50 and well supported by the recent strength in copper. A close above 16.50 could open up 16.85 and 17 levels as well.
Copper (2.75) is moving higher during last few trading sessions, though it is still trading within the range of 2.66-78. Only above 2.78, higher resistances of 2.85 and 2.89 can come into consideration. In the medium term 2.55-60 are going to be a strong support and we will remain bullish while it is trading above those levels.
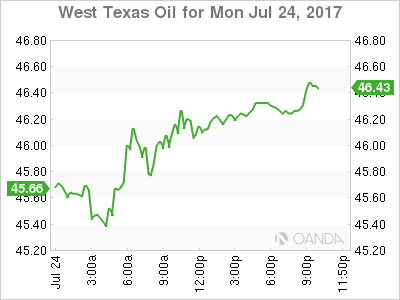
Oil Prices rose higher in line with our expectation as Saudi Arabia pledge to cut export during August to reduce the Global (mainly U.S) crude glut. Both Brent (48.96) and WTI (46.80) are trading within the ranges of 48-50.20 and 45.80-48.30 respectively. We are bullish on oil since 10th of July onwards and there is no reason to change our bullish stance in near term while Brent and WTI are trading above 48 and 46 on a weekly closing basis. Only a close below those levels could bring the near term bearish possibilities into consideration.
FOREX
The majors may not move much today as it waits for the FOMC policy statement tomorrow.
Euro (1.1652) is trading in a very narrow range of 1.16-1.17 for the last 3 sessions and we wait to watch if it manages a break above the final horizontal resistance of 1.1712 while Dollar Index (93.93) remains very weak as usual with the downside target of 93.00 unchanged. The next phase of the price action may be decided by the FOMC policy statement due tomorrow.
Dollar Yen (111.06) has registered a low of 110.58, very close to our target/support of 110.50, before attempting a recovery in line with our expectations but it needs a break above 111.50 to confirm an upside reversal. Till then, the chances of a retest of the support of 110.50-35 remain open.
Aussie (0.7928) is consolidating its recent gains as it trades sideways in 0.7850-0.80 but the rise for 0.80+ levels may resume in the next 2-4 sessions.
Dollar-Rupee (64.34) closed almost flat yesterday after a brief rally above 64.40 but persistent Euro strength keeps Rupee strong. Repeat - The charts themselves suggest greater chances of further downside towards 64.10 in case the immediate Support at 64.28 breaks.
INTEREST RATES
FED policy meeting is due tomorrow. No change is rate is expected.
The US yields have bounced a bit contrary to our expectation of a further fall from current levels. The 10Yr (2.25%) is trading higher from 2.23% seen yesterday and could possibly head towards 2.28% before again coming off from there.
The US-Japan 10YR (2.18%) has moved up as expected and if it continues to rise, Nikkei and dollar Yen could also move up in the coming sessions.
The German-US 10Yr (-1.74%) is testing a decent support near current levels and if that holds, it could bounce back towards -1.70% indicating a rise in Euro in the near term; else the spread could move down towards -1.80% which could bring in some dip in Euro in the near term. Ned to wait and watch for more clarity.
BoJ To Remain Easy, USDJPY, AUDJPY
Today's BoJ meeting revealed little new to traders, although despite speculative positioning increasing their short holdings, price action suggests near-term strength for the Yen.
Whilst BoJ members unanimously agreed policy was to remain easy, they were less congruent on how much information should be provided for a QE winddown due to fears of market turbulence. The key take home here is we can expect policy to remain unchanged for quite some time and forward guidance for a balance sheet reduction may not be their style, as it is with ECB and the Fed.
Summary of the BoJ Minutes
Many members agreed:
- Need to keep policy easy because 2% inflation target is still distant
Several members said:
- Providing information on exit could cause market turbulence
- Companies are taking steps to absorb upward pressure on wages
- Important to continue internal analysis on possible exit strategies and impact
A few members said:
- Important to explain how exit will impact BoJ's finances
One member said (not necessarily the same member for each comment):
- 2% inflation target is a global standard and can contribute to FX stability
- 2% inflation target allows for less freedom and should be more flexible
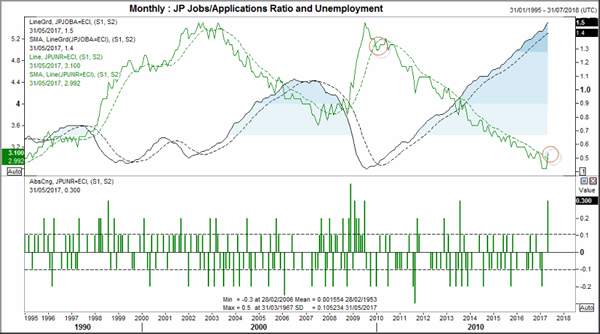
Tomorrow, Japan releases retail sales, employment and inflation data. With low hopes of inflation returning (and BoJ once again lowering and delaying their return to target) it is the employment sector we are most interested in. Overall data remains solid but every turn for the worst must start somewhere, which may have been signalled by unemployment rising above its 12-month average. At 3.1% unemployment remains very low but the 0.3-point rise is large by historical standards, and the move above or below the 12-month MA has been associated with major turning points.
Throughout 2007, unemployment meandered around the 1yr MA before finally rising, but indeed it did rise once it got started. The relationship between unemployment and job/applicants is inverted yet there is no clear relationship between which one turns first. But if we are to see unemployment rise form here we would expect job/applications to move lower over the coming months. This will only undermine reflationary efforts even further.
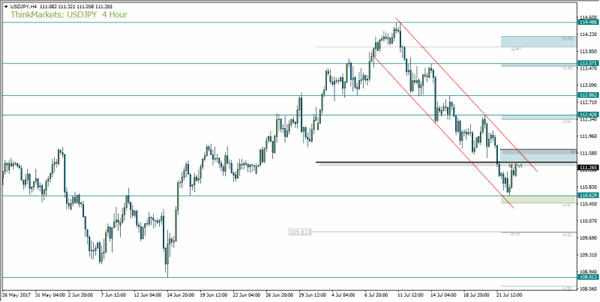
USDJPY found grounding above 110.63 support but whilst we remain below 112.42 the trend is technically bearish. This allows a lot of headroom for upside spikes to consider fading into any rallies around the Fed meeting although for the near-term traders are likely to take notice of the bearish channel. The tight channel also has the monthly and weekly pivot to reaffirm resistance upon a bullish attempt to breakout which leaves USDJPY vulnerable to another leg lower. A break of the 110.63 low assumes a run towards 109.83 where the monthly S1 and weekly S2 provide a tight zone of resistance.
The Fed meeting is a calendar highlight for trades, yet an event which may not provide much more than we already know. Traders are pricing in a 47% chance of a hike in December which brings the 3rd hike this year into question. Data since June has not warranted a hawkish meeting tomorrow, which leaves the remote possibility of balance sheet reduction being mentioned as the potential highlight. It is expected to be the September meeting which provides such information, yet perhaps they'll surprise markets with some details at this year's Jackson Hole symposium on 31st July.
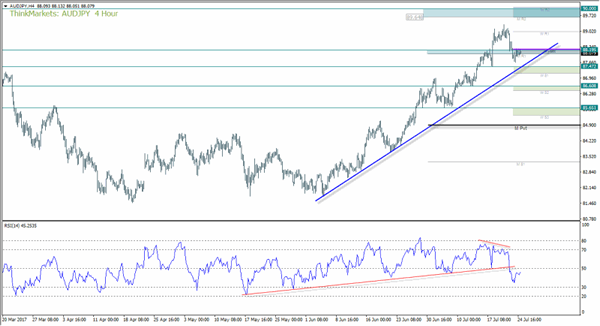
AUDJPY has stabilised below Y82 as it finds resistance at the weekly pivot. A break above this level assumes a bullish resumption although we also warn that the RSI is sending bearish signals for the near-term and we also remain a little extended from the bullish trendline. The bearish divergence which formed prior to the top has been confirmed but the index also broke its own bullish trendline to warn of a change in sentiment at the highs. As RSI has not yet tested 30 and AUDJPY remains elevated, we see downside potential.
For now, however, we prefer to step aside until a clearer picture emerges as the reward / risk potential below the weekly pivot and above the bullish trendline is too low. Instead we prefer to await a break above 82 or a bearish break of the trendline. The latter scenario is not an unreasonable one as the daily RSI has now crossed back below 70 twice since the beginning of July and the peaks do not match the momentum seen on price, which is forming a slight divergence.
Despite bearish speculators piling into Yen short futures, prices have gained these past two weeks and the rally on AUD crosses is looking stretched. Guy Debelle could also jawbone AUD once more tomorrow which leaves AUDJPY vulnerable to be knocked off of its perch.
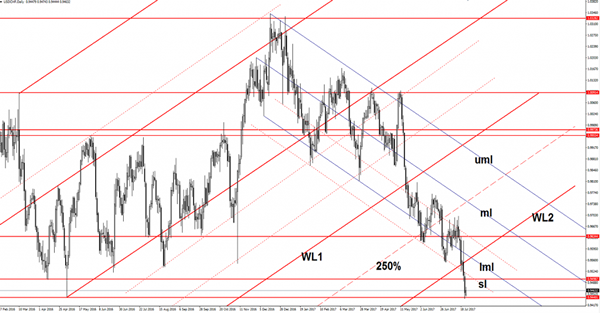
AUD/USD Too Exhausted To Stay Higher?
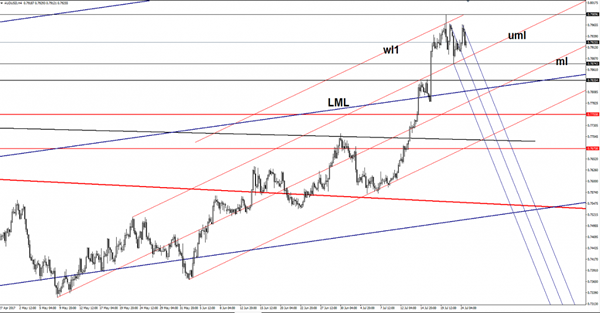
Price decreased in the second part of the day and erased some of the morning impressive gains, the bulls look exhausted on the short term, so a minor retreat is favored.
Price could drop further in the upcoming day after the failure to reach and retest the first warning line (wl1) of the ascending pitchfork and the 0.7989 static resistance. Is moving sideways between the 0.7989 and the 0.7874 level, we'll have a clear direction after a breakout from this range.
A valid breakdown below the upper median line (uml) of the minor ascending pitchfork will open the door for more declines in the upcoming weeks.
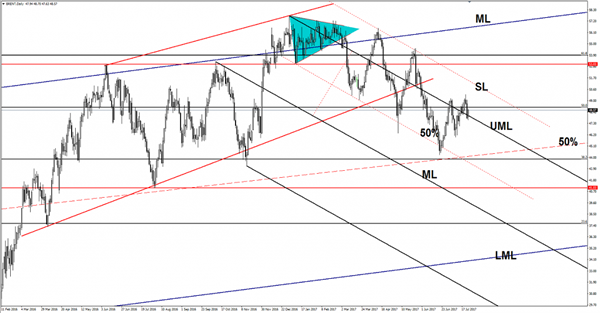
Brent Oil Upside Still Uncertain
The Brent Oil rebounded today and tries to stay in the buyer’s territory, is located above the 48.50 level, but he needs a bullish spark to be able to resume the short term throwback.
Price rallied after the false breakdown below the upper median line (UML) of the major descending pitchfork and now is approaching the 50% retracement level. Only a valid breakout above this level will bring us a good buying opportunity.
Resistance can be found also at the 50.10 previous high and higher at the sliding line (SL), we’ll have a broader rebound if will escape from the descending channel between the SL and the 50% Fibonacci line.
USD/CHF Hit A Long Term Support
The currency pair decreased after the yesterday's massive drop, but this bounce back could be only temporary if the if the dollar index will slide further in the upcoming period. Price has touched the 0.9440 long term support, technically we may have a rebound on the short term, but the rate remains under massive selling pressure.
Right now is better to stay away from this pair because we don't have any trading opportunity, only an accumulation movement will announce a potential upside movement. Continues to move sideways on the long term, the 0.9440 represents the sideways movement downside line.
Price increased as the USDX increased as well a little today, unfortunately the US data continues to come in mixed and fails to boost the greenback. The US existing Home Sales dropped from 5.62M to 5.52M in June, the indicator has come much below the 5.59M estimate, while the Flash Services PMI remains on hold at 54.2 points for the second month in July. The Flash Manufacturing PMI increased from 52.0 to 53.2 points, beating the 52.3 estimate.
Could rebound if will fail to close on the 0.9440 major static support, you can see that we had a false breakdown below this level in the yesterday's session.
I hard to say that we'll have another leg higher from this level, that's why we have to stay away right now till we'll have a fresh trading signal.
GBP/JPY Daily Ascending Triangle
Good morning traders,
After returning to daily resistance, one thing we haven't talked about in GBP/JPY, is the huge ascending triangle pattern that has formed.
Take a look on the daily chart below:
GBP/JPY Daily 2:
If you compare where we are now to the horizontal resistance level that we've been talking about shorting on our previous blog (linked to above), you can see that the trading idea has been playing out nicely.
But if price is going to print a daily lower low then it will have to break through trend line support at the bottom of the triangle.
Trump And Trepidation
Trump and Trepidation
The high level of trepidation continues to weigh on market sentiments as congressional hearing of White house advisors all but guarantees some headline risk and a possible escalation of the Russia- Gate bluster. Risk sentiment is indecisive due to the political commotion in Washington but with so much USD risk to roll out including FOMC, Key Macro data( Q2 USD GDP) amidst a busy week for US corporate earning, Investors have been reluctant participants so far this week showing a minimal appetite for markets in general.
FX markets are glued to the events at hand and keenly focused on the Greenback which has bounced off last weeks lows bolstered by modest profit taking. But the market remains extremely dollar bearish due to the never-ending Trump risk and the recent run of weak to average US economic data.But given investors are showing little moxy to push the market in one direction or the other, they’re likely adopting a prudent wait and see strategy until we get through this week’s key event risks.
While there’s been little discussion about this week’s FOMC so far and If I don my rose-colored glasses, it could prove USD supportive more so if the Feds give clear signal towards balance sheet reduction in September. Also, while the Feds have telegraphed their inflationary view at every opportunity, any comments re affirming inflationary pressures are building will be deemed supportive for the Greenback.
EURO
Despite a wave of profit taking overnight , momentum still suggests a push higher, but after struggling to navigate the 1.1675-80 speed bump and the July Markit composite PMI coming in a bit below market expectations, traders booked profits. But price action in Asia could be telling as the dip in the Euro remains well supported so far suggesting traders are reloading long Euro ahead of the FOMC.
Australian Dollar
The lack of follow through on Debelle’s dovish remarks has added to more frustration for the Aussie bears as the broader USD weaker narrative remains the primary focus. But after last weeks post -RBA minutes frenzy, there’s been minimal action, But for the bears the favour the Aussie lower against the possible .8000 backdrop, I suspect they will remain dormant going into CPI and Low on Wednesday CPI and Lowe
Japanese Yen
The USDJPY correlation with ten-year yields remains tight so expect the pair to remain guided by broader risk moves. But with the perpetual Trump headline risks and with Fed policy coming under increased scrutiny, a delay in announcing balance sheet reduction and or suggestions that inflation has disappointed for more than transitory reasons.The greenback will fall off the cliff.
USD/CAD Canadian Dollar Higher As Oil Surges After OPEC Comments
CAD appreciates on oil surge and continuing US political uncertainty
The Canadian dollar continues to strengthen versus the US dollar on Monday. The loonie has traded higher after the Bank of Canada (BoC) quickly went from neutral to hawkish in mid June with an interest rate hike in July to probe its change of stripes. The lack of quantitive easing program afforded the central bank the agility to make the shift and is now second only to the U.S. Federal Reserve in raising rates. Oil prices have jumped by more than 1 percent after comments from Saudi Arabia and Nigeria during the Organization of the Petroleum Exporting Countries (OPEC) compliance summit in Russia.
The CAD is trading near a two year high versus the dollar. The USD/CAD broke through the 1.25 price level briefly as political strife in Washington has sapped the USD from any momentum form the upcoming Federal Open Market Committee (FOMC) meeting. The Fed has hiked rates twice already, but inflation has stalled. The lack of economic indicator releases last week put too much emphasis on the ongoing Trump Administration’s Russian probe investigation. This week the highlight will be the FOMC statement which is not expected to bring major insights and the advanced estimate of the second quarter of US gross domestic product (GDP) to be released no Friday, July 28 at 8:30 am EDT.
Auto sales drove wholesale trade in May. Wholesale transactions rose 0.9 percent beating the 0.5 percent estimates and continue to show a consistent pace of growth for the Canadian economy. Monthly GDP figures will be released on Friday with an estimate of 0.2 percent growth matching the same pace reported last month, a slowdown from the positive 0.5 percent growth reported in May.
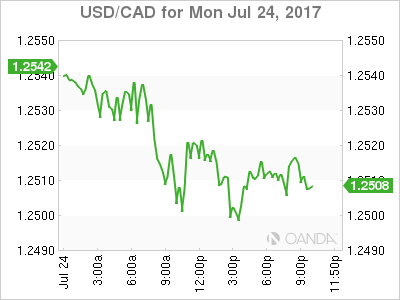
The USD/CAD lost 0.301 in the last 24 hours. The currency pair is trading at 1.2503 as the CAD got a boost from oil prices following the OPEC meeting in Russia. Positive wholesale trade numbers on a bare weekly economic calendar got the loonie off to a good start to the week.
Auto sales were also a highlight of the retail sales report published on Friday, helping sales beat the 0.2 percent forecast with a final figure of 0.6 percent. Removing sales of new and used automobiles told a less optimistic picture with a drop of 0.1 percent. Inflation also appears to be slowing down with a loss of 0.1 percent in June. Annual inflation was 1 percent and below the 2 percent target by the Bank of Canada (BoC).
Overall the positive retail sales validate the actions of the central bank who hiked rates earlier in the month by 25 basis points. The Canadian benchmark rate is now 0.75 percent and the BoC is not alone in moving ahead with tighter monetary policy despite low inflation. Forecasters still see a second interest rate hike before the end of the year, with October the most likely candidate.
Stable oil prices and US dollar weakness have amplified the positive effect of the Canadian rate hike for the loonie. The currency has appreciated touching an important psychological 80 cents versus the dollar. NAFTA negotiations are expected to kick off in August and so far there is optimism on the trade deal being tweaked instead of an intensive reworking. Elections in Mexico and the US also incentivize the two nations to expedite the talks.
Energy prices surged 1.586 percent on Monday. The price of West Texas Intermediate is trading at $48.56 as OPEC member Saudi Arabia agreed to limit its output by around 1 million daily barrels and previously exempt producer Nigeria agreed to cap when its production reaches 1.8 million barrels a day, it currently ranges near 1.6 million.
The meeting between OPEC and Russia to discuss compliance will open the door for the next steps for energy producers. A bigger cut in production after the agreed extension is in the cards, but there are some voice of dissent as current levels are causing distress for countries who depend on oil sales to balance their budget.
Rising production in Nigeria and Libya as well as a higher rig count in the US have put downward pressure on energy prices despite the efforts of the OPEC and other major producers. Political infighting could fracture the OPEC with Saudi Arabia and Iran casting doubts on how unified the group will be going forward. Compliance with the production cut agreement has been stellar, but mostly on the efforts of Saudi Arabia, which could be entering a seasonal push for higher production along with comments from other OPEC members like Ecuador and Venezuela that want to increase production to balance their country’s budget.
Saudi Arabia has once again agreed to carry a bigger burden by cutting their production further, but Russia was very vocal that all countries need to implement the cuts in full. The words from Russian energy minister Alexander Novak could be aimed at Ecuador that has already said it needs to raise production targets, but in the grand scheme of things Ecuador is one of the smallest producers in the group and given the way its Chinese debt is structured it is the Asian giant that has a bigger say in production and probably something the OPEC members could work with.
Market events to watch this week:
Tuesday, July 25
10:00 am USD CB Consumer Confidence
9:30 pm AUD CPI q/q
9:30 pm AUD Trimmed Mean CPI q/q
Wednesday, July 26
4:30 am GBP Prelim GDP q/q
10:30 am USD Crude Oil Inventories
2:00 pm USD FOMC Statement
2:00 pm USD Federal Funds Rate
Thursday, July 27
8:30 am USD Core Durable Goods Orders m/m
8:30 am USD Unemployment Claims
Friday, July 28
8:30 am CAD GDP m/m
8:30 am USD Advance GDP q/q
Gold Pauses After Strong Gains to End Week
Gold is almost unchanged at the start of the week. In Monday's North American session, spot gold is trading at $1256.01, up 0.07% on the day. On the release front, Existing Home Sales dropped to 5.52 million, missing the estimate of 5.59 million. On Tuesday, the US releases CB Consumer Confidence.
Gold continues to impress, gaining 1.7% last week. The metal is currently trading at its highest level since mid-June, as political turmoil in Washington has led to investors snapping up gold, a traditional safe-haven asset. Investors are increasingly concerned over Donald Trump, whose brash behavior and unconventional style has not been a good fit for the highest office in the land. Trump had another bad week, as his flagship healthcare bill, which aims to replace Obamacare, stalled in the Senate after two Republican senators said they would not support the bill. Trump has failed to pass any significant legislation so far in his term, and investors are becoming more skeptical as to whether Trump will have any more success with his tax reform and fiscal spending plans. With the Democrats forming a rock-solid wall of opposition, dissension among Republican lawmakers, many of whom are uneasy about Trump, could doom attempts by the White House to get bills through Congress. There was more bad news as Robert Mueller, the special counsel who is investigating alleged collusion between Trump and Russian officials during the US election, said he would review business transactions involving Trump as well as his associates. Trump has said that Mueller's scope is limited to Russia, so the stage could be set for a Nixon-type showdown between the president and the special counsel investigating wrongdoing by the president.
Aside from growing political risk in the US, gold prices rose last week after the European and Japanese central banks announced that they would continue their accommodative monetary policy. As well, the ECB and BoJ maintained the current policy of ultra-low interest rates, at 0.00% and 0.10% respectively. With the economies in the eurozone and Japan both showing improvement, there has been pressure on policymakers to reduce stimulus. However, inflation levels in the eurozone and Japan are well below the target of 2%, and the banks have reiterated that they will not taper asset-purchases until inflation levels move higher. The ECB is expected to revisit its monetary stance at its September meeting, and if policymakers decide to tighten monetary policy, gold prices could head lower.
Five Ways to Earn Additional Income Trading Forex
Many people turn to forex trading in hopes of growing their account equity. This dream is made possible by the fact that with leverage and low deposit requirements, just about anyone with a disposable income can deposit funds and can start trading forex.
However, only a handful of people can make the cut. Building consistent income trading forex is something that takes years of practice and dedication. For traders who have made the cut, trading forex can become a bit monotonous.
Of course, the forex markets never sleep and there save for occasional bouts of quiet trading sessions, for the most part, there is always some news or event that will drive the markets.
If you are one of those successful forex traders and looking to make additional income by leveraging your trading skills, here are five ways to do it.
1. Forex Signals Service
As an independent trader, you can always take advantage of selling your skills. This can be done by offering a trading signals service. You don't have to be tech-savvy in order to set up a website. Even using a free blogging platform and by using Paypal, you can easily set up a small website and charge fees for the trading signals or recommendations that you can offer.
For those who find this to be too tedious, you can always make use of existing platforms such as the MQL5 marketplace or sign up for ZuluTrade and begin selling your signals.
The advantage with this is that you don't have to worry about marketing your services, especially if you have enough (live) trading history to back up your case. This alone will become your main unique selling point.
The downside of using such services is, of course, the commissions that will be deducted. However, if your trading is good enough, then that shouldn't be a problem as you can easily expect your subscriber list to grow.
2. Teaching how to trade forex
For those who are averse to the idea of selling their forex signals, teaching or educating others can be a great way to do so. Using websites such as Udemy, or even Youtube, you can teach others how to trade.
Given the fact that beginner forex traders are always on the lookout for a good trading strategy, you can easily use the above platforms to showcase your skills. You can also combine social media such as Facebook, Twitter, and LinkedIn to build a thorough profile to establish yourself as an expert.
You should not limit yourself to just teaching trading strategies, but also explain how the markets work. While this will take a bit of time, you can spend just under 10-minutes a day to share your videos and links on social media and establish yourself as an authority on either a particular style of trading or explaining how the markets work.
3. Become a forex analyst
Traders who are good at their job can also look at working as a freelance forex analyst. Given the number of forex brokers that are now available, you can easily earn additional income as an analyst.
Of course, to be successful at this, you need to spend some time analyzing the markets and writing about it as well. Not many are skilled at writing, but with enough practice, you can hone this skill as well.
Given the fact that a trader already does their analysis of the markets they will be trading, becoming a forex analyst can be one of the easiest ways to make additional income from forex trading.
4. Becoming a PAMM fund manager
The PAMM model allows traders with the right skill sets to start their own small fund. Under this model, you will be managing the funds of other traders or clients. This puts you at an advantage as your trading equity grows and you will be able to manage your money and contract sizes accordingly.
To become one of the top PAMM fund managers, you need to keep at it on a steady and slow pace. It might take years before your PAMM account is attractive enough for others to place their funds with you.
The PAMM also allows you some flexibility in how you want to charge your clients. Typically, PAMM fund managers set a percentage of the profits as commissions. The downside to working as a PAMM fund manager is that you need to be cautious as you will be using your client's funds.
Therefore, unless you are really good at trading and know how to manage risk, this is not recommended for all.
5. Write a book
Amazon Kindle is one of the best ways to get your book published in an electronic format. Although Kindle books are priced very less if you have an idea or a topic in mind you can always publish an e-book with ease.
There are already quite a few individuals who publish their trading books on forex. The advantage is that you don't need the backing of a big publisher and the Amazon Kindle library gives you a ready market.
Sometimes the topics you choose could be very niche which means that you might be compelled to work on a more popular trading subject. Regardless, spending a few hours a day, it is not that difficult to draft a Kindle book. For just a few bucks, you can always have your content proof-read and tweaked to make it ready for publishing.
The above methods can help traders to earn some extra money. While it might not yield big results immediately, doing something related to what you do already can be a simple way to break the monotony of trading.
While there are many other methods to earn additional income trading forex, remember that no matter what option you choose, make sure that you do not end up compromising on your main source of income which is trading.