Sample Category Title
Daily Technical Outlook And Review: EUR/USD, GBP/USD, USD/JPY, AUD/USD, NZD/USD, USD/CAD, XAU/USD, WTI
EUR/USD
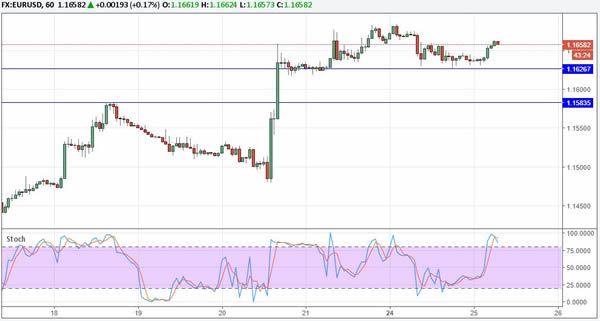
The Euro found decent support at 1.1625 and recovered from there. However, resistance at 1.17 is tough, and the pair will not clear this obstacle that easily.
Should EUR/USD gather enough momentum and break above 1.17 though, the rally is likely to extend to 1.20 in the near-term. To the downside, initial support is seen at 1.1625, followed by stronger support at 1.1585.
GBP/USD
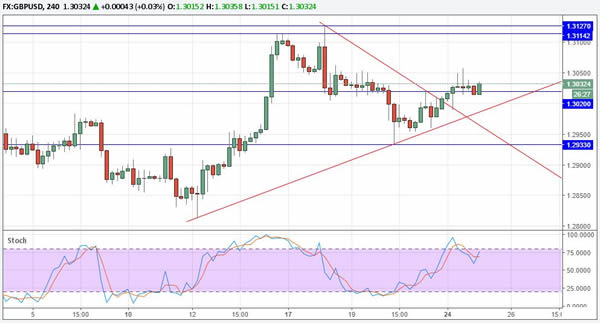
Cable broke out of the triangle pattern and above 1.3020 resistance. This suggests that we could see another test of the major resistance area between 1.3115-30.
However, Cable is unlikely to gather enough strength to break above it. Further consolidation seems likely, and trading the 1.29-1.31 range the preferred strategy for now.
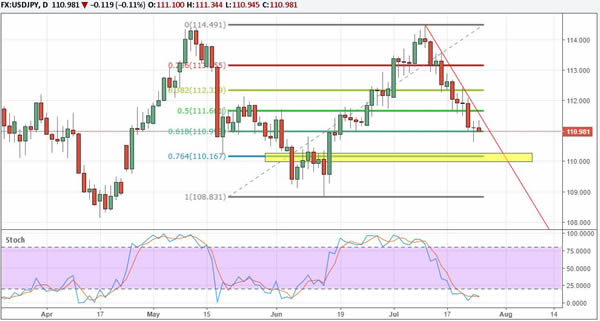
USD/JPY
The outlook for USD/JPY is looking increasingly bearish. A test of 110 should follow soon. A clear break would likely trigger further momentum selling and pave the way for a retracement to 108.
To the topside, heavy resistance is seen at 111.80-112.
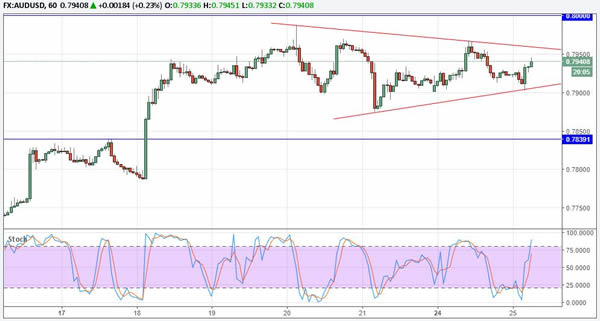
AUD/USD
Volatility has been subdued in the past few trading days, but the Aussie Dollar remains well bid. AUD/USD is currently consolidating within a triangle pattern and resistance is seen at 0.7950 and ahead of 0.80. It is unlikely that we will see a major breakout ahead of Wednesday's inflation data, but the pair could test 0.80 soon.
Above that level, there is little resistance until 0.82. To the downside, look for support at the rising trendline from Friday's low and the former key resistance level at 0.7840.
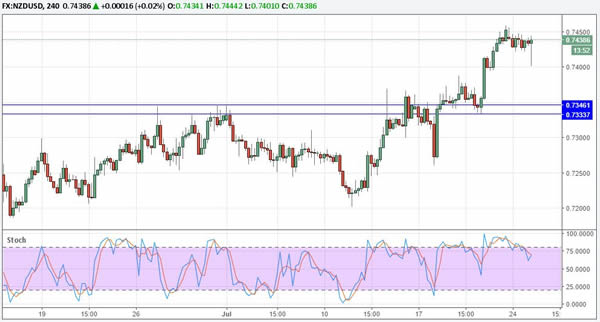
NZD/USD
The New Zealand Dollar is heavily overbought in the short-term, and a retracement seems likely before the uptrend continues.
Initial support is seen at 0.74, but NZD/USD is likely to test 0.7335/45 support soon.
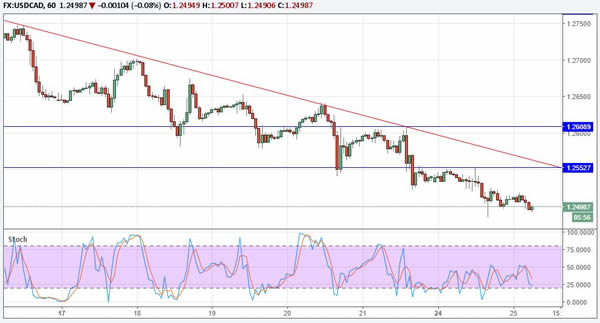
USD/CAD
The downtrend remains clearly intact and further losses seem likely. However, USD/CAD is approaching a major support level at 1.2460 and should see a bounce from there.
Selling interest will remain high though. Resistance at 1.2550/55 and again at 1.2600/10 will not be easy to overcome.
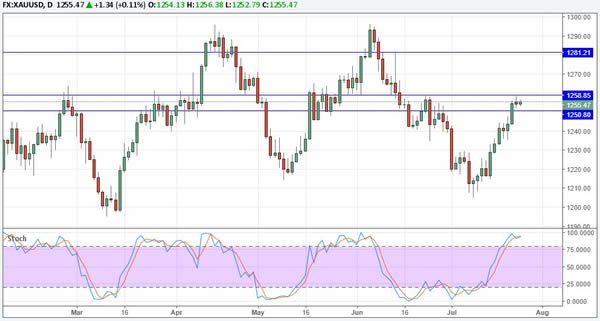
XAU/USD
The short-term outlook for XAU/USD is bullish following the clear break above $1250 resistance. Gold is currently struggling a bit with resistance at $1259, but it should be able to extend gains to at least $1280 in the near-term.
Buying dips is the preferred strategy, and decent demand should be seen near the former resistance level at $1250.
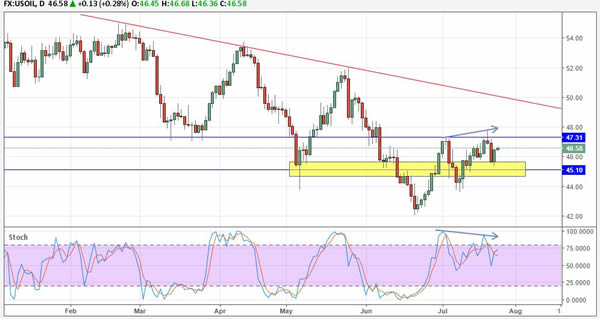
WTI
Price has bounced ahead of $45 support, and this signals that WTI could have another test of the $47.30-50 resistance area. Above that, WTI would face solid resistance in form of the falling trendline from the February high, followed by the $50 level.
Overall, the short-term outlook is positive, but WTI faces strong resistance ahead of $50.
GBP/USD Candlesticks and Ichimoku Analysis
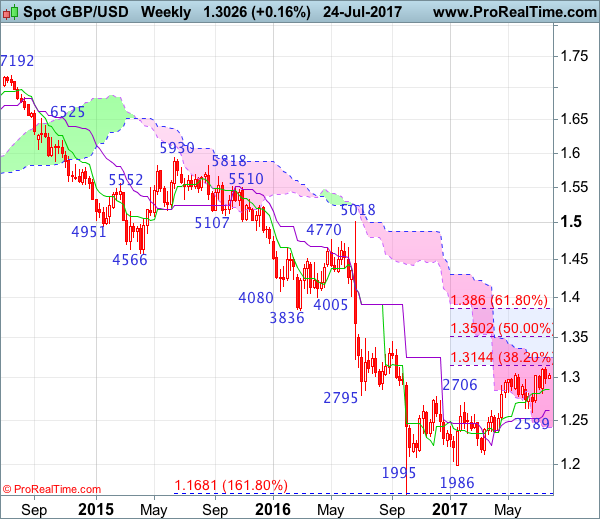
Weekly
• Last Candlesticks pattern: Long white candlestick
• Time of formation: 16 Jan 2017
• Trend bias: Down
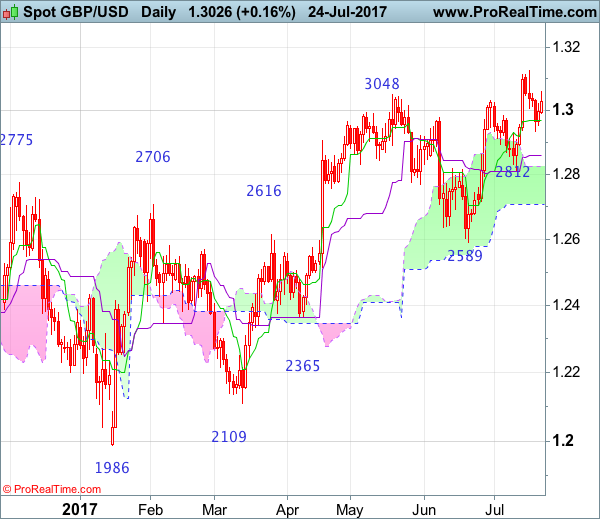
Daily
• Last Candlesticks pattern: Long white candlestick
• Time of formation: 18 Apr 2017
• Trend bias: Near term up
GBP/USD – 1.3030
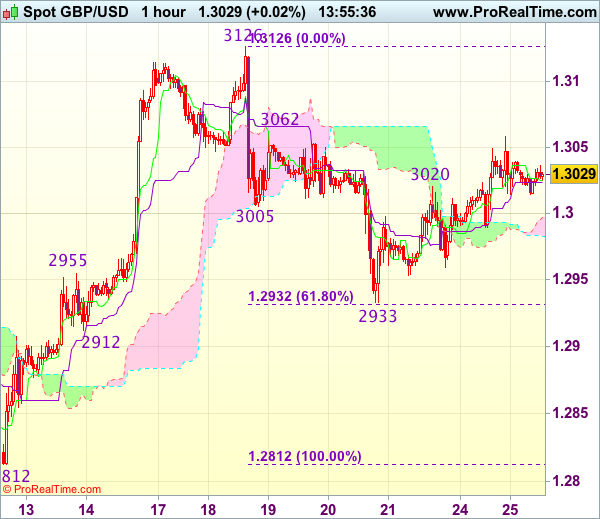
Although cable has recovered after finding support at 1.2933 late last week and initial upside risk of a recovery cannot be ruled out, as long as resistance at 1.3126 (this month’s high) holds, consolidation with mild downside bias is seen for another retreat, below said support at 1.2933 would bring weakness to the Kijun-Sen (now at 1.2858) but a daily close below there is needed to signal a temporary top is formed there, bring retracement of recent upmove to 1.2790-00, then towards 1.2730-35, having said that, reckon the lower Kumo (now at 1.2707) would limit downside and price should stay well above support at 1.2589, bring rebound later.
On the upside, expect recovery to be limited to 1.3060-65 and bring another retreat later. Above said resistance at 1.3126 would extend recent erratic upmove from 1.1986 low to 1.3140-45 (38.2% Fibonacci retracement of 1.5018-1.1986), then towards 1.3200, however, reckon upside would be limited to 1.3250-60 and price should falter well below 1.3300, risk from there is seen for a retreat later.
Recommendation: Hold short entered at 1.3040 for 1.2840 with stop above 1.3140
On the weekly chart, although cable rose briefly to as high as 1.3126 earlier this month, price has traded narrowly after retreating from there, suggesting consolidation would be seen with mild downside bias for weakness to 1.2933, break there would bring test of the Tenkan-Sen (now at 1.2858), however, only a break below support at 1.2812 would suggest a temporary top is formed, bring weakness to 1.2755-60, then test of support at 1.2706 but cable needs to penetrate support at 1.2589 to provide confirmation, bring retracement of recent upmove to 1.2550 and possibly towards previous support at 1.2515 which is expected to hold from here.
On the upside, above said resistance at 1.3126 would extend the erratic rise from 1.1986 low (formed back in Jan 2017) is stallion progress and may extend gain to 1.3140-50 (38.2% Fibonacci retracement of 1.5018-1.1986), however, reckon upside would be limited to the upper Kumo (now at 1.3247), the British pound’s upside should falter below 1.3300-10, bring retreat later next month or in late Q3.
GBPJPY Poised To Extend Losses
Key Points:
- Despite the broader uptrend, losses are looking likely to extend.
- Various technical readings suggest that the pair could sink to 142.27
- The broader pennant should remain intact.
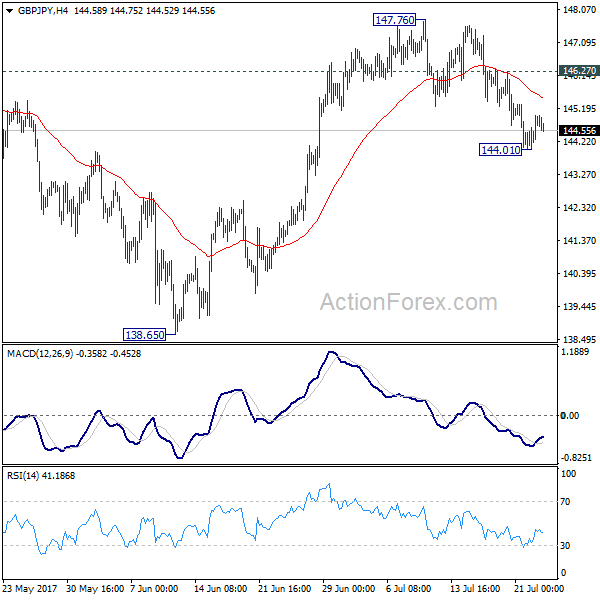
Most JPY crosses have been fairly faithfully retracing a consolidation pattern over the past few months and the GBPJPY is no exception to this. However, unlike the more often quoted USDJPY, the GBPJPY is actually well placed to see further losses which could result in a slump all the way back to the 142.27 handle – by no means an immaterial downtrend.
Indeed, in contrast to the USDJPY, the GBPJPY is quite some distance away from the downside constraint of its pennant. As a result, it could still stumble significantly before encountering any strong support. Indeed, even the 100 day EMA – often a decent source of dynamic support/resistance – is notably below price action which gives the bears some room to manoeuvre.
The main snag here is the fact that, broadly speaking, the pair looks rather bullish from a technical perspective. What’s more, if the USDJPY starts to recover in the coming days, this could translate into a broader weakening of the Yen which would spur the bulls into action and potentially prevent the forecasted slip from occurring.
Nevertheless, if we look past the EMA bias, there is actually a fairly solid argument for losses to extend over the coming days. Firstly, the parabolic SAR is still indicating that a downtrend is in play and it is also in little danger of inverting this bias any time soon. Secondly, the MACD reading remains in a bearish configuration which suggests that the bears aren’t ready to throw in the towel just yet.
Overall, we expect losses but they should be relatively limited for a number of reasons. For one thing, the long-term trendline is unlikely to give way any time soon unless a major fundamental upset is seen. This is only reinforced by the fact that the 61.8% Fibonacci level intersects with this line around the 142.27 price. Moreover, the 100 day moving average will certainly be helping to rebuff the bear’s efforts at or even before this level so chances of a breakout in the near-term seem fairly remote.
USD/CHF Candlesticks and Ichimoku Analysis
Weekly
• Last Candlesticks pattern: Shooting star
• Time of formation: 7 Mar 2017
• Trend bias: Sideways
Daily
• Last Candlesticks pattern: Morning star
• Time of formation: 9 May 2017
• Trend bias: Near term up
USD/CHF – 0.9467
Although the greenback has fallen again after brief bounce to 0.9622 last week, adding credence to our view that recent decline from 1.0344 (2016 high) is still in progress and downside bias remains for this move to extend weakness to 0.9390-00, then towards 0.9330-40, having said that, loss of downward momentum should prevent sharp fall below 0.9290-00 and price should stay above 0.9255-60, risk from there has increased for a rebound to take place later.
On the upside, whilst recovery to 0.9520-25 cannot be ruled out, reckon the Tenkan-Sen (now at 0.9570) would limit upside and bring another decline to aforesaid downside targets. Above said resistance at 0.9622 would defer and suggest a temporary low is possibly formed and bring a stronger rebound to 0.9659, break there would confirm and signal correction of recent decline has commenced, then further gain to resistance at 0.9701 would follow but still reckon upside would be limited to 0.9738 resistance and price should falter below previous resistance at 0.9771.
Recommendation: Sell at 0.9570 for 0.9370 with stop above 0.9670

On the weekly chart, last week’s selloff formed a long black candlestick and price broke below indicated previous support at 0.9444 last week, adding credence to our bearish view that recent decline from 1.0344 (2016 high) is still in progress and downside bias remains for weakness to 0.9350, then towards 0.9290-00, however, loss of near term downward momentum should prevent sharp fall below 0.9250 and reckon 0.9200-10 would hold from here, risk from there has increased for a rebound later.
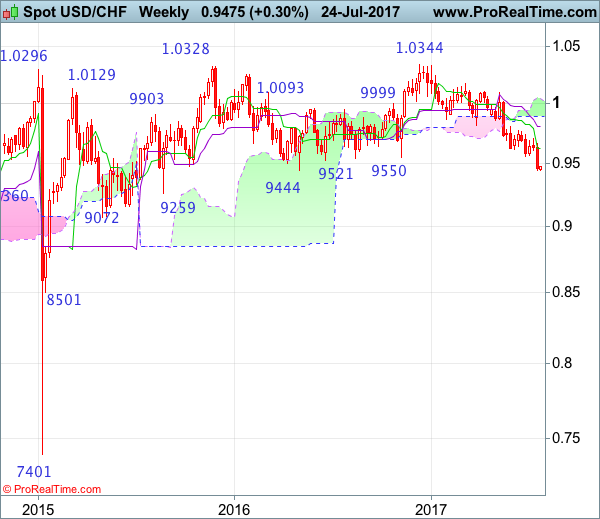
On the upside, although initial recovery to 0.9520-25 cannot be ruled out, upside should be limited to 0.9590-00 and price should falter below 0.9622-23 (previous resistance and current level of the Tenkan-Sen), bring another decline later. A weekly close above said resistance at 0.9622-23 would suggest a temporary low is possibly formed, bring a stronger rebound to 0.9659, then test of resistance at 0.9701 but above latter level is needed to provide confirmation, bring retracement of recent decline to previous resistance at 0.9771 , however, still reckon resistance at 0.9808 would limit upside and price should falter well below the lower Kumo (now at 0.9894).
Cable Prepares To Start A Bullish Fundamental Trend
Key Points:
- UK GDP likely to return a 0.3% q/q print.
- U.S. FOMC decision could provide some volatility.
- Watch for a challenge to the 1.31 handle in the week ahead.
The Cable had a relatively poor week after the UK Inflation figures surprised the market, coming in well below estimates at 0%, and sending the Cable in to selloff mode. Subsequently, the bears piled into short positions and the pair declined to close the week sharply lower at 1.2992. However, as we enter the new week it appears as if there might be some support for the Cable and a retest of the 1.31 handle is likely in the next few days.
Last week proved highly negative for the Cable as the pair reacted to a sharp slip in the UK CPI figures to 0% (0.2% prev). Subsequently, there was plenty of negative sentiment for the Cable and the pair fell sharply throughout most of the week to close at around the 1.2992 mark. Further supporting the short side push was the U.S. Initial Jobless Claims figures which came in below estimates at 233k. However, there was a bright spot for the Cable with the UK Retail Sales rising sharply to 0.9% m/m which was promptly ignored by the market.
Looking ahead, it could be a relatively volatile week for the Cable with the UK GDP and U.S. Core Durable Goods Orders due for release. In particular, the UK GDP figures could prove relatively critical with the key indicator set to return a slight uptick to 0.3% q/q. Subsequently, any surprises could bring with it some sharp volatility. In addition, the U.S. Core Durable Goods Order figures are due to hit the wires and most economists have the indicator returning a 0.4% m/m print. This represents a slight uptick and could prove bullish for the greenback as long as the FOMC doesn't spoil the party. Speaking of the FOMC, the central bank is likely to keep rates on hold at 1.25% in pending meeting. However, keep a close watch on the content of Yellen's speech following the event because it is highly likely that she may attempt to slowly play down the forward guidance around rates. The reality is that the central bank has largely been boxed into a corner and will now likely look towards QE taper as their next form of tightening.
From a technical perspective, the Cable's recent fall has taken it back below the 1.30 handle and as long as support at 1.2811 remains intact we could see a resumption of the uptrend soon. However, our initial bias is neutral for the week ahead given that the RSI Oscillator is still relatively close to overbought levels and price still has some distance to fall. Support is currently in place for the pair at 1.2810, 1.2713, and 1.2636. Resistance exists on the upside at 1.3112, 1.3168, and 1.3377.
Ultimately, the Cable could be in for a relatively volatile week as the pair faces down with the looming spectre of the U.S. FOMC meeting and the UK GDP results. However, the short term fundamental trend is one of the strength for the Cable so we should see the needed gains in the coming week but watch for potential jawboning from the Fed.
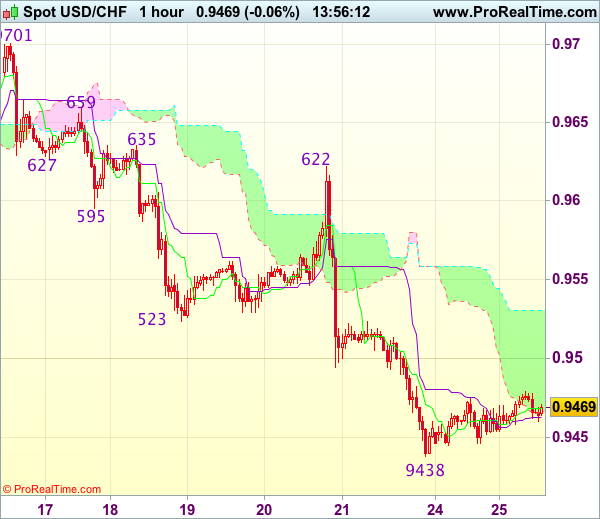
Trade Idea : USD/CHF – Sell at 0.9555
USD/CHF - 0.9461
Most recent candlesticks pattern : N/A
Trend : Near term down
Tenkan-Sen level : 0.9468
Kijun-Sen level : 0.9463
Ichimoku cloud top : 0.9530
Ichimoku cloud bottom : 0.9468
Original strategy :
Sell at 0.9555, target: 0.9455, Stop: 0.9590
Position : -
Target : -
Stop : -
New strategy :
Sell at 0.9555, target: 0.9455, Stop: 0.9590
Position : -
Target : -
Stop : -
As the greenback has remained under pressure after recent selloff, bearishness is seen for the decline from 1.0340 top to resume after consolidation, whilst initial corrective bounce to 0.9500 and then 0.9520-25 cannot be ruled out, reckon the upper Kumo (now at 0.9530) would limit upside and bring another decline later, below support at 0.9438 would extend recent decline to 0.9405-10 but loss of momentum should limit downside to 0.9375-80, price should stay above 0.9350, risk from there is seen for a rebound later.
In view of this, we are looking to sell dollar on subsequent recovery as 0.9550-55 should limit upside and bring another decline. Above 0.9580-85 would suggest a temporary low is formed instead, bring a stronger rebound towards resistance at 0.9622 which is likely to hold from here.
Trade Idea : GBP/USD – Sell at 1.3100
GBP/USD - 1.3039
Most recent candlesticks pattern : N/A
Trend : Near term up
Tenkan-Sen level : 1.3028
Kijun-Sen level : 1.3024
Ichimoku cloud top : 1.2997
Ichimoku cloud bottom : 1.2983
Original strategy :
Sell at 1.3100, Target: 1.2980, Stop: 1.3135
Position : -
Target : -
Stop : -
New strategy :
Sell at 1.3100, Target: 1.2980, Stop: 1.3135
Position : -
Target : -
Stop : -
Cable edged higher yesterday to 1.3058, suggesting near term upside risk remains for the recovery from 1.2933 to bring further gain to resistance at 1.3062, however, if our view that top has been formed at 1.3126 is correct, upside would be limited to 1.3100 and bring another decline later, below 1.2985-90 would signal an intra-day top is formed but break of 1.2950-55 is needed to signal the rebound from 1.2933 has ended, bring weakness to 1.2932-33 (61.8% Fibonacci retracement of 1.2812-1.3126 and said support), break there would extend the fall from 1.3126 top to previous support at 1.2912.
In view of this, we are looking to sell cable on further recovery as 1.3100-10 should limit upside. A firm break above 1.3100 would abort and suggest the fall from 1.3127 has ended instead, bring retest of this level but only break there would shift risk back to upside for further gain to 1.3150-60.
ECB Following Its Renewed Focus On Growth
ECB Following Its Renewed Focus On Growth
Market Movers Today
It will be a fairly thin data calendar today, where the main release will be German ifo expectations. The decline in the German manufacturing PMI suggests the ifo expectations index will decline and, in our view, there is downside risk to consensus expectations. Although the figure is expected to remain at an elevated level, a cont inued downward t rend could support a softer tone from the ECB following its renewed focus on growth.
US Conference Board consumer confidence is due for release in the afternoon. The figure is expected to decline in line with other indicators for consumer confidence but to stay at a high level. Overall, t he optimism expressed in t he survey indicators aft er T rump's victory is likely to continue to fade in coming months.
Please note we have published our FOMC preview ahead of the meeting on Wednesday. We expect the Fed to maintain the Fed funds target range and wait until September to make an announcement on ‘quantitative tightening'. See FOMC Preview - No major changes, 24 July 2017.
In the Scandies, the quarterly SSB Industrial Confidence release in Norway is due. In Q1, the manufacturing index returned to positive territory for the first time since Q3 14. We expect a further rise today, which would be in line with the signals from, e.g. the manufacturing PMIs, hinting at a re-acceleration in manufacturing product ion in 2017. In Sweden, the monthly PPI release will give us more insight into the inflation dynamics, which are important for the Riksbank.
Selected Market News
It was quiet overnight with most Asian equity indices roughly flat this morning. In currency markets, EUR/USD failed t o break through Friday's low as a rebound erased yesterday's losses, highlighting currency markets' current predisposition to buy the single currency. Oil has moved a little higher after Saudi Arabia promised yesterday to cut crude oil exports further in combating low oil prices. Otherwise, the key takeaway from the OPEC meeting in St . Petersburg was rising frustrations from Saudi Arabia and Russia with other countries' falling compliance with the current output cuts. Fundamentally, we st ill think OPEC has lost control with the oil curve amid increased global competition and we at tribute the past month's rise to a weaker USD, better-than-expected Chinese data improving the global demand out look and US producers adjust ing product ion (see rig count chart).
In the US, yesterday's PMI release saw the manufacturing index surprise posit ively by rebounding to 53.2 (consensus: 52.3) while the service index met expectat ions at 54.2 – both pointing to further expansion. The manufacturing index has over the past months painted a less upbeat picture than ISM manufacturing and as such, we regard part of yesterday's rebound as convergence. Overall, the US PMI package suggests a decent start to Q3 with GDP growth around 2%, which is more or less in line with our own project ions.
In Greece , the government has out lined a plan to return to debt markets for the first time since 2014, as a 5Y bond will prove an important market test . The announcement follows S&P 's decision on Friday to upgrade its Greek debt out look from ‘stable' to ‘positive'.
GBP/JPY Daily Outlook
Daily Pivots: (S1) 144.17; (P) 144.58; (R1) 145.16; More
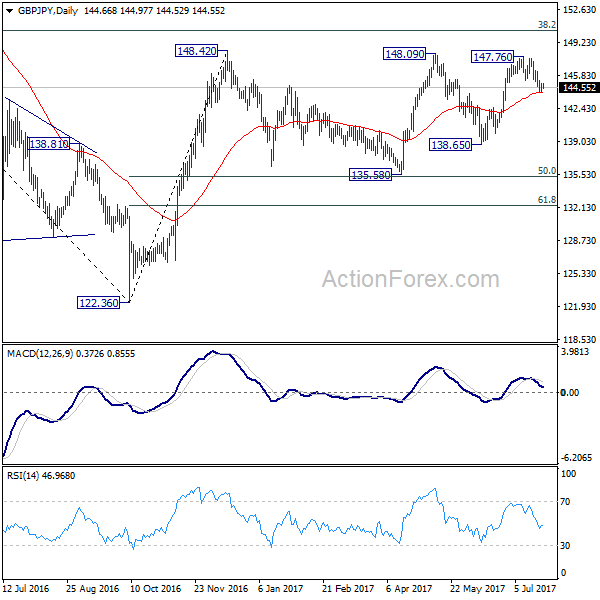
A temporary low is in place in GBP/JPY at 144.01 and intraday bias is turned neutral first. On the downside below 144.01 will extend the decline from 147.76 and target 138.65 support and below. But we'd expect strong support from 135.58 to contain downside and bring rebound. On the upside, above 146.27 minor resistance will turn bias back to the upside for 147.76 instead.
In the bigger picture, rise from medium term bottom at 122.36 is expected to continue to 38.2% retracement of 196.85 to 122.36 at 150.43. Decisive break there will carry long term bullish implications and pave the way to 61.8% retracement at 167.78. In case the sideway pattern from 148.42 extends, we'd be looking for strong support from 135.58 and 50% retracement of 122.36 to 148.42 at 135.39 to contain downside.
EUR/JPY Daily Outlook
Daily Pivots: (S1) 128.87; (P) 129.31; (R1) 129.76; More...
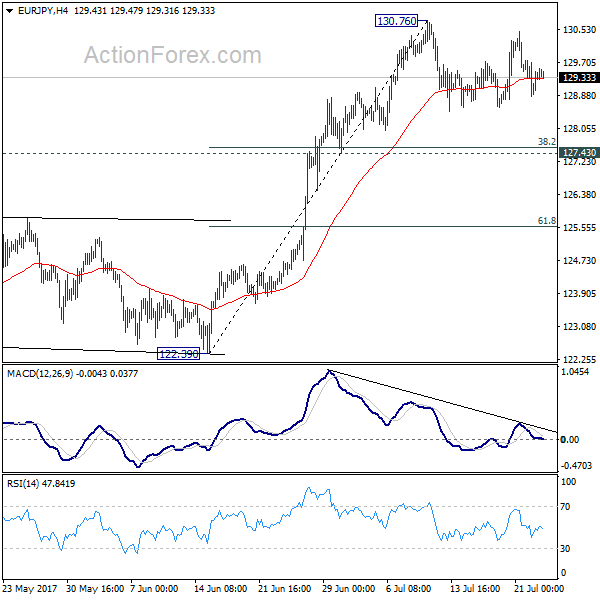
No change in EUR/JPY's outlook as consolidation from 130.76 is still in progress. Intraday bias stays neutral for the moment. Deeper fall could be seen. But downside should be contained by 127.43 cluster support (38.2% retracement of 122.39 to 130.76 at 127.56) and bring rebound. Above 130.76 will extend the larger rally to next key fibonacci level at 134.20.
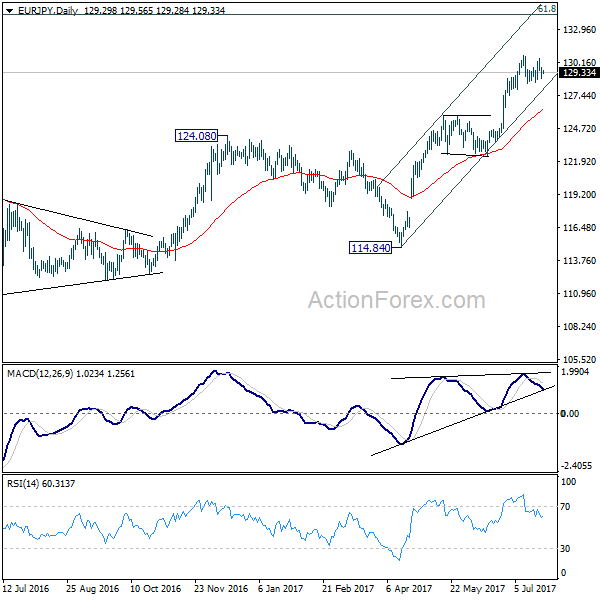
In the bigger picture, the down trend from 149.76 (2014 high) is completed at 109.03 (2016 low). Current rally from 109.03 should be at the same degree as the fall from 149.76 to 109.03. Further rise is expected to 61.8% retracement of 149.76 to 109.03 at 134.20. Sustained break there will pave the way to key long term resistance zone at 141.04/149.76. Medium term outlook will remain bullish as long as 124.08 resistance turned support holds.